Varying miR-193b-3p Expression Patterns in Breast Cancer Cell Lines Indicates Its Potential for Cancer Management Strategies

authors:

avatar Zahra Sadat Hashemi 1 , avatar Mehdi Forouzandeh Moghadam 2 , avatar Esmaeil Sadroddiny 1 , *

Department of Medical Biotechnology, School of Advanced Technologies in Medicine, Tehran University of Medical Sciences, Tehran, Iran
Department of Medical Biotechnology, Faculty of Medical Sciences, Tarbiat Modares University, Tehran, Iran

how to cite: Hashemi Z S, Forouzandeh Moghadam M, Sadroddiny E. Varying miR-193b-3p Expression Patterns in Breast Cancer Cell Lines Indicates Its Potential for Cancer Management Strategies. Int J Cancer Manag. 2018;11(8):e63540. https://doi.org/10.5812/ijcm.63540.

Abstract

Background:

Metastasis-associated miRNA (metastamiR) harbors a great potential to confine metastasis as the most lethal aspect of cancer. miR-193b-3p is an anti-metastatic miRNA, whose expression significantly decreases in metastatic breast cancer cells.

Objectives:

In the present study, the expression patterns of different cell-lines were investigated, following an effective miR transfection strategy.

Methods:

Double-stranded oligo of mature miR-193b-3p, miR-negative, and miR-LacZ were designed and cloned into pcDNA6.2gw/EmGFP plasmid. Calculating the population doubling time (PDT), non-tumorigenic MCF-10A, tumorigenic but non-metastatic MCF-7, and metastatic MDA-MB231 were transfected by Lipofectamin2000 and Express-In. The expressions of miR-193b-3p and miR-191 have been quantified by Real-time PCR 48 hours after transfection. Scratch, Transwell migration, and Matrigel invasion assays have been carried out to assess the migration and invasion levels of the cell-lines.

Results:

The PDT (21.27 ± 0.43, 28.18 ± 0.34, and 35.83 ± 0.44 hours) and miR-193b-3p relative expression before transfection (100, 42 and 8) were measured for MCF-10A, MCF-7, and MDA-MB231 cell-lines, respectively. Better transfection results were obtained based on nano-liposome method. The expression of the miR-193b-3p was increased 32, 19 and, 65 fold-change. The rate of invasion in metastatic cells was 6.6 fold-higher in comparison to MCF-7 cells.

Conclusions:

Higher expression rate of the miRNA is anticipated to occur, following miR-mimic transfection. However, the observed differential patterns of miRNA increase in the context of different cell-lines, indicating the involvement of more complicated cellular pathways. Scrutinizing these cellular mechanisms could open new horizons in cancer therapy and management strategies.

1. Background

Despite years of investigation in the field of breast cancer and attempts to find a proper treatment, it remains as an ongoing challenge with the highest female death rate among all cancer types. Metastatic complications are the main cause of breast cancer originated deaths (1). The survival rates of breast cancer are reported 80% and 90% in developed countries, around 60% in middle-income countries (such as Iran (2)) and below 40% in low-income countries (Global Health Estimates, WHO 2014) (3). A meta-analysis on the survival rates of Iranian breast cancer patients indicated that the minimum and maximum survival rates were 48% and 87% (for five years) (4). The reported wide range of survival rates is due to the varying prevention, screening, and diagnosing programs at early stage as well as kinds of employed treatments. Unfortunately, metastasis interferes with survival rates and it is responsible for 75% decrease in the survival rate of patients suffering from breast cancer (5). As such, there is an imminent need to deal with this problem at the first line of battle against breast cancer. Novel and precisely designed approaches should be devised to circumvent the insufficiency of conventional methods against metastasis (6).

Recent advent of microRNAs attained an increasing attention in the field of metastatic investigations (7). microRNAs are highly conserved small non-coding RNAs, involved in post-translational gene expression control (8). The recent reports indicated that the members of metastamiR family bear pro- and anti-metastasis effects (9, 10). MiR-193a/b is a member of metastamiR family capable of inhibiting metastatic genes by post-transcriptional silencing and changing the expression of several proteins related to metastasis and cell signaling. The KEGG and IPA pathway analysis software revealed that miR-193b targets 5genes in Wnt and TGF-b signaling pathways (11-14). Although miR-193b sequence shares 88% identity with miR-193a, it is encoded by a separate gene with distinct regulation (15, 16). miR-193b has been implicated as a tumor suppressor in breast cancer. Several hundreds of genes have been identified by Miranda and PicTar servers to be down regulated by microRNA-193b. Sequence analyses have confirmed the existence of miR binding sites within these genes. Among the estrogen receptor-α (ER) and urokinase-type plasminogen activator (uPA) were the genes involved in breast cancer pathology, which are targeted by the 3p-strand (17, 18).

Various investigations have been carried out to assess the therapeutic applications of the miRNAs. The original levels of miRNA expression for the deleted miRNAs or the miRNAs with declined expression amounts could be restored by miRNA restoration-based therapy approaches, using miRNA-mimic or miRNA-mimetic. In the present study, we aimed at evaluating the possibility of inhibiting the invasive behavior of metastatic breast cells by restoring the miR-193b-3p expression levels. To this end, we have designed a miRNA containing construct to transfect different cell-lines. Ultimately, our approach resulted in a more robust and efficient inhibition of the metastatic process in the targeted metastatic cell-line.

2. Methods

2.1. Recombinant Vector Generation

Since miR-negative and miR-lacZ (as positive control) were delivered as single stranded molecules, double-stranded oligomers hybridization reaction was performed according to the kit instructions. Each double-stranded fragment (miR-negative and miR-lacZ) as positive control was inserted into the pcDNA6.2-GW/EmGFP (Invitrogen) linear vector by a ligation reaction according to the instructions provided by the T4 DNA ligase enzyme (Thermo Fisher Scientific).

The mature miR-193b sequence was obtained from miRBase database and miR193b-mimic oligomer design was done based on the instructions provided by BLOCK-iTPolII miR RNAi Expression Vector Kits (Invitrogen) along with SalI/BgLII restriction sites.

The resulting sequence was chemically synthesized (BIOMATIK, Canada) in pSBK vector. This sequence was amplified by M13-primers (Table 1) and digested by SalI/BgLII enzymes to clone into pcDNA6.2-GW/EmGFP/miR-negative vector.

Table 1.

Sequences Used in This Study

Forward and Reverse Primers
PrimersSequence 5’-3’
M13- forwardAGGGTTTTCCCAGTCACG
M13- reverseGAGCGGATAACAATTTCACAC
pcDNA- forwardGGCATGGACGAGCTGTACAA
pcDNA- reverseCTCTAGATCAACCACTTTGT
miR193b-confirmation colony PCR - forwardCTGGCCCTCAAAGTCC
Top and Bottom miR Oligo Strands
Top strand
miR-neg oligo5’TGCTGAAATGTACTGCGCGTGGAGACGTTTTGGCCACTGACTGACGTCTCCACGCAGTACATTT-3’
miR-LacZ oligo5’TGCTGAAATCGCTGATTTGTGTAGTCGTTTTGGCCACTGACTGACGACTACACATCAGCGATTT-3’
miR-193b-3p5’TGCTGAACTGGCCCTCAAAGTCCCGCTGTTTTGGCCACTGACTGACAGCGGGACTGAGGGCCAGTT-3’
Bottom strand
miR-neg oligo5’CCTGAAATGTACTGCGTGGAGACGTCAGTCAGTGGCCAAAACGTCTCCACGCGCAGTACATTTC-3’
miR-LacZ oligo5’CCTGAAATCGCTGATGTGTAGTCGTCAGTCAGTGGCCAAAACGACTACACAAATCAGCGATTTC-3’
miR-193b-3p5’CCTGAACTGGCCCTCAGTCCCGCTGTCAGTCAGTGGCCAAAACAGCGGGACTTTGAGGGCCAGTTC-3’

Finally, 3 vectors were obtained: mimic-miR-193b recombinant vector (pcDNA6.2-GW/EmGFP/miR193b), miR-negative vector (pcDNA6.2-GW/EmGFP/miR-negative), and miR-lacZ positive vector (pcDNA6.2-GW/EmGFP/miR-lacZ). A reporter plasmid was additionally employed to assess the knockdown of β-galactosidase gene.

2.2. Cell Culture

All 3 cell-lines were obtained from Pasteur Institute of Iran, Cell Bank. MDA-MB231 was grown in DMEM (Gibco) + 10% FBS (Gibco) and 1% penicillin/streptomycin solution. The medium for MCF-10A cells is DMEM/F12 + 5% donor horse serum, 20 ng/mL EGF, 10 μg/mL insulin, and 0.5 μg/mL hydrocortisone. MCF-7 cell-line was propagated in DMEM/F12, 10% FBS, and 1% penicillin/streptomycin.

2.3. Population Doubling Time

After two/three passages, the cells were grown 48h without serum in order to synchronize them (approximately 85% of the cell population) in the G/S transition. Then, 25000 cells were cultured in each well of a 24-well plate. After 24, 48, and 72h, cells were harvested for counting and, then, discarded. The counting was done in triplicate, using 3 wells of the same cell-line. The whole process of cell counting was repeated three times to be sure that cells are in exponential/log phase.

2.4. Optimization of Transfection

The present study was performed in 3 different 24-well plates for 3 cell-lines. For each plate, we had 5 groups in triplicate: untreated, negative control group (transfected with pcDNA6.2-GW/EmGFP/miR-negative), test group transfected by the miR-193b recombinant vector (pcDNA6.2-GW/EmGFP/miR193b), positive control group 1 (transfected with pcDNA6.2-GW/EmGFP/miR-lacZ), positive control group 2 (transfected with pcDNA/lacZ reporter plasmid), and positive control group 3 (co-transfected with pcDNA6.2-GW/EmGFP/miR-lacZ and pcDNA/lacZ reporter plasmid).

2.4.1. Cell Seeding

To normalize the experiment condition, according to the PDT of the each cell-line at the transfection time, we have attempted to have 5 × 10⁴ cells.

2.4.2. Lipofectamine2000 (Invitrogen)

According to the manufacturer’s recommendations, Lipofectamine2000 was used at 1, 1.5, 2, and 2.5 µL concentrations with 500 ng of pcDNA6.2-GW/EmGFP/miR-negative. Then, 24, 48, and 72h after transfection, the efficiency of the process was determined by assessing green fluorescent protein (GFP) expression and flow cytometry method.

2.4.3. Express-In (Thermo-Scientific)

In order to transfect each cell-line, according to the manufacturer’s instructions 2, 2.5, and 3 µg (µL) dilutions of Express-In was used with 500 ng of pcDNA6.2-GW/EmGFP/miR-negative. After 24, 48, and 72h of transfection, flow-cytometry was used to determine the more efficient dilutions for each cell-line and quantized by Flowjo software.

2.4.4. Viability Percentage

The culture medium containing transfection reagent should be changed after 4 to 6 hours. Cell viability was checked (with and without changing culture medium) after 24, 48, and 72h of transfection by Trypan blue and flow-cytometry gating.

Viability percentage = average number of living cells/average total cell number × 100.

2.5. miRNA Isolation and Real-time PCR

miRNAs were extracted 48 hours after transfection by High-pure miRNA isolation kit (Roche). Then, cDNA was synthesized by Universal cDNA Synthesis kit (Exiqon). Real-time PCR for mature miR-193b-3p and miR-191 (as endogenous control) was done with miRCURY LNA Universal RT microRNA PCR kit by LNA-primers in triplicate form and the average values were used for relative quantification (Pfaffl method). Briefly, the cycle of the threshold (Ct) values of the target gene was normalized with the endogenous gene (miR-191); then, it was compared with a calibrator (same gene as the control without any treatment). Two-tailed Student’s t test was utilized for statistical analysis and P < 0.05 was considered significant.

2.6. Scratch Test

To study the cell migration, 3 cell-lines were cultured on 6-well plates in duplicate. Cells were given enough time to fill out the plate. To perform scratch test, a vertical line along the diameter of the well was ticked by a tip. Isolated cells were gently washed with culture medium without FBS. Then, photography was done at zero and 24h times.

2.7. Migration and Invasion Assays

2.5 × 10⁴ cells were serum-starved for 24h and plated into the top of chambers (non-coated membrane and Matrigel-coated Transwell membrane) (24-well chamber: pore size: 8 μm) (Millipore, Billerica, MA, USA) and allowed to migrate toward serum-free and 10% serum-containing medium in the lower chamber. After 24h of incubation at 37°C in a 5% CO2 humidified incubator, cells in the upper chambers were mechanically removed by wiping with a cotton swab and migrated cells to the lower surface of filter were fixed in 4% formaldehyde for 30min and stained with 0.5% crystal violet. Cell migration was scored by counting 10 random fields per filter under a light microscope by ImageJ software.

2.8. Ethics Statement

All procedures were performed according to the ethical guidelines of School of Advanced Technologies in Medicine, Tehran University of Medical Sciences.

3. Results

3.1. Vector Generation

miR-negative and miR-lacZ strands were successfully hybridized and cloned into pcDNA6.2-GW/EmGFP linear vector to construct pcDNA6.2-GW/EmGFP/miR-negative and pcDNA6.2-GW/EmGFP/miR-lacZ plasmids. Agarose gel electrophoresis confirmed the hybridization (Figure 1A). Colony PCR results (280 bp DNA band) confirmed the accuracy of cloning and transformation process (Figure 1B).

Vector generation: A) miR strand hybridization. B) Colony PCR resulted in 280 bp band. C) pBSK was amplified by M13-primers (410 bp amplicon). D) 410 bp amplicon digested by restriction enzymes (BgLII/SalI) to give 150 bp fragment that was miR-193b fragment. E) Sequencing confirmed miR-193b. F) Well1: pcDNA/EmGFP vector, well 2: pcDNA/EmGFP as linear form digested by BgLII/SalI, well 3: ladder.

In the case of miR-193b, gene amplification by M13-primers resulted in a 410 pb band (Figure 1C). Digesting this PCR product and pcDNA/EmGFP/miR-negative resulted in a 150 bp fragment (Figure 1D) and the linear vector with the digested fragment (Figure 1E). The sequencing results confirmed the cloning of the miR-193b recombinant vector (Figure 1F).

3.2. Cell’s Information

All 3 cell-lines were cultured and their cell counting curve was prepared (Figure 2A). PDT was calculated by the following formula:

PDT = duration × log2/log (final concentration) - log (initial concentration)

PDT of MDA-MB-231, MCF-7, and MCF-10A were calculated to be 21.27 ± 0.43, 28.18 ± 0.34, and 35.83 ± 0.44 hours, respectively.

Cell’s information: A) Cell counting curve. B) MCF-10A, C) MDA-MB-231, and D) MCF-7 Cell-lines by fluorescence microscopy for GFP expression were analyzed. For quantizing; Flowjo software indicated the rate of transfection.

3.3. Transfection

By PDT calculation, the day before transfection, nearly 22000 MDA-MB-231 cells, 27700 MCF-7 cells, and 31400 MCF-10A cells were seeded in 24-well plate. Final concentration of Lipofectamine2000 was optimized to be 1.5 µL for MDA-MB231 and MCF-7 and 2 µL for MCF-10A cell-lines. The transfection rates were 22%, 31%, and 7.3% for MDA-MB231 and MCF-7 and MCF-10A cell-lines. In the case of Express-In, all 3 cell-lines showed better GFP expression in 2.5 µL concentration. Fluorescence microscopy and the flow-cytometry results indicated that, generally, the rate of transfection in Express-In treatment was lower than liposomal-based treatment. The results of Flowjo software are depicted in Figure 2B. The rate of positive transfection was indicated by the rate of β-galactosidase activity, which ranged from 0% (positive control group 1: transfected with pcDNA6.2-GW/EmGFP/miR-lacZ) to 7% (positive control group 3: co-transfected with pcDNA6.2-GW/EmGFP/miR-lacZ and pcDNA/lacZ reporter plasmid) in comparison to the 100% activity (positive control group 2: transfected with pcDNA/lacZ reporter plasmid).

3.4. Real-Time PCR

Generally, 1000 ng/μL of the miRNAs was used for cDNA synthesis. For proper comparison and data normalization of Real-time PCR results, the rate of transfection (percentage of GFP expression levels) has been applied in miR expression level. MiR-193b-3p relative expression has been shown to be 100 ± 3.0, 42 ± 2.2, and 8 ± 0.9 in non-tumorigenic MCF-10A, tumorigenic, but non-metastatic MCF-7 and metastatic MDA-MB231 before transfection as a basal expression (Figure 3A). After transfection (based on nano-liposome method by Lipofectamine), the expression of miR-193b-3p increased to 32.6, 19.7, and 65.3 fold-change in MCF-10A, MCF-7, and MDA-MB231, respectively.

The results normalized for miR-191 are shown as relative expression. Data represent means ± SD of 3 separate tests (*P < 0.05): A) Relative basal microRNA expression (the cells without any treatment) is plotted in the y-axis. All values were calibrated to basal miR-193b expression in MCF-10A cells: Pfaffl = E miR193b + 1(CtMCF-10A-CtMCF-7 or MDA-MB-231)/E miR191 + 1(CtMCF-10A-CtMCF-7 or MDA-MB-231). P value, compared to the MCF-10A cells for each cell-line, was significant. B) Relative miR-193b expression compared to the untreated cells: Pfaffl = E miR193b + 1(Ct untreated cells-Ct treated cells)/E miR191 + 1(Ct untreated cells-Ct treated cells). P value by miR-negative treatment was analyzed. C) miRNA binding site and seed sequence of miR-193b-3p.

3.5. Scratch Test

The distance between two edges of the scratch was calculated by software and the wound closure formula (Figure 4A). Calculated distances indicated 0.2, 2.9, and 4.7 units of moving forward the edges for MCF-10A, MCF-7, and MDA-MB231, respectively.

A) Scratch test: All cell-lines at zero time (top row) and 24h (bottom row). B) Migration and Invasion assay in MCF-7 and MDA-MB-231.

3.6. Invasion and Migration

Invasion assay results confirmed the scratch test results. For scratch and invasion tests, MCF-10A cell-line results were not significant. Transwell migration and Matrigel invasion assays were performed on untreated and treated MCF-7 and MDA-MB231 cells (Figure 4B). After transfection, the results indicated the reduction in both migration and invasion ability of MCF-7 and MDA-MB-231 cells compared to the control groups.

4. Discussion

Several research groups have investigated microarray profiling expression data and, consequently, have introduced miR-191 as a reference gene for Real-time PCR (19-21). Therefore, we have used miR-191 as a reference gene for our Real-time PCR. The pre-miR sequence of miR-193b is composed of 83 nucleotides, which forms a loop structure and, then, processes two double-stranded 22 nucleotide sequences (called 5p and 3p). The suitable miR-193b strand, which includes desired seed sequence for down regulation of metastatic targets, was selected based on the results obtained from Targetscan server. The 3p-strand of miR-193b contains the target sequences for ERα and uPA, which are involved in breast cancer pathology. The 3'UTR of these mRNAs contains the miRNA binding sites. It should be noted that the MCF-10A and MDA-MB-231 cell-lines are triple negative (basal form: ER-, PR-, HER2-) and, therefore, lack the estrogen receptor, while MCF-7 is luminal form (ER+) and, therefore, expresses the estrogen receptor (22). The seed match region is 7mer-m8 and is exactly matched to positions 2 to 8 of the mature miRNA (the seed + position 8) (Figure 3C).

These 3 cell-lines have shown different properties in scratch test (Figure 4A). However, uPA is a metastasis-associated protein that supports cell migration and matrix proteases activity. It means that miR-193b affects their invasiveness through regulation of uPA. This miR is correlated with the metastatic behavior of MDA-MB-231 cell-line. Due to its lowest miR-193b expression, MDA-MB-231 has the most invasion and migration (Figure 4B). Ectopic expression of miR-193b-3p repressed 3’UTR of its target. Li et al. demonstrated that ectopic expression of miR-193b inhibited the invasion and migration of MDA-MB-231 cells in transwell migration assay (17). MDA-MB231 has the lowest inherent miR-193b-3p expression and MCF-10A has the highest. However, unexpected results were obtained following the transfection. MDA-MB231 showed 65.3 fold-increase regarding miR-193b expression, while MCF-7 just showed 19.7 fold-increase. Simply, this means that the order of ectopic expression from the highest to the lowest amount was as MDA-MB231, MCF-10A, and MCF-7. The mechanism underlying this phenomenon could be explained by the contribution of different cellular and molecular players.

The obtained results could be rooted in the inherent properties of the MDA-MB231 cell-line. These cells have numerous inhibitory systems to lay down the miR-193b expression compared to the normal cells or MCF-10A cells. Following the transfection, an “Explosive expression” occurs, which could act as a negative feedback to inhibit those inhibitory systems and trigger an expression release. It should be taken into account that based on the concept of target-mediated miRNA protection (TMMP) miR degradation seems unlikely to be the mechanism behind the low levels of miR-193b. They hypothesized that the high mRNA abundance of target genes can block miRNA release and protects it from degradation by exoribonucleases (23). Assuming that all cell lines retain the episomal vector for nearly 1 week with no differential expression from the CMV-promoter or varying copy numbers, we hypothesized that some inhibitory factors should be activated to inhibit the miR-193b expression on a genomic level and hold the miR-193b level at 19.7 fold-increase.

Among the employed cell-lines, MCF-7 is ER+ and other 2 are ER-, while all 3 cell lines express uPA (
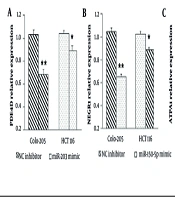
24). This fact leads us to a second hypothesis. In the event of ectopic expression, cells are forced to have higher miR-193b expression. Since this extra miR-193b could target the 3’UTR of ER gene within the ER + cells like MCF-7, these cells could activate their inhibition systems to deal with ongoing situation and successfully guard their ER. To stabilize their condition, MCF-7 cells will decrease ER expression by their existing negative feedback loop (18, 25). MDA-MB231 does not have this protection; thus, they do not decrease their miR-193b expression. Moreover, Leivonen et al. showed that miR-193b induces the accumulation of MCF-7 cells in the G1/G0 phase of the cell cycle due to ER signaling (18). In line with the results of this study, the PDT of MCF-7 cell-line increased after miR-mimic transfection, but PDT of the other 2 cell lines were not significantly changed (data are not shown).

These results could be the consequence of events, which are based on the properties of MCF-10A cells. Before the miR-mimic transfection, these cells have the highest level of expression; however, surprisingly after transfection, it descended to the second place. This non-tumorigenic and non-transformed cell-line has stable cell signaling and pathways, which lead to normal like culturing properties with highest PDT (Figure 2A). It seems that MCF-10A cells try to maintain this stable and normal condition in a relatively constant genetic background, which is disturbed by ectopic endurance line of the cell for miR-193b expression (26). There should be a threshold level of miR-193b for MCF-10A cells, which defines the endurance line of the cell for miR-193b. Most likely, MDA-MB231 cells do not harbor such a threshold line due to its physiological properties and the miR-193b expression is not balanced with existing inhibitory systems.

The results in Figure 4B indicated that the percent of migration is higher than invasion. But, the rate of migration in MDA-MB231 was 2.7 fold-higher than MCF-7, and the rate of invasion was 6.6 fold-higher than MCF-7 in non-transfected cells. These data demonstrated that the MDA-MB231 is an invasive representative of breast cancer cell-line. It is interesting that after miR transfection, the rate of invasion decreased to 5.7, which indicated the effect of miR-193b as a tumor suppressor miR. Therefore, we investigated the effective miR transfection in miR-mimic and miR-193b-3p restoration-based therapy as an efficient anti-metastatic strategy for cancer therapy.

4.1. Conclusions

Since most breast cancer cases are associated with the high levels of expressed miR-193b and ER, there should be a complex regulatory network between these molecules. Despite the potential roles of breast cancer growth, a clear mechanistic understanding of miR-193b remains obscure. It seems that miR-193b could trigger different regulatory and inhibitory cascades based on the physiological properties of the target cells. These activated pathways lead to lower metastasis behavior in the context of ER+ cell-lines of breast cancer, which could be construed as a candidate remedy to manage breast cancer growth.

Acknowledgements

References

  • 1.

    Al Zaabi AA. Identification and Characterization of Serum Biomarkers Associated with Breast Cancer Progression. Brigham Young University; 2016.

  • 2.

    World-Bank. List of Economies: Lower and Middle Income Countries. 2016.

  • 3.

    Coleman MP, Quaresma M, Berrino F, Lutz JM, De Angelis R, Capocaccia R, et al. Cancer survival in five continents: a worldwide population-based study (CONCORD). Lancet Oncol. 2008;9(8):730-56. [PubMed ID: 18639491]. https://doi.org/10.1016/S1470-2045(08)70179-7.

  • 4.

    Rahimzadeh M, Pourhoseingholi MA, Kavehie B. Survival Rates for Breast Cancer in Iranian Patients: a Meta- Analysis. Asian Pac J Cancer Prev. 2016;17(4):2223-7. [PubMed ID: 27221922].

  • 5.

    Geiger TR, Peeper DS. Metastasis mechanisms. Biochim Biophys Acta. 2009;1796(2):293-308. [PubMed ID: 19683560]. https://doi.org/10.1016/j.bbcan.2009.07.006.

  • 6.

    Eccles SA, Welch DR. Metastasis: recent discoveries and novel treatment strategies. Lancet. 2007;369(9574):1742-57. [PubMed ID: 17512859]. [PubMed Central ID: PMC2214903]. https://doi.org/10.1016/S0140-6736(07)60781-8.

  • 7.

    Hashemi ZS, Khalili S, Forouzandeh Moghadam M, Sadroddiny E. Lung cancer and miRNAs: a possible remedy for anti-metastatic, therapeutic and diagnostic applications. Expert Rev Respir Med. 2017;11(2):147-57. [PubMed ID: 28118799]. https://doi.org/10.1080/17476348.2017.1279403.

  • 8.

    Nasiri M, Peeri M, Matinhomaei H. Endurance Training Attenuates Angiogenesis Following Breast Cancer by Regulation of MiR-126 and MiR-296 in Breast Cancer Bearing Mice. Int J Cancer Manag. 2017;10(6). https://doi.org/10.5812/ijcm.8067.

  • 9.

    Hurst DR, Edmonds MD, Welch DR. Metastamir: the field of metastasis-regulatory microRNA is spreading. Cancer Res. 2009;69(19):7495-8. [PubMed ID: 19773429]. [PubMed Central ID: PMC2756311]. https://doi.org/10.1158/0008-5472.CAN-09-2111.

  • 10.

    Choghaei E, Khamisipour G, Falahati M, Naeimi B, Mossahebi-Mohammadi M, Tahmasebi R, et al. Knockdown of microRNA-29a Changes the Expression of Heat Shock Proteins in Breast Carcinoma MCF-7 Cells. Oncol Res. 2016;23(1-2):69-78. [PubMed ID: 26802653]. https://doi.org/10.3727/096504015X14478843952906.

  • 11.

    Hashemi ZS, Moghadam MF, Soleimani M. Comparison of TGFbR2 down-regulation in expanded HSCs on MBA/DBM scaffolds coated by UCB stromal cells. In Vitro Cell Dev Biol Anim. 2015;51(5):495-506. [PubMed ID: 25539863]. https://doi.org/10.1007/s11626-014-9854-y.

  • 12.

    Kumar S, Kumar A, Shah PP, Rai SN, Panguluri SK, Kakar SS. MicroRNA signature of cis-platin resistant vs. cis-platin sensitive ovarian cancer cell lines. J Ovarian Res. 2011;4(1):17. [PubMed ID: 21939554]. [PubMed Central ID: PMC3205057]. https://doi.org/10.1186/1757-2215-4-17.

  • 13.

    Mohammadpour H, Khalili S, Hashemi ZS. Kremen is beyond a subsidiary co-receptor of Wnt signaling: an in silico validation. Turk J Biol. 2015;39:501-10. https://doi.org/10.3906/biy-1409-1.

  • 14.

    Wu K, Zhao Z, Ma J, Chen J, Peng J, Yang S, et al. Deregulation of miR-193b affects the growth of colon cancer cells via transforming growth factor-beta and regulation of the SMAD3 pathway. Oncol Lett. 2017;13(4):2557-62. [PubMed ID: 28454433]. [PubMed Central ID: PMC5403328]. https://doi.org/10.3892/ol.2017.5763.

  • 15.

    Tsai KW, Leung CM, Lo YH, Chen TW, Chan WC, Yu SY, et al. Arm Selection Preference of MicroRNA-193a Varies in Breast Cancer. Sci Rep. 2016;6:28176. [PubMed ID: 27307030]. [PubMed Central ID: PMC4910092]. https://doi.org/10.1038/srep28176.

  • 16.

    Mamoori AM, Wahab R, Islam F, Lee K, Smith RA, Gopalan V, et al., editors. Downregulation of miR-193a and its correlation with clinical and pathological behavior of colorectal cancer. AACR Annual Meeting. Washington, DC. American Association for Cancer Research (AACR); 2017.

  • 17.

    Li XF, Yan PJ, Shao ZM. Downregulation of miR-193b contributes to enhance urokinase-type plasminogen activator (uPA) expression and tumor progression and invasion in human breast cancer. Oncogene. 2009;28(44):3937-48. [PubMed ID: 19701247]. https://doi.org/10.1038/onc.2009.245.

  • 18.

    Leivonen SK, Makela R, Ostling P, Kohonen P, Haapa-Paananen S, Kleivi K, et al. Protein lysate microarray analysis to identify microRNAs regulating estrogen receptor signaling in breast cancer cell lines. Oncogene. 2009;28(44):3926-36. [PubMed ID: 19684618]. https://doi.org/10.1038/onc.2009.241.

  • 19.

    Bargaje R, Hariharan M, Scaria V, Pillai B. Consensus miRNA expression profiles derived from interplatform normalization of microarray data. RNA. 2010;16(1):16-25. [PubMed ID: 19948767]. [PubMed Central ID: PMC2802026]. https://doi.org/10.1261/rna.1688110.

  • 20.

    Chang KH, Mestdagh P, Vandesompele J, Kerin MJ, Miller N. MicroRNA expression profiling to identify and validate reference genes for relative quantification in colorectal cancer. BMC Cancer. 2010;10:173. [PubMed ID: 20429937]. [PubMed Central ID: PMC2873395]. https://doi.org/10.1186/1471-2407-10-173.

  • 21.

    Peltier HJ, Latham GJ. Normalization of microRNA expression levels in quantitative RT-PCR assays: identification of suitable reference RNA targets in normal and cancerous human solid tissues. RNA. 2008;14(5):844-52. [PubMed ID: 18375788]. [PubMed Central ID: PMC2327352]. https://doi.org/10.1261/rna.939908.

  • 22.

    Shokrollahi Barough M, Hasanzadeh H, Barati M, Pak F, Kokhaei P, Rezaei-Tavirani M. Apoptosis/Necrosis Induction by Ultraviolet, in ER Positive and ER Negative Breast Cancer Cell Lines. Iran J Cancer Prev. 2015;8(6). https://doi.org/10.17795/ijcp-4193.

  • 23.

    Chatterjee S, Fasler M, Bussing I, Grosshans H. Target-mediated protection of endogenous microRNAs in C. elegans. Dev Cell. 2011;20(3):388-96. [PubMed ID: 21397849]. https://doi.org/10.1016/j.devcel.2011.02.008.

  • 24.

    Zheng L, Cai Y, Zhou L, Huang P, Ren X, Zuo A, et al. Benzoquinone from Fusarium pigment inhibits the proliferation of estrogen receptor-positive MCF-7 cells through the NF-kappaB pathway via estrogen receptor signaling. Int J Mol Med. 2017;39(1):39-46. [PubMed ID: 27878233]. [PubMed Central ID: PMC5179178]. https://doi.org/10.3892/ijmm.2016.2811.

  • 25.

    O'Day E, Lal A. MicroRNAs and their target gene networks in breast cancer. Breast Cancer Res. 2010;12(2):201. [PubMed ID: 20346098]. [PubMed Central ID: PMC2879559]. https://doi.org/10.1186/bcr2484.

  • 26.

    Chavez KJ, Garimella SV, Lipkowitz S. Triple negative breast cancer cell lines: one tool in the search for better treatment of triple negative breast cancer. Breast Dis. 2010;32(1-2):35-48. [PubMed ID: 21778573]. [PubMed Central ID: PMC3532890]. https://doi.org/10.3233/BD-2010-0307.