1. Background
Dynamic contrast enhanced magnetic resonance imaging (DCE-MRI) is the most sensitive imaging method to detect breast cancer (BC) (1). Background parenchymal enhancement (BPE), which represents normal fibro-glandular tissue enhancement in DCE-MRI, is considered to relate to hormonally active glandular tissue (2). BPE is thought to be under the effect of blood flow in dense breast tissue and may represent breast activity (3). BPE is reported to be higher in younger women with hormonally active breast tissue and it varies among patients (2, 4).
Mammographic breast density and BC risk are strongly associated (5). Some studies showed correlations between breast density at mammography and fibroglandular tissue (FGT) at MR imaging (6). These points suggest that there may be a similar association between MR imaging of FGT, BPE, and BC.
The relation between BPE and BC is not fully understood. BPE may be correlated with BC risk (4, 7, 8), and, thus, BPE can be used for BC risk stratification and for monitoring chemoprevention (3, 4). However, this association remains controversial (2).
The aim of this study is to investigate the correlation between BPE and BC and the differences in the BPE patterns in benign and malignant lesions and in pre and post-menopausal women.
2. Methods
2.1. Design
In this analytic study in the first semester of 2017, we included 128 consecutive breast MRI cases (pre-menopausal or post-menopausal) selected via simple random sampling, who provided written informed consent referred to different clinicians. We recorded existed data without any intervention and, then, the correlation between BPE and BC was measured. Indications for breast MRI were vague questionable findings on mammography and sonography result, discrepancy of ultrasound and mammography, clinical findings without compatible finding in conventional imaging, planning before surgery and follow-up of previous probably benign type lesions. We recorded existed data without any intervention. Patients with the history of breast surgery, radiotherapy, or chemotherapy were excluded from the study. A dedicated surface breast coil was used and the same techniques were performed for all patients, using a 1.5 Tesla MRI scanner. A blinded breast radiologist evaluated the images. Localization, T1-weighted non-fat-suppressed sequences, and T2-weighted fat-suppressed sequences were performed, following the standard protocols. Six sequences were obtained after a rapid bolus injection of 0.1 mmol/L gadopentetate dimeglumine (Magnevist, Bayer, and Germany), and subtracted them from the non-contrast images on a pixel-by-pixel basis.
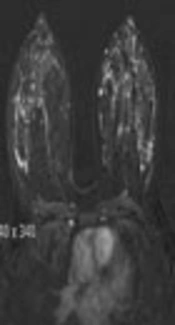
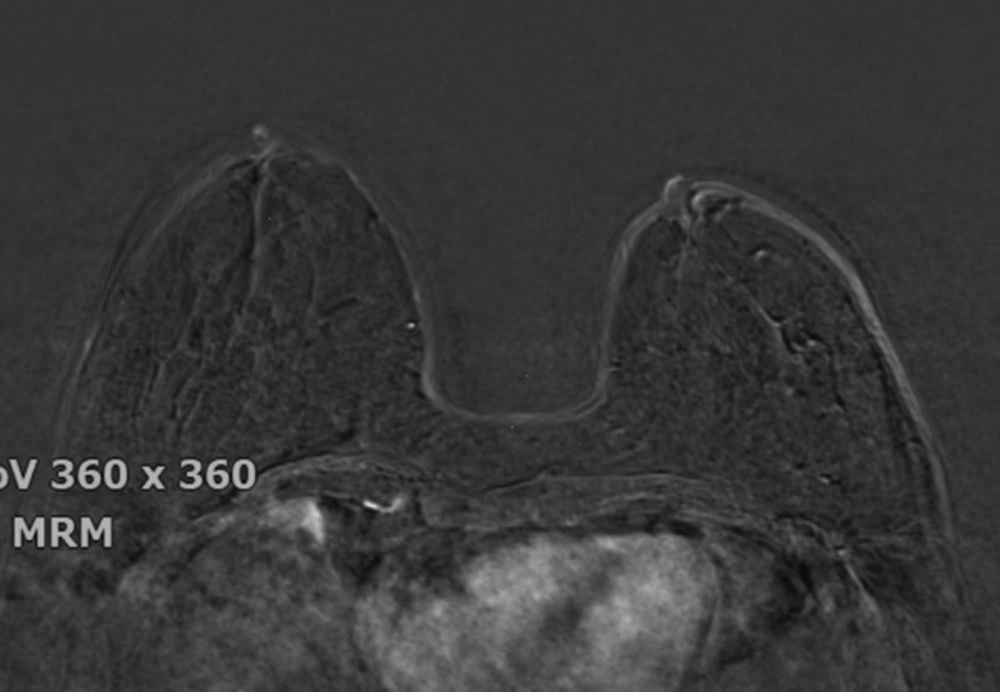
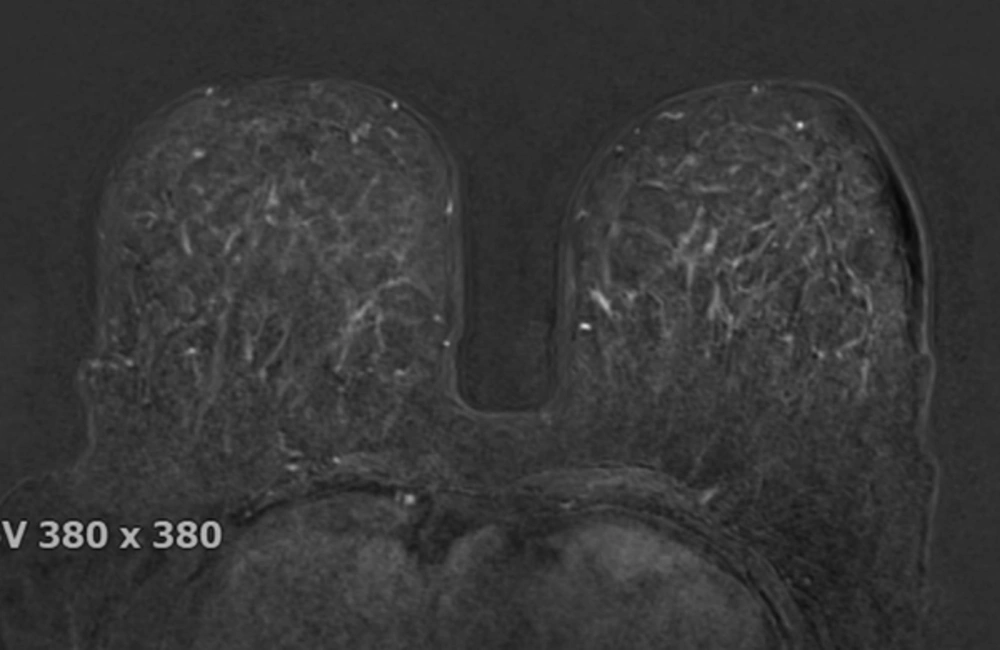
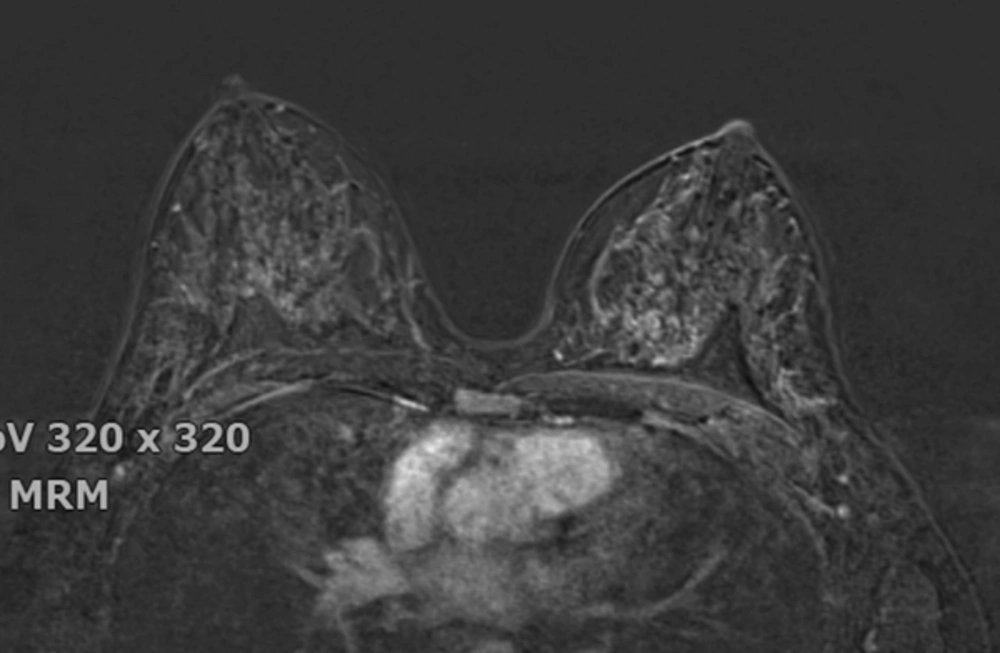
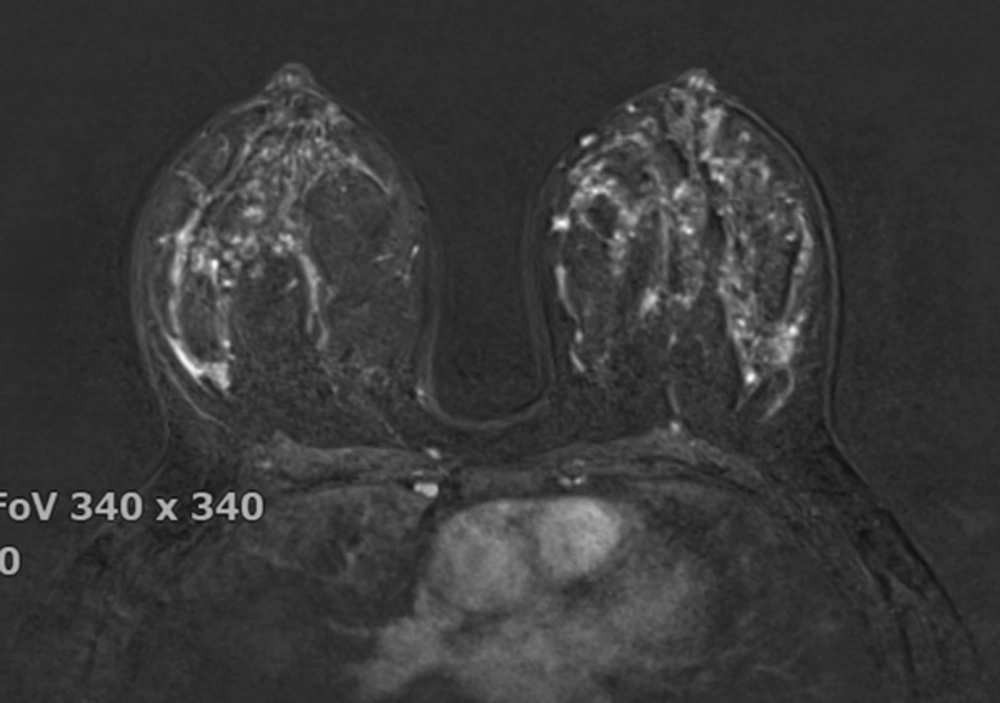
The breast BPE was visually assessed and referred to the volume of enhancement and the intensity of enhancement, which was categorized based on the fifth edition of the BI-RADS (Breast Imaging Reporting and Data System) criteria as minimal, mild, moderate, and marked (9) (Figures 1 - 4). FGT was also visually assessed, using a combination of T2 and T1-weighted images. The amount of FGT was graded based on the BI-RADS criteria as fatty (< 25% of breast comprised glandular tissue), scattered (25% - 50% of breast comprised glandular tissue), heterogeneously dense (51% - 75% of breast comprised glandular tissue), or dense (> 75% of breast comprised glandular tissue).
2.2. Data Acquisition
MS Office Excel (Microsoft, Redmond, USA) was used during the medical records review to gather data including age, menopausal status, MRI findings (BPE, FGT), BI-RADS score, and histopathological type of breast lesion (benign, in situ, and invasive).
2.3. Data Analysis
The results of the present study were reported, using descriptive statistics, including frequency distribution, mean, and standard deviation. Age was compared between categories, using ANOVA, while categorical variables (e.g. BPE) were compared, using Chi-square and Fisher’s exact tests. The significance level was set at 0.05. All analyses were conducted, using SPSS v.22 (IBM Corp., Armonk, USA).
2.4. Ethical Considerations
All identity-revealing information were preserved and informed written consent was taken from all participants in a confidential and anonymous way. This study was conducted according to the principles of the Declaration of Helsinki and the participating researchers declare no conflict of interest.
3. Results
As presented in Table 1, the participants’ age ranged from 18 to 74 years, with a mean (± standard deviation) of 42.43 (± 10.82) years. Eighty-nine (69.5%) patients were hormonally active (pre-menopausal), with a median of 7.00 days from their last menstrual period and a mean age of 37.61 ± 7.76 years; 39 (30.5%) patients were in the menopausal phase, and their mean age was 53.44 ± 8.57 years. Although BPE levels increased as the mean age decreased, the analysis of variance showed no differences in age among BPE levels (P = 0.197), even within pre- and post-menopausal women (P = 0.515 and 0.234, respectively).
| Menopausal Status | Total | Background Parenchymal Enhancement | Analysis of Variancea | Fisher’s Exact Testb | ||||||
|---|---|---|---|---|---|---|---|---|---|---|
| Minimal | Mild | Moderate | Marked | df | F | p Value | Statistic | P Value | ||
| Pre-menopause | 3.85 | 1.450 | 0.234 | 9.064 | 0.026 | |||||
| Agec | 37.61 ± 7.76 | 33.89 ± 4.54 | 37.31 ± 8.93 | 39.47 ± 6.37 | 36.38 ± 8.65 | |||||
| No. (%) | 89 (69.5) | 9 (10.1) | 35 (39.3) | 32 (35.9) | 13 (14.7) | |||||
| Post-menopause | 3.35 | 0.776 | 0.515 | |||||||
| Agec | 53.44 ± 8.57 | 57.00 ± 6.75 | 53.00 ± 8.07 | 51.22 ± 11.28 | 50.00d | |||||
| No. (%) | 39 (30.5) | 9 (23.1) | 20 (51.2) | 9 (23.1) | 1 (2.6) | |||||
| All women | 3.124 | 1.583 | 0.197 | |||||||
| Agec | 42.43 ± 10.82 | 45.44 ± 13.13 | 43.02 ± 11.45 | 42.05 ± 9.01 | 37.36 ± 9.07 | |||||
| No. (%) | 128 (100.0) | 18 (14.1) | 55 (43.0) | 41 (32.0) | 14 (10.9) | |||||
Abbreviation: df, Degree of Freedom; N, Number.
aDifferences of age between “background parenchymal enhancement” categories in all, pre- and post-menopausal patients.
bAssociation between “background parenchymal enhancement” levels and menopausal status.
cValues are represented as mean ± SD.
dThis is the age of the only patient in this category.
Eighteen (14.1%), 55 (43.0%), 41 (32.0%), and 14 (10.9%) patients were classified as having a minimal, mild, moderate, and marked BPE levels, respectively. BPE was significantly associated with menopausal status (Fisher’s exact test, P = 0.026). There was more moderate and marked BPE in pre-menopausal compared to post-menopausal women (Table 1). Fatty, scattered, heterogeneously dense, and dense breast tissue were detected in 6 (4.7%), 36 (28.1%), 67 (52.3%), and 19 (14.8%) women, respectively. There was a significant association between menopausal status and FGT (Fisher’s exact = 22.984, P < 0.001). The BPE level was significantly associated with FGT (Fisher’s exact P < 0.001), and the association remained significant in both pre-menopausal and post-menopausal women (Fisher’s exact P = 0.003 and < 0.001, respectively). All 6 women with fatty breasts had minimal BPE, while women with scattered FGT showed mild BPE (69.4%) more prevalently and most women with heterogeneously dense FGT had moderate BPE (46.3%). All 19 women with dense FGT were hormonally active (Table 2).
| Fibroglandular Tissue Category | Total Count | Background Parenchymal Enhancement | Fisher’s Exact Test | ||||
|---|---|---|---|---|---|---|---|
| Minimal | Mild | Moderate | Marked | Statistic | P Value | ||
| Pre-menopausal | 20.951 | 0.003 | |||||
| Fatty | 3 (3.4) | 3 (100.0) | 0 (0.0) | 0 (0.0) | 0 (0.0) | ||
| Scattered | 16 (18.0) | 1 (6.3) | 11 (68.8) | 3 (18.8) | 1 (6.3) | ||
| Heterogeneously dense | 51 (57.3) | 3 (5.9) | 17 (33.3) | 24 (47.1) | 7 (13.7) | ||
| Dense | 19 (21.3) | 2 (10.5) | 7 (36.8) | 5 (26.3) | 5 (26.3) | ||
| Total | 89 (100.0) | 9 (10.1) | 35 (39.3) | 32 (36.0) | 13 (14.6) | ||
| Post-menopausal | 14.981 | < 0.001 | |||||
| Fatty | 3 (7.7) | 3 (100.0) | 0 (0.0) | 0 (0.0) | 0 (0.0) | ||
| Scattered | 20 (51.3) | 4 (20.0) | 14 (70.0) | 2 (10.0) | 0 (0.0) | ||
| Heterogeneously dense | 16 (41.0) | 2 (12.5) | 6 (37.5) | 7 (43.7) | 1 (6.3) | ||
| Dense | 0 (0.0) | 0 (0.0) | 0 (0.0) | 0 (0.0) | 0 (0.0) | ||
| Total | 39 (100.0) | 9 (23.1) | 20 (51.3) | 9 (23.1) | 1 (6.3) | ||
| All women | 41.162 | < 0.001 | |||||
| Fatty | 6 (4.7) | 6 (100.0) | 0 (0.0) | 0 (0.0) | 0 (0.0) | ||
| Scattered | 36 (28.1) | 5 (13.9) | 25 (69.4) | 5 (13.9) | 1 (2.8) | ||
| Heterogeneously dense | 67 (52.3) | 5 (7.5) | 23 (34.3) | 31 (46.3) | 8 (11.9) | ||
| Dense | 19 (14.8) | 2 (10.6) | 7 (36.8) | 5 (26.3) | 5 (26.3) | ||
| Total | 128 (100.0) | 18 (14.1) | 55 (43.0) | 41 (32.0) | 14 (10.9) | ||
aValues are expressed as No. (%).
Among 19 malignant cases 8 of whom after biopsy, based on BIRADS criteria, and 11 of whom were diagnosed with cancer when they did MRI. Table 3 shows that BPE was not associated with the histopathology of breast lesions (Fisher’s exact P = 0.857), even within pre-menopausal or post-menopausal women. FGT and histopathology were not associated in all subjects and within pre-menopausal or post-menopausal women (Fisher’s exact P = 0.887, 0.954, and 1.000, respectively).
| Malignant Lesion | Total Count | Background Parenchymal Enhancement | Fisher’s Exact Test | ||||
|---|---|---|---|---|---|---|---|
| Minimal | Mild | Moderate | Marked | Statistic | P Value | ||
| Pre-menopausal | 1.110 | 0.790 | |||||
| No | 75 (84.3) | 8 (10.7) | 29 (38.7) | 28 (37.3) | 10 (13.3) | ||
| Yes | 14 (15.7) | 1 (7.1) | 6 (42.9) | 4 (28.6) | 3 (21.4) | ||
| Post-menopausal | 1.805 | 0.840 | |||||
| No | 34 (87.2) | 8 (23.5) | 18 (53.0) | 7 (20.6) | 1 (2.9) | ||
| Yes | 5 (12.8) | 1 (20.0) | 2 (40.0) | 2 (40.0) | 0 (0.0) | ||
| All women | 0.846 | 0.857 | |||||
| No | 109 (85.2) | 16 (14.7) | 47 (43.1) | 35 (32.1) | 11 (10.1) | ||
| Yes | 19 (14.8) | 2 (10.5) | 8 (42.1) | 6 (31.6) | 3 (15.8) | ||
aValues are expressed as No. (%).
4. Discussion
BPE depends on breast vasculature, imaging material, and hormonal status (endogenous and exogenous), and this can limit breast MRI interpretation (7, 10). The 5th edition of the BIRADS atlas was recommend to indicate the BPE pattern during breast MR reporting (9).
Considering the menstrual cycle, other studies showed that the lowest BPE occurs during the second week of the cycle while the highest occurs during the first and fourth weeks (10, 11). It is recommended to schedule non-urgent breast MRIs during days 3 - 14 of the cycle to reduce diagnostic interference (7, 12). In this study, BPE was associated with FGT and menopausal state, and it was lower in women with post-menopausal status; it is consistent with some previously published studies (11), so there is less risk of interference by BPE in post-menopausal breast MR reporting.
Although BPE levels decreased as the mean age increased, analysis of variance showed no differences in age among BPE levels (P = 0.197), there was also no difference in age among BPE levels, either regarding or regardless of menopausal status (P = 0.515 and 0.234, respectively). It is in contrast with a study conducted by DeMartini et al. (12), who found that background parenchymal enhancement were significantly more extensive than older women in younger women.
It is well known that mammographic dense breast is a risk factor for breast cancer, with estimation of 4 - 6-fold increased risk of developing breast cancer compared with fatty breasts (13). FGT is seen in breast MRI, which can be regarded as MRI density and is correlated with visually assessed mammographic density (14). However to date, the effects of BPE on breast cancer risk still remain controversial.
The results of the present study show that BPE and FGT do not associate with BC, and elevated BPE or FGT in MRI does not make either hormonally active or hormonally inactive breasts more susceptible to malignancy; this is consistent with Bennani- Baiti et al.’s study (2), while two other recent studies by King et al. and Dontchos et al. (4, 8) concluded that BPE significantly correlated with breast cancer risk and elevated BPE resulted in as much as almost 10-fold increased breast cancer odds. But, both those studies included high-risk patients and had small sample size. Bennani-Baiti et al. announced that although hormonal activity in tissue of women harboring predispositions may yield to progression towards BC over time, it is not true for normal population (2).
A small sample size, the potential selection bias because of the different MRI indications, and visual qualitative assessment of BPE causing a subjective interpretation of MRI findings limit the study psychometrics.
4.1. Conclusions
In conclusion, the data of this study do not support the correlation of BPE and breast cancer and do not suggest the use of BPE for BC risk estimation. BPE is a measure of breast tissue hormonal activity, and it is not correlated with age or histopathological diagnosis of breast lesions in either pre-menopausal or post-menopausal women.
