1. Background
One of the rare primary neoplasms of the central nervous system is gliosarcoma (GS), a subtype of glioblastoma (GBM) (1). GS was first reported by Strobe in 1895. It has a biphasic pattern consisting of glial (anaplastic astrocytes) and malignant mesenchymal elements. However, the monoclonal or biclonal origin of GS biphasic nature is still subject to debate (2). The onset of GS, as a rare neoplasm, is between the fourth and sixth decade of life (3), and the male/female ratio of GS is 1.8/1 (4). Treatment consists of surgical resection of the tumor followed by external radiotherapy or chemotherapy in some cases (4, 5). Authors represented different genes involved in the disease as p53 mutant expression (6, 7). Glial fibrillary acidic protein also reported as an diagnostic protein embedded in glioblastoma cells (8, 9). Scientists assessed the genetic profile of GS with mutation in P53, PTEN, and deletion of P16 with CDK4 amplification (10). Douglas et al. from Stanford compared systematic genes variations in 60 different cancer cell lines. Their article published in Genetics Nature represented common genes involved in gliosarcoma and other cancer cells (11). On the other hand, the mesenchymal component of GSs can present differentiation along several lineages as fibroblasts and chondroblasts, etc. (12). Investigation indicates that EGFR amplification is much lower in GS than GMB (13). Identifying the genes and proteins involved in the development of GS or the other types of cancer can effectively determine their treatment (14). From the perspective of systems biology, the connection between proteins involved in the disease is important (15). PPI network analysis of diseases has attracted attention of medical and biological scientist. In this approach, examination of the interaction between genes involved in the disease could lead us to improve the diagnosis and treatment of patients (16-20). In PPI network analysis, the related genes to the disease are gathered and organized in an integrative structure as a interactome (16, 21). The assessment of topological properties of the network, including central parameters such as degree and betweenness centrality provides useful information about molecular mechanism of disease onset and pathology (22-24). Introducing selected genes among large number of query genes can lead to specific biomarker panel related to the disease (25). In this study, we aim at identifying and analyzing genes interaction involved in GS disease. It may be conducted to introduce a biomarker panel related to GS.
2. Methods
A number of 200 genes related to gliosurcoma were searched from diseas query of String data bank (String is one of Cytoscape applications), but only 106 genes were introduced. The genes were analyzed for network construction by Cytoscape software version 3.6.0 (26). The main connected component of PPI network includes 78 nodes and 269 undircted edges were layout by degree values. The top 20% of the nodes based on degree values were selected as hub genes. The bottleneck nodes were identified considering top 20% of the nodes based on betweenness centerality. Similarly, top 20% of the nodes based on closeness centerality and stress values were selected as centeral genes. The hub nodes, which are bottleneck node, are introuced as hub - bottlenck genes. The nodes that were hub - bottleneck genes and their closeness and stress ranks were less than 10 and selected as crucial nodes. The mian connected component (the constructed network) was analyzed by Cluster ONE plugin of Cytoscape software (27). The significant clusters were introduced and discussed. Finaly, the main identified clusters were analyzed by ClueGO (28). The gene onthology finding were assested and categorized in the related groups.
3. Results
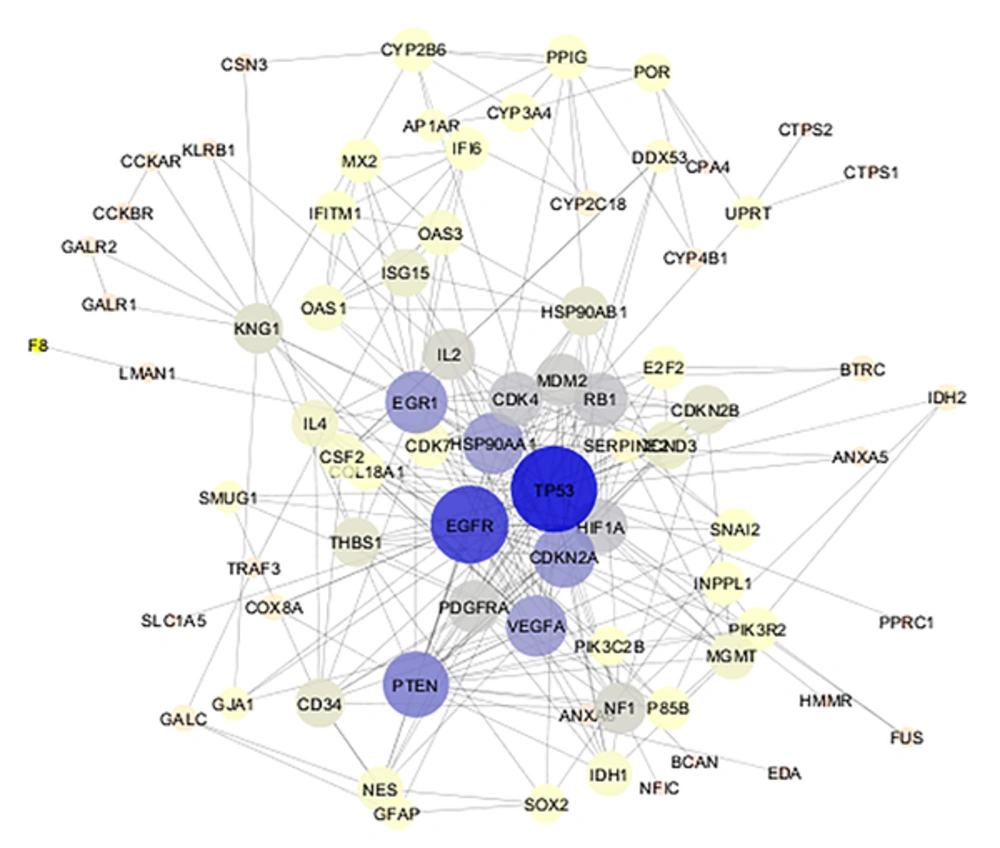
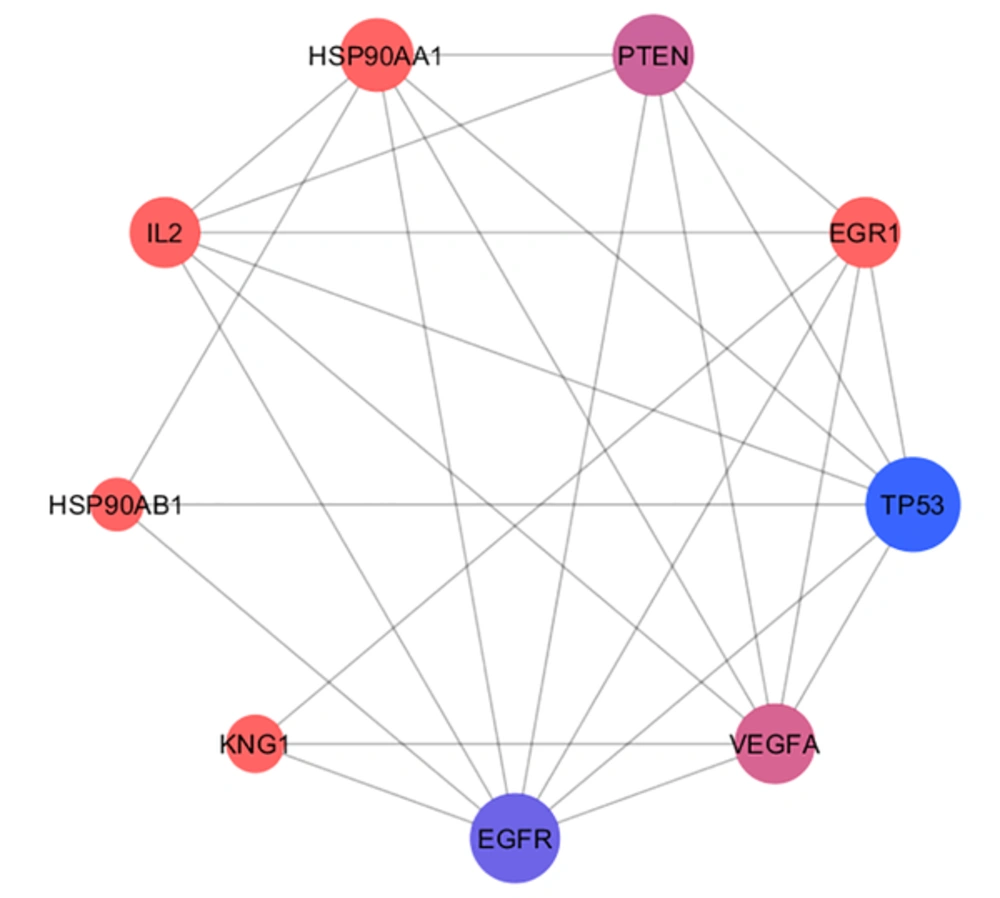
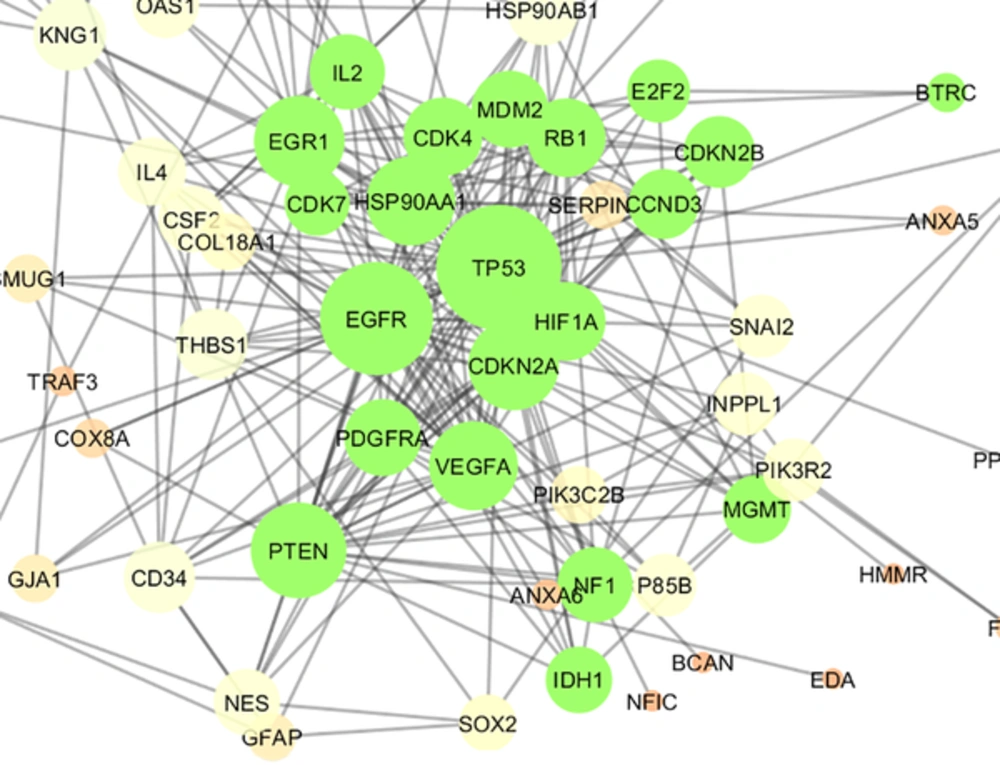
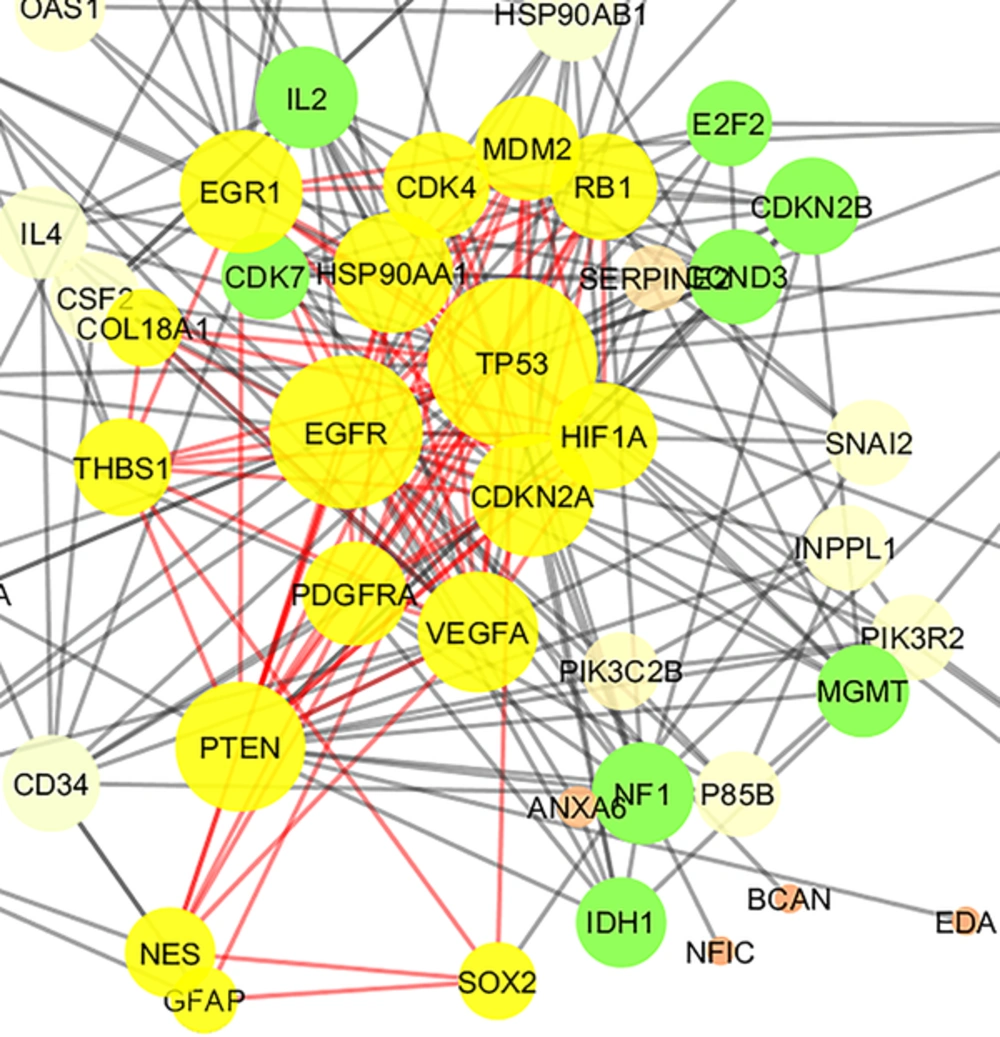
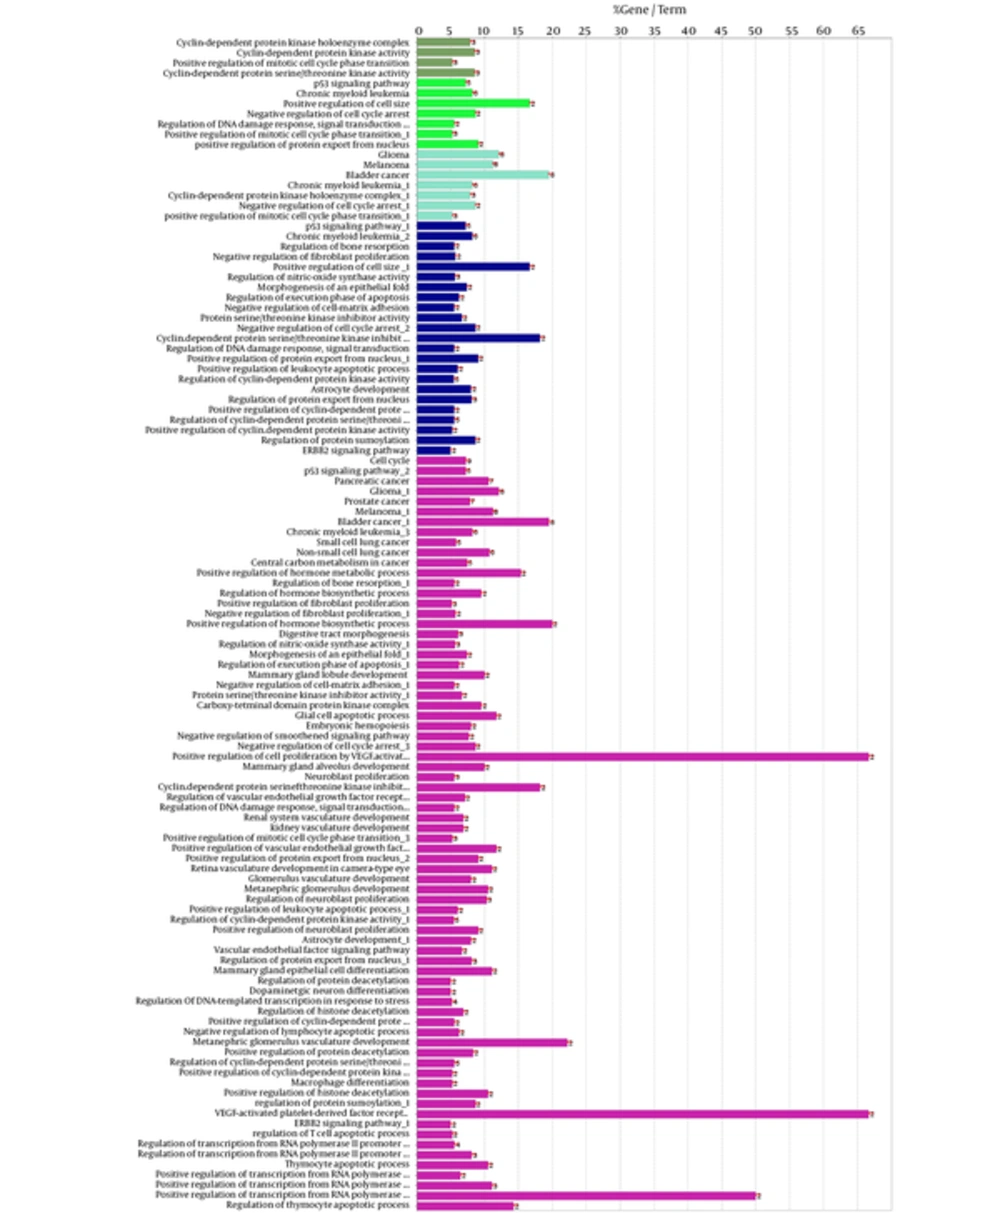
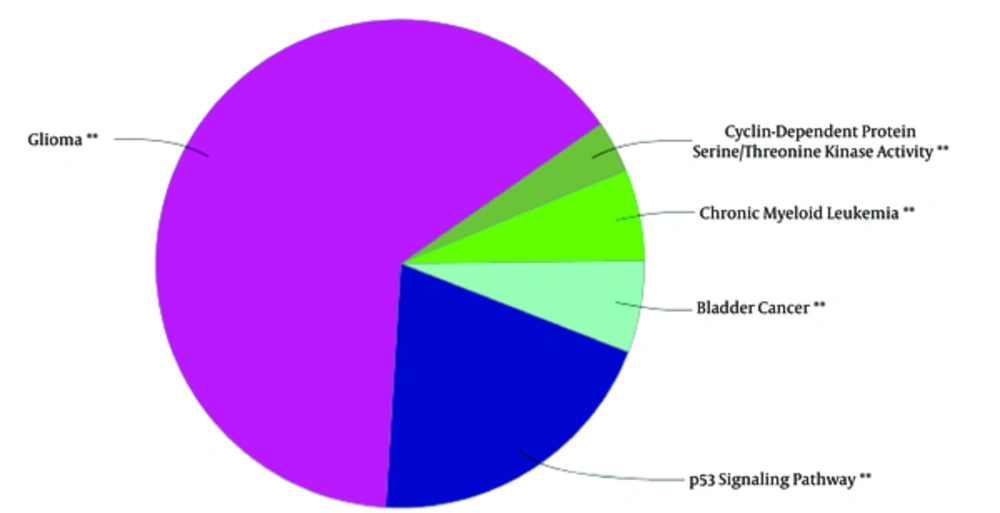
The 106 related genes of gliosarcoma for human species were retrieved from disease query of String database (confides 0.40 score). The genes were organized in a PPI network, including a main connected component (a network constructed with 78 nodes and 296 undirected edges) and 28 isolated nodes. The network is presented in Figure 1. The network was analyzed and for more resolution, the 20% of top nodes (equal to 16 nodes) based on degree values were selected as hub - genes. Similarly, 16 top nodes based on betweenness values were identified as bottleneck - genes. Two separated groups (each of them includes 16 top genes, corresponding to the values of closeness centrality and stress) were determined as central nodes. Therefore, 64 nodes were organized in 4 groups. If an individual node was not hub or bottleneck genes and was not found in the one of the other two groups, it would be omitted from study. Finally, 9 crucial genes of the analyzed network were identified and presented in Table 1. Connections between the crucial genes were illustrated in Figure 2 as a sub network. This sub network was resulted via the deletion of the other elements of gliosarcoma network. Since members of a cluster (cluster plays a role as an integrative part of a network) are involved in closed functional terms, cluster analysis of the network limited to the presence of at least 10 nodes in a cluster was performed. The cluster analysis revealed that there are 2 clusters (cluster 1 and 2) characterized by different quality and P value related to the constructed network. These clusters in interaction with the other parts of the network are presented in the Figures 3 and 4. Since cluster - 1 contains more crucial genes, this cluster was analyzed via gene ontology method. Gene ontology for the nodes of cluster - 1 indicates that 115 biological terms including biological processes, cellular components, molecular function, and biochemical pathways (from KEGG data base) are related to this cluster (Figure 5). The term was included if at least 2 genes and 5% gene/term contribution were considered. The analysis of a large number of the terms (115 terms) is a difficult process; therefore, as it is shown in Figure 6, the terms are organized in 5 groups.
| R | Name | Description | D | BC | CC | S | DS |
|---|---|---|---|---|---|---|---|
| 1 | TP53 | Tumor protein p53 | 42 | 0.31 | 0.63 | 4896 | 2.58 |
| 2 | EGFR | Epidermal growth factor receptor | 35 | 0.26 | 0.61 | 4104 | 1.51 |
| 3 | PTEN | Phosphatase and tensin homolog | 25 | 0.07 | 0.53 | 1448 | 1.12 |
| 4 | EGR1 | Early growth response 1 | 22 | 0.10 | 0.54 | 2044 | 0.56 |
| 5 | VEGFA | Vascular endothelial growth factor A | 21 | 0.03 | 0.53 | 884 | 0.61 |
| 6 | HSP90AA1 | Heat shock protein 90kDa alpha (cytosolic), class A member 1 | 21 | 0.13 | 0.55 | 3054 | 0.63 |
| 7 | IL2 | Interleukin 2 | 13 | 0.02 | 0.48 | 566 | 1.33 |
| 8 | KNG1 | Kininogen 1 | 12 | 0.12 | 0.48 | 2036 | 0.55 |
| 9 | HSP90AB1 | Heat shock protein 90kDa alpha (cytosolic), class B member 1 | 11 | 0.3 | 0.49 | 566 | 1.46 |
Cluster - 1 is constructed of 21 nodes (shown in green color) including 7 top genes of Table 1. The nodes are layout by degree value. P value, Quality, and Density were equal to 10- 4, 0.571, and 0.543 respectively.
Cluster - 2 is constructed of 17 nodes (shown in yellow color) including 6 top genes of Table 1. The nodes are layout by degree value. P value, Quality, and Density were equal to 0.034, 0.387, and 0.603, respectively.
4. Discussion
Gliosarcoma is a disease, which is studied by several molecular approaches such as genetics molecular biology and metabolite analysis (10, 29, 30). Therefore, there are a number of genes that are related to this disease. It is an essential need to rank and screen the genes for introducing the important elements among them. PPI network analysis is the right approach in this regard. The constructed network in this study contains 78 nodes and 296 edges. It seems that compared to other diseases PPI network, this network is a small network. Topology analysis of the network based on central parameters revealed that there are 9 crucial genes related to GS. Here, we tried to represent an overview of the significant roles of identified crucial genes of network in GC pathogenesis and development.
As it is known, TP53 is the most famous gene related to cancers. Rarely, it is discussed about the cancer without TP53 participation. TP53 mutations accompanied with the other genes such as CDKN2A is reported in GS and it is discussed in details (31). In the another report, the role of TP53 mutation beside CD34 in the GS patients was studied and its significant role in the disease was emphasized (32). In addition, the amplification of EGFR in correlation with PTEN in the glioblastoma and GS patients were studied and confirmed (33). Phosphatidyl - inositol - 3’ - kinase (Pi3k) - dependent activation of protein kinase B (Akt) signaling is the inhibitory role of PTEN as a tumor suppressor gene (34). Investigation indicates that EGFR over expression, occurrence mutations in PTEN, and P16 deletions accompanied with MDM2 amplification are the typical events in this disease (35). EGR1 is responsible for synaptic plasticity and neuronal activity in both physiological and pathological conditions (36). A study indicates that increment of VEGF - A and TGFβ2 signaling invokes gene expression changes related to glioblastoma vessels (37).
The significant role of HSP90AA1 and HSP90AB1 in several cancer types such as lung cancer, ovarian cancer, and GS is detected and discussed (38-40). The attenuation role of IL2 in growth of glioma and brain edema in rats is assessed and discussed in details (41). Down regulation of KNG1 in bladder and gastric cancers is studied and confirmed (42, 43). As it was shown, there is an exact relationship between expression changes of the nine introduced key genes and cancer diseases especially GS.
Consequently, the represented crucial genes probably are right related genes to GS.
A cluster is a combination of elements with tight relationships. In this study, a cluster was introduced containing the most number of the important genes, which is a novel finding. The cluster analysis identified 2 significant clusters. Cluster - 1 includes 21 nodes, in which 7 were common with the key genes. Similarly, cluster - 2 includes 17 nodes and 6 common key genes. The finding indicates that cluster-1 and cluster - 2 are 78% and 67% common considering key genes, respectively. Based on the findings, it can be concluded that cluster - 1 is a main structural component of the network. Thus, gene ontology enrichment of elements of cluster - 1 can lead to introduce the related terms of GS. A number of 115 terms were recognized, in which several terms are characterized by high percentage of attribution such as the VEGF involved terms. On the other hand, there are several terms, which are specified by the presence of more genes in the terms such as glioma, melanoma, cell cycle, and bladder cancers. Since the interpretation of a large number of the terms is difficult, the terms were categorized in 5 groups. The main group is determined as glioma, which indicates that our analysis was conducted in an appropriate way. The second important group is p53 signaling pathway. There is evidence about correlation between p53 pathway and glioma (44). The other groups were involved in different malignancies.
4.1. Conclusion
The 9 determined key genes may be the central core of GS and play major roles in pathology of disease. The validation of findings via experimental investigation is useful for the approval, tool.
