


1. Background
Breast cancer is the most common cancer in women all over the world. In Iran, breast cancer is a prevalent disease and its rate of incidence is 33 patients per 100000 (1, 2). From histopathological side, breast cancer is divided in two groups: In situ carcinoma and invasive carcinoma (spread to the lymph nodes) (3). Surgery, radiotherapy, and chemotherapy are routine methods used for the treatment of breast cancer (4). Breast conserving surgery followed by radiotherapy has an important and effective role for the treatment of breast cancer (5). Changing in shape and size of breast affect radiotherapy planning. The main aim of radiation therapy and treatment planning is to deliver maximum dose to the planning target volume (PTV) and minimum possible dose to normal tissues. To spare organs at risks (OARs) such as heart and lung, to avoid long-term complications, and to select optimal technique in treatment planning of breast cancer are highly important as well (4, 6).
Nowadays, developments in treatment planning systems (TPS) software and modern techniques cause to achieve exact dosimetric results and good outcome for the patients (7). For the treatment of breast cancer, external irradiation three-dimensional conformal radiation therapy (3D-CRT) and field in field intensity modulated radiation therapy (FIF-IMRT) are two common radiotherapy techniques. Physical, dynamic, and virtual wedges and compensators are routinely used in conformal technique. On the other hand, in FIF technique several less-weighted subfields are used without using any modifiers to optimize dose distribution on the target volume. Most studies show that the FIF technique lead to more better results in breast cancer patients compared to conformal technique (5, 8, 9). With using this technique, incident intensity is modified and adapted with PTV.
2. Objectives
The purpose of this study is to compare dosimetric parameters of FIF and conformal treatment planning techniques in the early stage of the left breast cancer patients. We also evaluated the importance of the breast volume on dosimetric parameters of each techniques.
3. Methods
The present study was conducted following the approval by Ethical Committee of Semnan University of Medical Sciences (Iran, approval number: IR.SEMUMS.REC.1396.197).
3.1. Patient Selection
Twenty-four female patients with left breast cancer in early-stage (T1 or T2) undergoing breast conserving surgery were investigated. In these stages, tumor size is less than 5 cm and with no lymph node metastasis. The entire 24 patients were divided according to the breast volume in 3 groups: ≤ 1500 cc small, 1500 - 2000 cc medium, and > 2000 cc large. There was no age limitation for patients and the number of patients was selected according to the literature (9-11). This study was performed on a Siemens Artiste Linear Accelerator machine for the 6 MV X-ray beam, which is equipped with Multi Leaf Collimator (MLC), at the Reza Radiation Therapy and Oncology Center, Mashhad, Iran during 2018.
3.2. Simulation
All patients underwent computed tomography (CT) simulation (Siemens Somatom Definition Flash, Germany). At the time of CT scanning, the patient was placed supine with both arms raised above the head, using the elbow support. CT data were acquired with adjacent axial slice spacing 5 mm, covering the entire chest with normal free breathing. CT datasets were transferred to Prowess TPS (1844 Clyton Road Concord. CA 94520, version 5.5), using cone convolution collapsed (superposition (CCCS) algorithm) (12).
3.3. Contouring and Dosage Prescriptions
The radiation oncologist contoured clinical tumor volume (CTV), PTV, and organ at risks like contralateral breast, lungs, and heart on CT images.
Dose limitation for the organ at risks are defined as:
D30% is for the left lung (equivalent V20%) that is defined as doses received by 30% left lung and it must be less than 20Gy to avoid pneumonitis.
And, for the heart is D46% (equivalent V30%). It is defined as doses received by 46% heart and it must be less than 30Gy to avoid pericarditis (13, 14).
The prescribe doses was 50Gy in 25 fractions. All these are according to guidelines on International Commission of Radiation Units and Measurement (ICRU), report 50 and 62 (8, 9).
3.4. Comparison of Plans
The plans was normalized to the isodose line to give a minimum of 50 Gy to 95% of the PTV. Reference point (isocenter) was selected at the middle of the thickest part of the breast in central axis of each tangent fields. The doses were normalized to this reference point. In each technique, the first two opposed tangential fields (lateral and medial) were generated. The weight of each field was selected based on to deliver homogenies dose on the target volume. The angles of these fields must cover all the PTV volume with 95% to 107% isodose curves and avoid the extra doses to the contralateral breast and lung.
In this study, virtual wedges were used in the conformal technique. According to the anatomy of each breast and for achieving the best homogenies dose distributions in planning target volume, the wedge angles of 25° or 30° were used.
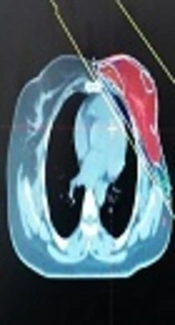
In the Figure 1, we showed one sample of conformal technique by using virtual wedges in 3 transvers, sagittal, and frontal views.

A, transvers; B, frontal and; C, sagittal images of field in field treatment planning
On the other hand, we used two subfields for achieving the most appropriate homogeneity in FIF technique and in all 3 groups. First, the subfields were added to the medial field. The number and weight of each subfield vary according to homogeneity dose distribution on the target volume and until the high-dose cloud disappeared. This process was performed on the lateral field, too. In this study, for all groups, we used just two subfields. By the evaluation of the dose-volume histograms and 3-dimensional dose distribution, the optimized FIF plans were determined. One sample of this treatment planning was presented in 3 transvers, sagittal, and frontal views in Figure 2. Finally, in each technique, through different beam’s eye view (BEV) projection, the region with high dose was shielded with multi leaf collimators.

A, transvers; B, frontal and; C, sagittal images of conformal treatment planning
3.5. Dosimetric Evaluations
Plans in two techniques, FIF, and conformal were generated and compared in each 3 groups, in terms of maximum, minimum, and mean dose in PTV, percentage of volume receiving greater than 107% (hot spots), and less than 95% prescription dose (cold spots), total monitor unit, homogeneity (HI), and conformity (CI) indices. Homogeneity shows the uniform dose distribution on the PTV volume and it is defined:
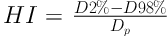
Where, D2% and D98% are the doses received by 2% and 98% of the PTV, respectively. Dp is the prescribed dose. Conformity index is defined as well:
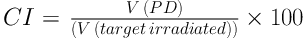
Where, V (PD) is the volume receive 95% prescribe dose (8, 15). Statistical analysis was performed by SPSS version 20. The Kolmogorov-Smirnov normality test was assessed on the data. After verification of the data with normality test, two independent samples student’s t-test was used to compare the mean values of the parameters between the two techniques in each group. P < 0.05 was considered to be statistically significant.
4. Results
Dosimetric parameters of each patients in 3 groups of breast volume are given in Tables 1-3, respectively. As indicated in Table 1, in small breast volume group, the FIF technique significantly reduced Dmax (maximum dose) in PTV and hot regions (P < 0.05). Conformity index was better in conformal compared to FIF technique (P < 0.05). Cold spots were significantly reduced in conformal as well (P < 0.05). Doses received by heart (D46%) and left lung (D30%), total monitor unit (MU), and HI did not show significant difference in two techniques (P > 0.05).
As presented in Table 2, in FIF technique, Dmax and Dmean (mean dose) were significantly reduced in PTV. In all groups, hot spots also significantly decrease in this method (P < 0.05), although conformity index and cold spot were reported significantly better in conformal technique (P < 0.05). MU, HI, and doses received by heart and left lung did not represent different significantly in each two techniques (P > 0.05).
| Treatment Plan (Small Breast Volume) | FIF | Conformal | P Value, Student’s t-Test |
|---|---|---|---|
| Dmax, cGy | 5421.5 ± 152.43 | 5628.0 ± 253.39 | 0.028b |
| Dmean, cGy | 5016.25 ± 188.54 | 5204.37 ± 200.40 | 0.188 |
| Dmin, cGy | 3618.12 ± 795.58 | 3633.25 ± 746.35 | 0.969 |
| HI (0 - 1) | 0.11 ± 0.015 | 0.12 ± 0.019 | 0.083 |
| CI, % | 96.77 ± 1.83 | 99.17 ± 0.67 | 0.004b |
| MU | 236.95 ± 7.07 | 242.5 ± 11.92 | 0.255 |
| Hot spot, % | 1.5 ± 0.46 | 13.63 ± 10.29 | 0.002b |
| Cold spot, % | 3.22 ± 0.65 | 0.82 ± 0.23 | 0.001b |
| D46%, cGy (Heart) | 136.62 ± 46.69 | 146.0 ± 48.01 | 0.698 |
| D30%, cGy ( Left Lung) | 329.6 ± 103.76 | 334.75 ± 112.21 | 0.926 |
Dosimetric Comparison of Parameters Between FIF and Conformal Techniques in Small Breast Volumea
| Treatment Plan (Medium Breast Volume) | FIF | Conformal | P Value, Student’s t-Test |
|---|---|---|---|
| Dmax, cGy | 5488.25 ± 69.66 | 5711.87 ± 110.9 | 0.000b |
| Dmean, cGy | 5064.5 ± 42.12 | 5162.0 ± 63.34 | 0.003b |
| Dmin, cGy | 3356.25 ± 879.08 | 3377.0 ± 737.51 | 0.960 |
| HI (0-1) | 0.11 ± 0.021 | 0.13 ± 0.019 | 0.225 |
| CI, % | 98.27 ± 1.3 | 99.33 ± 0.44 | 0.050b |
| MU | 237.88 ± 13.79 | 257.32 ± 27.30 | 0.095 |
| Hot spot, % | 3.5 ± 1.01 | 16.22 ± 3.5 | 0.004b |
| Cold spot, % | 1.8 ± 0.53 | 0.66 ± 0.15 | 0.028b |
| D46%, cGy (Heart) | 158.5 ± 45.46 | 167.87 ± 48.83 | 0.697 |
| D30%, cGy ( Left Lung) | 600.14 ± 190.6 | 572.5 ± 181.10 | 0.825 |
Dosimetric Comparison of Parameters Between FIF and Conformal Techniques in Medium Breast Volumea
As shown in Table 3, in large breast volume, FIF significantly reduce maximum, mean, and minimum dose in PTV (P < 0.05). This technique also decrease hot spots (P < 0.05). On the other hand, conformal has better results in conformity index and significantly decreases cold spots (P < 0.05). HI, MU, and doses received by OAR did not show significant difference in two techniques (P > 0.05).
| Treatment Plan (Large Breast Volume) | FIF | Conformal | P Value, Student’s t-Test |
|---|---|---|---|
| Dmax, cGy | 5598.0 ± 111.70 | 5847.0 ± 81.76 | 0.000b |
| Dmean, cGy | 5072.5 ± 53.72 | 5194.87 ± 81.76 | 0.003b |
| Dmin, cGy | 4120.87 ± 267 | 4511.37 ± 146.67 | 0.019b |
| HI (0-1) | 0.13 ± 0.027 | 0.14 ± 0.027 | 0.219 |
| CI, % | 98.12 ± 1.08 | 99.17 ± 0.65 | 0.034b |
| MU | 235.78 ± 8.7 | 243.78 ± 15.52 | 0.225 |
| Hot spot, % | 7.6 ± 2 | 20 ± 4.2 | 0.021b |
| Cold spot, % | 2.3 ± 0.64 | 0.43 ± 0.25 | 0.038b |
| D46%, cGy (Heart) | 145.75 ± 32.09 | 155.62 ± 34.98 | 0.566 |
| D30%, cGy (Left Lung) | 637 ± 438.92 | 685.87 ± 480.29 | 0.835 |
Dosimetric Comparison of Parameters Between FIF and Conformal Techniques in Large Breast Volumea
5. Discussion
More than one-third of time of treatment planning in radiotherapy departments is allocated for the breast cancer treatment planning (16). Therefore, selecting optimal technique for achieving good outcomes is so important. Investigations have reported that compared to conformal technique, the FIF technique gives more homogenous dose distributions in PTV volume (5, 17, 18). Yavas et al. (11) indicated that the FIF technique significantly reduced the maximum dose of the PTV and also provided better dose distribution. Sasaoka and Futami (18) reported that FIF technique significantly reduced hot spots and has better dose distribution in PTV. These results are in common with the results we obtained in our study. Emami’s study (13) on the tolerance of normal tissue to therapeutic radiation reported that one of the most common toxicities in radiation therapy of breast cancer patients is pneumonitis. In addition, breast radiotherapy, especially in left breast irradiation, could result in symptom of pericarditis and death from a myocardia infarctus. Therefore, reduction in radiation doses of OARs in breast cancer treatment planning is so fatal.
The present study reported that the FIF technique significantly reduced maximum dose of PTV and hot spots in all 3 groups (Figure 3). As volume of the breast increases maximum, hot spots and doses received by left lung will also increase. On the other hand, conformal technique significantly reduced cold spots and reported better conformity index in all 3 groups (Figure 4). The FIF technique decreased doses of OARs, monitor unit, and better homogeneity in all 3 groups, but with no statistical significance compared to conformal technique (Figure 5). In both techniques, D46% and D30% were less than 3000cGy and 2000cGy, respectively. Therefore, both techniques decreased probability of pneumonitis and pericarditis for the left lung and heart, respectively. Dose-volume histograms of each technique has been shown in Figure 6. By the way, the number of subfields in FIF technique were two subfields in all breast volumes. On the other hand, in conformal technique, we used angles wedge of 25° or 30° in all 3 groups. It seems that volume of the breast does not affect the number of subfield in FIF and wedge angles in conformal techniques.

A, mean and standard deviation of maximum doses; and B, hot spots in target volume in each group and between two techniques.

A, mean and standard deviation of conformity; and B, cold spots indexes in each group and between two techniques.
; B, D46% for the heart (doses received by 46% heart); C, monitor unit; and D, homogeneity index in each group and between two techniques")
A, mean and standard deviation of D30% for the lung (doses received by 30% left lung); B, D46% for the heart (doses received by 46% heart); C, monitor unit; and D, homogeneity index in each group and between two techniques
 for the conformal technique (dashed line) and the field in field technique (solid line) presented in Pink lines: PTV; green lines: Left lung; B, blue lines: Heart")
B, comparison of dose volume histograms (DVHs) for the conformal technique (dashed line) and the field in field technique (solid line) presented in Pink lines: PTV; green lines: Left lung; B, blue lines: Heart
5.1. Conclusions
According to the results were achieved in the present study, conformal technique had good functions in conformity index and in reduction of cold spots in all breast volumes. FIF technique presented better results in reduction of hot spots in all groups. Therefore, it is recommend that two techniques can be combined and used together to cover their weak points in all breast volumes. It means that after generation of two main parallel opposed fields, we can use virtual wedge to cover the entire PTV and for achieving the best homogeneity dose distribution, we can use subfields. In this study, there was no difference in monitor unit, homogeneity index, and doses received by OARs in both techniques and in all 3 groups. Contrary to the results of this study, according to most studies, FIF presented better results than conformal technique in all parameters and for the treatment planning of most part of the body. Therefore, the last point is that if there is no equipment of IMRT such as FIF technique in some centers, conformal technique by using virtual wedge has similar results and as good outcomes as FIF and, therefore, it can be a proper alternative.
