
1. Background
The human Testis-specific protein on Y chromosome (TSPY) is a multi-copy gene, and its genetic interactions have been clinically correlated with gonadoblastoma (1). The TSPY gene has been initially identified as a Y-linked gene specifically expressed in the testis and it is tandem repeated in 20.3 kb highly homologous units, usually in the range of 21 to 35 copies, on the short arm of the Y chromosome (2, 3). TSPY is a member of SE (Su [var]3-9, Enhancer of zeste) translocation (Su [var]3-9, Enhancer of zeste and Trithorax) (SET)/NAP1 superfamily harboring a highly homologous SET/NAP‑domain, originally recognized in the SET oncoprotein and the NAP1 (4).
The human TSPY is revealed in gonocytes in the immature testis (5), spermatogonia, and prophase I spermatocytes at preleptotene to zygotene stages in adult testis (6). Indeed, TSPY expression has been observed in gonadoblastoma, and numerous distinct kinds of germ cell tumors (GCT), such as carcinoma in situ/intratubular germ cell neoplasia unknown (CIS/ITGCNU) (the precursor for all Testicular GCTs [TGCTs]), seminoma, and extragonadal intracranial GCT. TSPY protein is a significant marker that executes a function in the pathogenesis of TGCTs. It was also approved that 27 genes have been mapped on the human Y chromosome that encodes proteins or non-coding RNAs (ribonucleic acid) (2). TSPY appears conserved among animals (7, 8). Nevertheless, identification of its physiological influence has been difficult because standard homologous recombination is embarrassed by various repeated sequences and multi-copy genes on the Y chromosome. Though, the TSPY gene is identified to be linked with the locus for gonadoblastoma (9, 10).
It is mentioned that the venture of testis cancer was increased by the possession of several characteristics linked with exposure of the testis to heat like getting exposed to fertilizers, phenols, and fumes or smoke and trauma to the testis (11).
Unlike most other tumors, testicular cancer is the most usual malice in men aged 15 to 34 years; it is estimated 1% of all cancers in people. While in the last decade, testicular cancer has significantly progressed (12). Its occurrence is much higher (4 times more) than in black people (12, 13). However, the preponderance of testicular cancers is healable even at forward steps (12).
The majority of the available anticancer drugs (more than 3000 drugs) are obtained from natural sources (plants) (14-16). Out of 121 medicines that are being used today for cancer therapy, 90 of them are of plant origin and approximately 75% are identified from traditions claims (17). Natural outputs have been the only most fertile source of leads for the expansion of medicines (18). Some of the medicinal plants that are widely used as a source of anticancer drugs in Iran include seed of Carum carvi L. (general anticancer), leaves and flowers of Brassica oleracea L. (uterus and skin cancer treatment), fruit cooked and lotion of Cucurbita maxima Duchesne (internal organs cancer treatment), powder and decoction of aerial parts Cuscuta epithymum L. and fruit and fruit peel juice of Punica granatum L. (ulcerating tumor treatment), gum of Acacianilotica (L.) Delile (eye cancer treatment), cooked fruit of Ficus carica L. (general anticancer), and dust powder of wood of Salixaegyptiaca L. (skin cancer treatment) (19).
Plant-derived terpenoid components are identified to defeat nuclear factor-κB (NF-κB) signaling, the important regulator in the pathogenesis of passionate infections and tumors (20). Interestingly, useful components in some plant-derived curative essences are also terpenoid composites of monoterpenoid, sesquiterpenoid, diterpenoid, triterpenoid, and carotenoid groups (20). Terpenoids are natural inhibitors with anti-inflammatory and anticancer potential having some materials, such as α-pinene (20). Also, the α-pinene is a natural compound that was isolated from different plants such as pine needle (21), Schinus terebinthifolius Raddi (Anacardiaceae) (15), which have shown anticancer activity and anti-metastatic protection.
The last few decades have witnessed significant development in the utility of curative crops as a source of clinically useful anticancer agents with fewer side effects (22-24). However, the systematic studies on their mode of action and molecular docking analysis of anticancer drugs are scarce and need to be fully explored.
2. Objectives
The present study was undertaken for in silico molecular docking analysis of α-pinene as an anticancer drug against a TSPY.
3. Methods
3.1. TSPY Gene and Sequences Analysis
TSPY gene family used in the present study was obtained from the National Center for Biotechnology Information (NCBI) (Table 1). After receiving all sequences, repeat sequences were removed and eventually confirmation of the presence conserve domain of the TSPY gene family in the deoxyribonucleic acid (DNA) and protein sequences were identified, using the conserved domain database (CDD) database (25).
Table 1.
Properties of the TSPY Gene Sequence Used in the Present Study
| Accession Number | Properties |
|---|---|
| NM001197242.2 | Human TSPY1 transcript variant 2 mRNA |
| NM001320962.1 | Human TSPY10 transcript variant 2 mRNA |
| U58096.1 | Human TSPY mRNA complete cds |
| NM_003308.4 | Human TSPY1 transcript variant 1 mRNA |
| NM_001282469.2 | Human TSPY10 transcript variant 1 mRNA |
| NM001243721.1 | Human TSPY8 mRNA |
| NM001164471.1 | Human TSPY4 mRNA |
| AY130858.1 | Human TSPY encoded protein mRNA complete cds alternatively spliced |
| BC121114.1 | Human TSPY3 mRNA complete cds |
| BC075016.2 | Human TSPY3 mRNA complete cds |
| BC148425.1 | Synthetic construct Human TSPY2 mRNA encodes a complete protein |
| AB464293.1 | Synthetic construct DNA Human TSPY2 gene without stop codon in Flexi system |
| NM001320964.1 | Human TSPY1 transcript variant 3 mRNA |
| BC121113.1 | Homo sapiens similar to TSPY2 mRNA complete cds |
| M98524.1 | Human TSPY gene exons 1 through 6 |
| AF106331.1 | Human TSPYq1 gene complete cds |
| NG009742.2 | Human TSPY7 pseudogene (TSPY7P) |
| X74029.1 | Human TSPY gene |
| M94893.1 | Human TSPY mRNA 3 end clone pJA923 |
| NG009702.2 | Human TSPY6P |
| NG021936.1 | Human TSPY9P |
| NG003077.4 | Human TSPY11P |
| M94892.1 | Human TSPY/CYS14 gene complete cds clone pJA36B2 |
| NG016162.2 | Human TSPY15P |
| NG003079.4 | Human TSPY13P |
| NG003093.4 | Human TSPY5P |
| NG003078.4 | Human TSPY12P |
The molecular weight and theoretical isoelectric pH of the TSPY proteins were calculated, using the ExPASSY ProtParam tool (26). The cellular status of proteins was identified by using the protParam program (27).
Codon sites included were 1st + 2nd + 3rd + Noncoding. All sites including gaps and missing data were discarded. The analysis of the whole of base replacements per position between sequences was conducted, using the maximum composite likelihood model (28).
Clustering analysis was carried out by using mega 6 software (29), a consensus sequence was created by BioEdit (30), restriction enzymes on the TSPY DNA sequence were located with the help of NEB cutter V2.0 (31), and TSPY DNA sequences were assembled by using CAP3 sequence assembly program (32). Besides nucleotide diversity of all sequences, the number of diverse positions, and Tajima’s and Watterson’s estimators of theta were measured. Tajima’s D was also used to resolve if the TSPY genes in these taxa resulted in neutrally. Tajima's Neutrality Test (33) was conducted and the evolutionary analyses were analyzed in MEGA6 (29). Tajima's D, Fu and Li's D*, F*, D (named DF), and F statistics were used for producing the information from only intraspecific data, whereas Fu and Li's DF and F statistics utilize information from the number of recent variations; the latter, therefore, requires the presence of an out-group to be computed.
Nucleotide polymorphisms were measured by parameters, such as haplotypes (genes) diversity, nucleotide diversity, and the number of separating positions (34-36), and its standard deviation (SD) was evaluated by theta (θ). These parameters were estimated by Dnasp software version 6.10.01 (37).
The number of diverse positions, Tajima’s estimator of theta (π) (38) and Watterson’s estimator of theta (36) were calculated, using Mega 6 software (29). Where π is determined as the median number of nucleotide diversity between two sequences (38), theta quantifies the level of variability as the total number of diversity positions (36). Both estimators were separated by the arrangement length to get the comparable values per nucleotide.
3.2. Nucleotide Diversity (θ)
Nucleotide diversity (θ) was evaluated by the method reported by Halushka et al. (39).
Wherever K is the number of SNPs distinguished in an alignment length, n is alleles and L is the total length of the sequence (bp).
3.3. Identification of Haplotypes
Classifying haplotypes for examining the genetic diversity of populations was taken, using the Chi-square experiment. This was based on allele frequencies in samples from various positions (40). Polymorphism and haplotype differentiation were analyzed, using Dnasp V6.10.01 (41). Sequences were further subjected to Tajima’s Neutrality test (33).
3.4. Molecular Docking Analysis
To know the structural basis of protein target specificity, a computational ligand-target docking procedure was used to investigate the structural groups of the TSPY (target) with α-pinene (ligand). Initially, the protein-ligand attraction was studied for hydrophobic/hydrophilic characteristics of these groups by platinum software web server. Finally, protein-protein interaction networks of TSPY protein by STRING v10 (42) were used to predict the 3D structure of TYPS SWISS-MODEL (43) and for docking protein-peptide based on the interaction similarity, Swiss Dock (44), Galaxy web (45), and CABS-dock (46) were used. The energy of the interaction of α-pinene with the TSPY is attached “grid point.” At each step of the simulation, the energy of interaction of ligand (α-pinene) and protein (TSPY) was estimated by applying atomic affinity potentials calculated on a grid by Galaxy web online software. The left parameters were anchored as default.
Beyond the use of experimental data, prediction accuracy can also be improved by integrating docking tools with other computational techniques, such as molecular dynamics-based approaches (47, 48), key interactions (49), and prediction of the binding site (50); molecular dynamics was done by FG-MD server (51).
3.5. Model Validation
The accuracy of a predicted model and its stereochemical properties was evaluated by PROCHECK-NMR (52, 53). The model was selected based on various factors such as the overall G-factor, the number of residues in core allowed, generously allowed, and disallowed regions in the Ramachandran plot. The model was further analyzed by WHATIF (52), qualitative model energy analysis (QMEAN) (54), and protein structure analysis (ProSA) (55). ProSA was used for the display of Z-score and energy plots. Template modeling score (TM-score) and root mean square deviation (RMSD) by TM-score online (56, 57) as well as RMSD and atoms by SuperPose version 1.0 (58) were used to predict protein structure and docking.
4. Results
4.1. Estimation of Evolutionary Divergence Between Sequences
After receiving all sequences, alignment was conducted; then, repeat sequences were removed and, finally, to confirm major counting of TSPY gene family, the presence of conserved domain of TSPY gene was surveyed and major open reading frame (ORF) was found in this counting and, then, was surveyed for the presence of conserved domain in the protein sequence. Following the confirmation of the presence of conserved domain, nucleotide compassion and frequencies of TSPY gene sequences and r comparative values of instantaneous r should be examined when estimating them. For simplicity, a sum of r values was 100 and the nucleotide frequencies obtained were A = 24.13%, T/U = 20.51%, C = 24.80%, and G = 30.55 %. For the calculation of maximum likelihood (ML) values, a tree topology was automatically calculated. The maximum log-likelihood for this computation was -3166.720. The numbers of nucleotide substitutions per position among sequences are presented in Table 2. More transitional substitution (15.79) was obtained between A and G and the less transitional substitutions (11.90) were found between C and T nucleotide. More transversions substitution (6.94) was obtained between T and G and C and G and fewer transversions substitution (4.66) was found between A and T and G and T nucleotide (Table 3). dN/dS index was 0.91.
Table 2.
Results of Tajima's Neutrality Test (33)
| Variables | Values |
|---|---|
| m | 27 |
| S | 385 |
| ps | 0.574627 |
| θ | 0.149083 |
| π | 0.213463 |
| D | 1.709580a |
| Haplotype/nucleotide diversity | |
| Number of haplotypes | 25 |
| Haplotype (gene) diversity | 0.994 |
| Medium number of nucleotide diversity | 143.01994 |
| Theta (per sequence) from eta | 114.15467 |
| Theta (per site) from eta | 0.17038 |
| Neutrality tests | |
| Fu and Li's D* test statistic | 0.43428 a |
| Fu and Li's F* test statistic | 0.733 a |
| Fu's Fs statistic | 0.504 |
| Strobeck's S statistic | 0.659 |
Abbreviations: m, number of sequences; n, total number of sites; S, number of segregating sites; ps, S/n; θ, ps/a1; π, nucleotide diversity (per site); and D is the Tajima test statistic ((59) for details)
aNon-significant.
Table 3.
Maximum Likelihood Estimate of Substitution Matrix a
a Every record is the possibility of the replacement (r) from individual nucleotide (row) to the different nucleotide (column). The replacement model and valuations were determined following the Tamura-Nei (1993) model (60).
b Valuations of various transitional replacements
c Valuations of transversional replacements
The investigation involved 27 nucleotide sequences. Codon sites included were 1st + 2nd + 3rd + noncoding. All sites including gaps and missing data were discarded. There were 670 sites in the final dataset. Based on the analysis of all sequences, 3819 identification sites were obtained. The total number of positions (excepting situations with gaps/missing data) was 670 (variable polymorphic sites were 385 and invariable monomorphic sites were 285; sites with alignment gaps or missing data were 3149; the number of haplotypes was 25 with a haplotype diversity index of 0.99 and Singleton number and counting were 56 and 6, respectively).
Levels of nucleotide difference overall loci were low (56 single-nucleotide diversity in < 4 kb of sequence) and substantially differed between any locus (Table 2). The rest of the traits like theta (per sequence) from eta, theta (per site) from eta, Fu's Fs statistic, and Strobeck's S statistic are shown in Table 2. Traits such as Tajima's D, Fu, and Li's D* test statistic and Fu and Li's F* test statistic were positive and none-significant.
TSPY gene analysis revealed the presence of two conservation sequences: Region_1 from 1101-1362 bp with the following sequence:
GRC YGT RCY KGG YSC YRG RSM BRY DRY BSC AGR RTY YVT GYV YBG CGW GGR KCK GSY RGC HCA GRY YYW GGT GGA GCT GGA GCC RGT TAA TGC CYR AGC YAR GAA GGC STT TTC TCR SCA GHG GGA AAA GMT GGA RNR GAG GYR CAA GYC SCR SCT RKR CYG SAS AGG GCG MCR TCA TYC AGR RCR TCC CTG GCT KCT GGG CCM ATG KTR WWW SCW WHY CAS YRY YYY WKM KGY CWK YCY WGW KSA SWG RYG MWS WYG RRR A
and Region 2 was from 1474-1558 bp with the following sequence:
RKW DTM MWG YRW KYV SCA RDG AAW MYC TKT SGT GAW GCC DAR CMK CAS ABR WTW YRS GGC WTC WYW TTS VAS WSC AGA AKY GAG T
ORF (section B) of the TSPY gene family sequence (E value: 0.00297)
4.2. In Silico Analysis
A consensus sequence was calculated in all TSPY gene sequences, using Bio-Edit sequence alignment editor 7 (30) software and, then, entered on the Neb-cutter site (http://tools.neb.com/NEBcutter2/) to identify specific restriction enzymes that can detect haplotypes. The results showed that numerous restriction enzymes could cut in the replicated region; a total of 5 types of restriction enzymes (PluTI, HaeII, XcmI, ApoI, and BmrI) that could cut and split in a proliferative region in different samples were observed (Table 4).
Table 4.
Restriction Enzymes with the Ability to Produce Polymorphic Bands in the TSPY sequences
| Enzyme Name | Number cut | The Size of Polymorphic Bands (nt) | Restriction Site |
|---|---|---|---|
| PluTI | 1 | 1272 | 5′…GGCGC▼C … 3′ |
| 2547 | 3′ … C▲CGCGG … 5′ | ||
| HaeII | 1 | 1272 | 5′ …RGCGC▼Y … 3′; |
| 2547 | 3′ … Y▲CGCGR … 5′ | ||
| XcmI | 1 | 1286 | 5′ … CCANNNNN▼NNNNTGG… 3′ |
| 2533 | 3′ …GGTNNNN▲NNNNNACC … 5′ | ||
| ApoI | 1 | 2836 | 5′ …R▼AATTY…3′; |
| 983 | 3′ …YTTAA▲R …5′ | ||
| BmrI | 1 | 3245 | 5′ …ACTGGG(N)5▼ … 3′ |
| 574 | 3′ … TGACCC(N)4▲ … 5′ |
4.3. Cluster Analysis
A neighbor-joining phylogenetic tree based on the simple matching distance clustered the 27 TSPY gene sequences into 3 major and separate groups, namely A (A1 and A2), B, and C (Figure 1). Based on the results of cluster analysis and Tajima's neutrality test, TSPY was found to be controlled using 3 group gene families with different alleles. W08050 (expressed in mouse), AA403245 (expressed in the fetus), and AA403239 (expressed in the fetus) TSPY genes are similar to the Q01534 gene. The present research also reported that W08050 and AA403245 are similar to Q01534 and stay on one group (subgroup A1), but AA403239 is a little different and stays on subgroup A2. Thus, these accession numbers are two alleles of one gene from TSPY. On the other hand, the placement of the expressed genes in mouse and fetus into one group was shown to have some of TSPY genes expressed at certain stages of growth that they are different from other genes from another stage of growth.
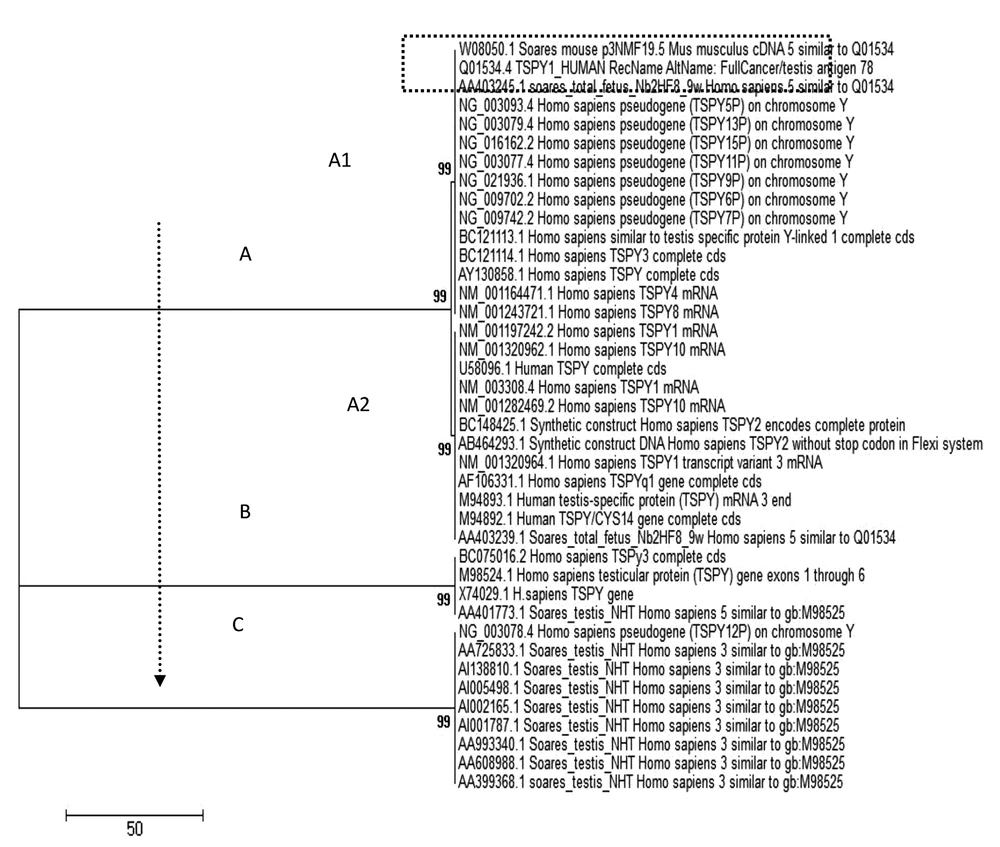
Figure 1.
Dendrogram comparison of TSPY genes sequences based on Clustal W methods using mega 6 software
According to NCBI data, AA725833, AI138810, AI005498, AI002165, AI001787, AA993340, AA608988, AA399368, and AA401773 accession number of TSPY gene are similar to M98524. However, in the present study, it was found that the only AA401773 is similar to the M98524 gene and, thus, it can be concluded that AA401773 and M98524 sequences are different alleles from one gene and others are alleles in another TSPY gene. Also, A725833, AI138810, AI005498, AI002165, AI001787, AA993340, AA608988, AA399368, and NG003078 are similar and it can also be concluded that these sequences are the same allele from one TSPY gene.
4.4. Principal Coordinates Analysis
To investigate the dispersion, distance, and evolutionary relationships among the TSPY gene sequences under study, their bi-plots were analyzed based on principal component analysis (PCA), and the first 3 components were depicted by software DARwin6 0.12 (61). The share of the first 3 components was 82.95%, 3.89%, and 2.03%, respectively, and in total, 88.87% of the total data. These values indicate that the first 3 components have been able to accurately calculate a high percentage of variation. According to the results, the TSPY genes sequence was divided into 4 groups, and also it was largely indicative of cluster analysis.
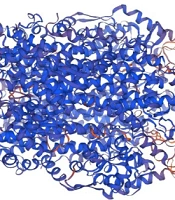
After the alignment of TSPY gene sequences, major ORF and, then, the secondary structure of this ORF were predicted (Figure 2A and Figure 3B). The Ramachandran diagram (62) for the second structure of the TSPY gene shows that this structure is good stroke chemistry and 91.3% of the remaining groups are in the red zone, which has the highest acceptability. It has several amino acids (324), with formula; C1619H2550N472O493S14, a molecular weight of 36963.76 D, theoretical pI of 5.56. The amino acid composition was Ala (A), 10.2%, Arg (R) (9.0%), Asn (N) (3.7%), Asp (D) (3.1%), Cys (C) (1.2%), Gln (Q) (5.2%), Glu (E) (12.3%), Gly (G) (5.2%), His (H) (2.5%), Ile (I) (3.1%), Leu (L) (8.6%), Lys (K) (3.7%), Met (M) (3.1%), Phe (F) (3.4%), Pro (P) (5.2%), Ser (S) (6.2%), Thr (T) (2.8%), Trp (W) (1.2%), Tyr (Y) (3.1%), Val (V) (7.1%), Pyl (O) (0.0%), Sec (U) (0.0%), (B) (0.0%), (Z) (0.0%), X) (0.0%), total number of negatively-charged residues (Asp + Glu) (50), total number of positively-charged residues (Arg + Lys) (41), Atomic composition; Carbon (1619), Hydrogen (2550), Nitrogen (472), Oxygen (493), Sulfur (14), Aliphatic index (76.51), and Grand average of hydropathicity (GRAVY) (-0.571). Integral prediction of protein location is shown in Table 5.
![Structure homology-modeling (3D Structure of TSPY protein [section A] and 3D complex docking of α-pinene with TSPY protein [section B, C, and D]).](https://brieflands.com/journals/ijcm/articles/89116/figures/ijcm-89116-g001-F2-preview.webp "Structure homology-modeling (3D Structure of TSPY protein [section A] and 3D complex docking of α-pinene with TSPY protein [section B, C, and D]).")
Figure 2.
Structure homology-modeling (3D Structure of TSPY protein [section A] and 3D complex docking of α-pinene with TSPY protein [section B, C, and D]).
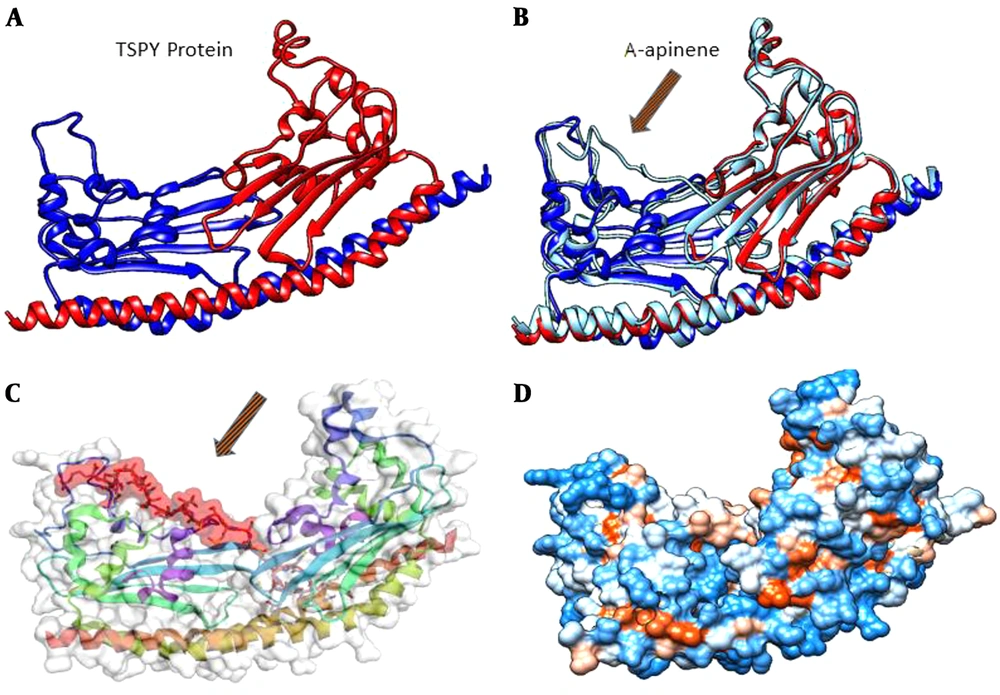
Figure 3.
The position of chemical bonds between the A, B, and ligand chains (A) and the final structure of the docked protein (B).
Table 5.
Integral Prediction of Protein Location
| Location Weights | LocDB | Pot Loc DB | Neural Nets | Pentamers | Integral |
|---|---|---|---|---|---|
| Nuclear | 10.0 | 3.0 | 1.13 | 0.00 | 9.94 |
| Plasma membrane | 0.0 | 0.0 | 0.08 | 0.18 | 0.01 |
| Extracellular | 0.0 | 0.0 | 0.08 | 0.34 | 0.00 |
| Cytoplasmic | 0.0 | 0.0 | 1.91 | 0.00 | 0.00 |
| Mitochondrial | 0.0 | 0.0 | 0.15 | 0.66 | 0.00 |
| Endoplasm retic | 0.0 | 0.0 | 0.02 | 0.00 | 0.00 |
| Peroxisomal | 0.0 | 0.0 | 0.06 | 0.00 | 0.00 |
| Lysosomal | 0.0 | 0.0 | 0.02 | 0.07 | 0.00 |
| Golgi | 0.0 | 0.0 | 0.04 | 1.91 | 0.05 |
| Vacuolar | 0.0 | 0.0 | 0.00 | 0.03 | 0.00 |
4.5. Gene Ontology Annotations and Protein Interaction Network Investigation
The review of considered influential factors that consist of proteins coded by the numerous expressed genes, direct and indirect interactions among these proteins inferred doing the STRING research tool gave protein interaction network files based on previously-reported communications between proteins. STRING mapping profiles of TSPY protein interaction network represented in Figure 4 depicts the number of nodes (11), the number of edges (17), average node degree (3.09), average local clustering coefficient (0.923), expected number of edges (10), and PPI enrichment P-value (0.0337). Interestingly, multiple hub proteins built a strong network or an operative module within their protein groups, such as nucleosome assembly protein 1-like (NAP1L) 1, 2, 4, 5, and 6 and also RNA binding motif protein, X-linked-like 2 (RBMXL2), transducin (beta)-like 1 (TBL1Y), and amelogenin, Y-linked (AMELY), which are all associated in the similar cellular appliance elements and/or genetic functions.
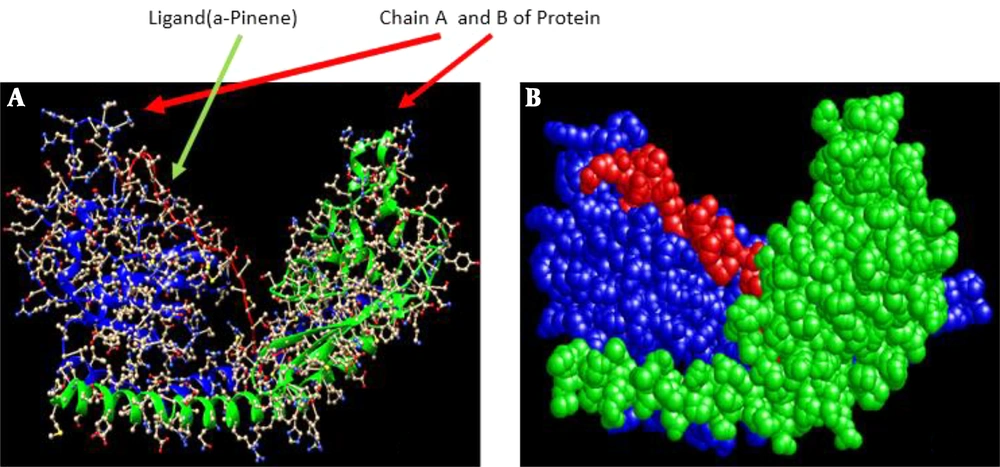
Figure 4.
String mapping profiles of protein interaction network stewarding TSPY protein interactions. The protein interacting gene products are designated in blue and green lines. There are wholly 10 hub proteins recognized and many hub proteins designed a tight network or a working module within their protein families.
Among all the proteins in the STRING databases, those were core-connected and had higher expression in many experimental data in the regulatory interaction network. Nucleosome assembly protein 1-like may be implicated in modulating chromatin configuration and contribute to the regulation of cell reproduction and also TBL1Y protein associated with the employment of the ubiquitin/19S proteasome organize to nuclear receptor-regulated transcription factors that operate an imperative role in transcription activation mediated by nuclear receptors. Seemingly behaves as a fundamental element of co-repressor complexes that mediates the recruitment of the 19S proteasome complex, leading to the following proteasomal degeneration of transcription repressor groups, through providing cofactor replacement (by analogy) (42), nucleosome arrangement proteins (63) are interested in moving histones into the nucleus, nucleosome machine, and chromatin fluidity and influence the transcription of many genes. The protein encoded by this intronless gene that it is a member of the NAP family represents a group of tissue-specific factors that regulates neuronal cell generation by interacting with chromatin (64).
4.6. In Silico Docking Analysis
Docking interaction between the ligand and the macromolecule (Figure 2B, C, and D) revealed the combination of TSPY and its binding (α-pinene) position and the aromatic groups as less hydrophilic. These interactions are vital to rank the molecular docking and matching between target and medicines. The hydrophobicity mappings were carried out to investigate the improvement of hydrophobicity clusters on the membrane surface along the molecular dynamics run and the features of interface among the membrane and membrane binding molecule.
It should be noted that in the structure of both α-pinene and TSPY proteins, there are various groups including aliphatic (lipid) and hydrophilic groups and this ability gave the protein Myrtus communis to be readily assisted by aliphatic groups of the membrane. The cell passes through the cytoplasm of the host cell and, with the help of hydrophilic groups, is soluble in the host cell cytoplasm and easily deactivates the TSPY protein.
Protein pairs with a TM-score > 0.5 are mostly in the same fold, while those with a TM-score < 0.5 are in a different fold (TM-score) (57). Several studies have suggested that the magnitude of RMSD, Global Distance Test (GDT-score), etc. are dependent on protein length (56), whereas the magnitude of TM-score is protein length-independent that is the expression of the P-value as a sole function of TM-score (57). The average TM-score value and the deviation with proteins of different sizes (from 80 to 200 amino acids) confirmed the size independence of the TM-score values in random protein pairs. The ligand is fully integrated with the A and B chains. Figure 3 shows the position of chemical bonds between the A, B, and ligand chains (Figure 3A) and the final structure of the docked protein (B) (Figure 3B).
In this research, we used both TM-score and RMSD to predict protein structure and docking (56, 57). The highest values of global and local root mean square deviation (RMSDs) (2.076 kJ/mol), Alpha Carbons (4.38 kJ/mol), GDT-TS-score (0.9436), GDT-HA-score (0.9211), Backbone (4.347 kJ/mol), and heavy atoms (5.147 kJ/mol) were obtained for TSPY model (Figure 5A and B) (Table 6). The docking of the TSPY target with α-pinene utilizing the docking method showed that all the computationally prognosticated lowest energy complexes of TSPY are preserved by intermolecular hydrogen bonds and stacking interactions, from which we choose the first one. Protein structural with the highest values of global and local root mean square deviation RMSD (2.657), TM-score (0.871), GDT-TS-score (0.812), GDT-HA-score (0.655) (56, 57) was obtained for docking of α-pinene with TSPY model (Figure 5C, D, and E) (Table 7). The α-pinene ligand reflected the best interaction with target proteins. Docking results suggested that this α-pinene compound can enter the substrate-binding region of the active site. Finally, the results demonstrated that α-pinene accurately interacts with the TSPY protein target.
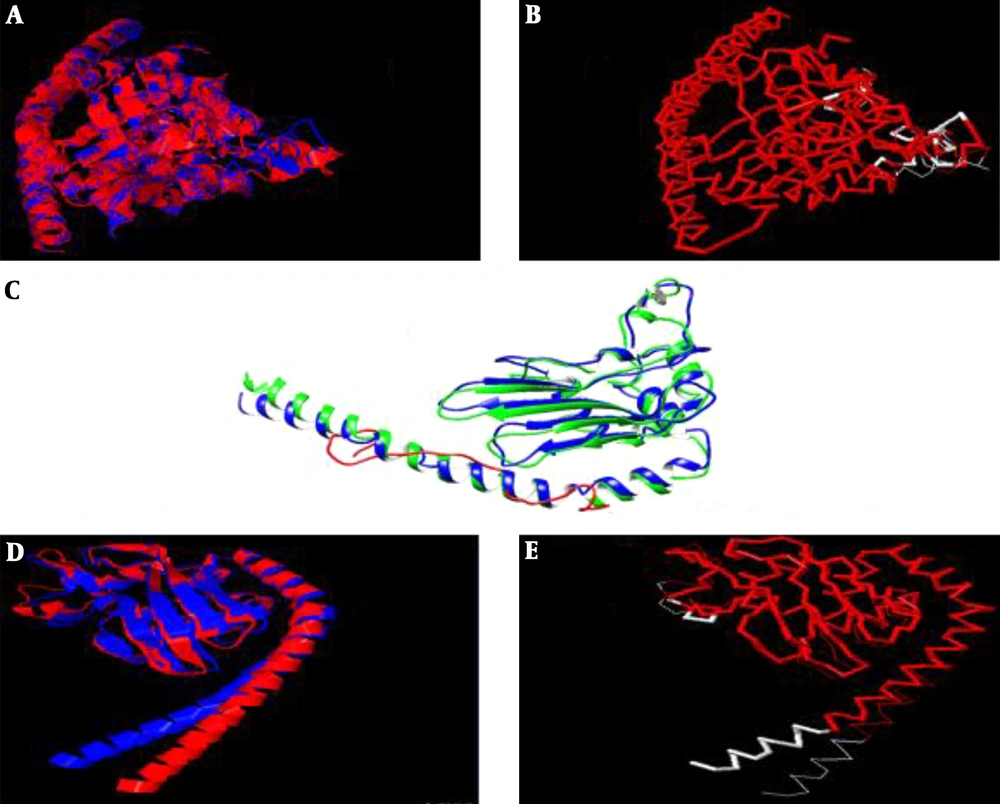
Figure 5.
Visualization of TM-score superposition for TSPY model and also docking of α-pinene with TSPY; A, Cartoon representation (Structure-1 in blue and Structure-2 in red); B, Str-1 in thick and Str-2 in thin wireframes (Residues with d < 5A in red); C, The root mean square deviations (RMSD) as functions of the dock of α-pinene with TSPY model was achieved by SuperPose (65); D, Cartoon representation (Structure-1 in blue and Structure-2 in red); E, Str-1 in thick and Str-2 in thin wireframes (Residues with d < 5A in red).
Table 6.
RMSD and Atoms for Two Chains (A and B) of TSPY Model (58)
| Alpha Carbons | Back Bone | Heavy | All | |
|---|---|---|---|---|
| RMSD | 2.79 | 2.78 | 3.59 | 3.59 |
| Atoms | 188 | 752 | 1576 | 1576 |
Table 7.
RMSD and Atoms for Two Chains (B with C and A with C) of the Dock of α-Pinene with TSPY Model (58)
| Alpha Carbons | Back Bone | Heavy | All | Structure | Residues | |
|---|---|---|---|---|---|---|
| B with C | ||||||
| RMSD | 13.81 | 13.76 | 13.83 | 13.83 | PDBA chain 'B' | 223 - 229, 240 - 245, 250 - 266 |
| Atoms | 30 | 120 | 171 | 171 | PDBB chain 'C' | 1 - 7, 8 - 13, 14 - 30 |
| A with C | ||||||
| RMSD | 12.93 | 12.88 | 12.99 | 12.99 | PDBA chain 'A' | 225 - 229, 240 - 242, 250 - 271 |
| Atoms | 30 | 120 | 157 | 157 | PDBB chain 'C' | 1 - 5, 6 - 8, 9 - 30 |
5. Discussion
Tajima’s D is the total of an inequality word with uninterested type plus words that gives concrete weight to the antique waiting times and uninterested weight to the original ones. Therefore, Tajima’s D is large and positive when there are long arms near the root. It is strongly negative when the dendrogram is biased and/or when original arms are extended. Tajima’s D is, thus, susceptible to both biased dendrograms and dendrograms with long branches near to the leaves (when negative) and balanced dendrograms with long branches near the root (when positive). The former is typical dendrograms for recently increasing groups or loci under directional selection and the latter is typical under balancing selection or for structured groups (66). In this research, Tajima’s D was positive, non-significant, and more than one (1.1709) (Table 2) and based on the tree (Figure 1) of TSPY gene family, it exhibits long branches close to the root; thus, it can be inferred that this result is true and also when there is an excess of old mutations or a reduction of young mutations, Tajima’s D and the several tests by FU and LI (34) tend to be positive. It can, therefore, be concluded that the TSPY gene family has had the slightest changes during evolution, and what caused the changes and the creation of new alleles result from mutations that occurred in the past and perhaps was one of the reasons for the earlier treatment of testicular cancer compared with other cancers. There are no new changes in the genes involved in the development of testicular cancer and whatever that has caused these types of genes to have occurred in the past happened.
In comparison with the nucleotide variations that have no impact on the resulting amino acid (dS), the results of the nucleotide variations that alter the amino acids (dN) can be a more useful and highly efficient method for the detection process of natural selection during genetic evolution. If the ratio is greater than one, the selection is positive, if it is less than one, it is a pure selection, and if it equals one, it will show a neutral selection during the evolution of these genes (67). In this study, the numerical value of the ratio (dN/dS) was 0.31, which was less than one, indicating that the pure selection has occurred on the desired gene without any key changes. NAP-1 participates in the dynamic transportation of histones from the cytoplasm to the nucleus by building a ternary network with histones and karyopherins (68).
Earlier research on medicinal plants also demonstrated the potent scavenging free radicals in the extracts of Myrtus (89.583 µg/mL) and also the antioxidant activity of the extracts increased by an increase in the concentration of the extract (62). Low concentrations (16 µg/mL and 32 µg/mL) of the extract resulted in the highest antioxidant activity (69). Tuberoso et al. (70) studied the synthetic structure of Myrtus and described the crucial oils from leaves and berries of myrtle and found the significant composites to be: α-pinene (30.0% and 28.5%), 1, 8-cineole (28.8 and 15.3%), and limonene (17.5% and 24.1%). Although many crops from the Myrtaceae family are announced to have antibacterial or antifungal activities (71, 72), very little has been reported on the antioxidant activity of this plant (73, 74).
Based on the high antioxidant activity of Myrtus (74) and the results of α-pinene anticancer activity (15, 21), in silico molecular docking analysis of α-pinene revealed that α-pinene can act as a strong anticancer drug against testicular cancer (Figure 2B, C, and D and Figure 3). Thus, Myrtus extract can be used as a strong herbal medicine against testicular cancer without having side effects.
The placement of the expressed genes in mouse and fetus into one group showed that some of TSPY genes express only a certain stage of growth that they are different from other genes from another stage of growth (Figure 1). Also, the mouse model was used for cancer treatment by the targeted drug delivery to the different tumors (75-78). It suggests that Myrtus oil and extract as effective in the treatment of testicular cancer in the mouse model.
5.1. Conclusions
Docking studies of the α-pinene with TSPY showed that this ligand is a good molecule that docks well with the TSPY target. Therefore, the α-pinene molecule plays an important role in inhibiting testicular cancer. The results of the present study demonstrated that α-pinene accurately interacts with the TSPY protein target and could be developed as a promising candidate for the new anticancer agent against testicular cancer.
The outcome will be different because it depends on the purity of protein α-pinene and the interaction of α-pinene with other existing proteins, as well as the personal genotype, type of hormones, and the concentrations of them.