


1. Background
Of endocrine malignancies, thyroid cancer is the most common type that consists of papillary, follicular, medullary, and anaplastic forms originating from histopathological characteristics (1, 2). Most of its types are not manageable due to their resistance to nature towards conventional treatment methods (3). Moreover, it possesses the highest rate of mortality among endocrine cancers (4). The application of different approaches for thyroid cancer is available as thyroidectomy, radioactive iodine therapy, and thyroid-stimulating hormone suppression (5). On the other hand, retinoic acid (RA) has been identified as a potential anticancer agent for malignancies treatment such as neoplasms of thyroid, breast, lung, liver, and so on (5, 6). This vitamin A (retinol) metabolite plays meaningful participation in cell developmental and differential processes (6). Molecular research could guide substantially clinical approaches by introducing diagnostic and therapeutic biomarkers and drug targets that play critical roles in disease management. Proteomics, as one of the promising ones, can elaborate on a particular condition such as disease by the recognition of specific proteins related to that condition. These proteins, as the functional parts of the cells, can be examined for different aspects, including their expression profile and interactions with other proteins and molecules. In the cancer field, it is also feasible to identify biomarker candidates through proteome profiling for diagnosis and drug targeting approaches (7). There are many related proteomics studies in the investigation of the therapeutic effects of different agents on tumors (8, 9). These agents could interfere with the expression levels of many targets that can be quantified by techniques such as 2D gel electrophoresis-based proteomics. Thyroid cancer is not an exception in a study by Trojanowicz et al. (5) some proteins were introduced as the targets of RA effects on thyroid cancerous. In this respect, 8 proteins were proposed as the part of mechanisms, by which RA influenced on thyroid cancer (5). On the other hand, bioinformatics as a relatively new discipline models different types of diseases. Interaction network analysis is one of these ways that identifies the central proteins of an interesting map (10). These elements with the highest scores of interactions could play a significant role in the network strength and, consequently, valuable targets for designing appropriate drugs (11). Therefore, in a proteomics study, it is possible to filter and priorities the differentially expressed proteins based on interactions. These nodes can be more essential as biomarkers of specific conditions such as applied treatments in a disease status (12).
2. Objectives
Hence, to get a better insight into how retinoic acid impacts the cancer of the thyroid, a protein-protein interaction (PPI) network analysis is conducted in this research. In this way, some proteins could be highlighted as the most crucial agents that could be applied in clinical studies.
3. Methods
Eight proteins were extracted from a proteomics study entitled “Proteomic approach reveals novel targets for retinoic acid-mediated therapy of thyroid carcinoma” by Trojanowicz et al. These proteins include Enolase 1 (ENO1), glyceraldehyde-3-phosphate dehydrogenase (GAPDH), pyruvate kinase isoenzymes (PKM1/M2), transketolase (TKT), glutathione S-transferase P (GSTP1), peroxiredoxin 2 (PRDX2), annexin A2 (ANXA2), and peptidyl-prolyl cis-trans isomerase A (PPIA). In the mentioned research, the introduced proteins were identified as down-regulated in the thyroid cancer cell line (FTC-133) treated with retinoic acid (5). In the present study, a PPI network analysis of these proteins is handled to understand the most novel proteins in terms of interaction patterns. Cytoscape software version 3.7.1 and its integrated plug-ins were used to construct and analyze the PPI map. At first, the mentioned proteins were queried by STRING DB v.1.4.2 (https://string-db.org/) (13, 14). Two networks, including one with just the searched proteins and the other one with the neighbor proteins, were retrieved. The statistical aspects are confidence score cut-off of 0.4 as the default option and addition of 50 surrounding proteins (for the second network). STRING DB can provide data from 4 sources, namely STRING PubMed, STRING Protein, STRING Diseases, and STITCH. STRING Protein source was used for obtaining the two constructed networks. The network, including additional 50 neighbors, was analyzed for the centrality parameters (degree [K] and betweenness centrality [BC]) by Network Analyzer software (15). GeneMANIA (http://www.genemania.org/plugin/), then, analyzed the prediction of the biological function between differentially expressed hub-bottlenecks (nodes with the highest value of degree and betweenness). This Cytoscape application provides interaction data types from different databases (16). Gene ontology analysis is a way to understand the biological process (BP), cellular component (CC), and molecular function (MF) of the interest set of genes or proteins. Biological processes for hub-bottlenecks differentially expressed hub-bottlenecks, and the central cluster of the constructed network was assessed via ClueGO + CluePedia. The statistical parameters assigned for these analyses were as grouping score cut-off of 0.5, GO term min number of genes = 3, and min gene percentage in term = 4. The correction method for the P-value also was Bonferroni step down, and the two-sided hypergeometric test is the enrichment/depletion (17, 18).
4. Results
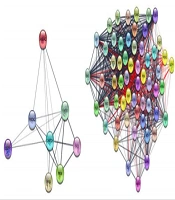
The 8 candidate genes were queried against the Cytoscape and STRING DB together, and the result showed 19 links among nodes (see the left side of Figure 1). Adding 50 relevant genes results in a network with 58 nodes and 981 edges (right side of Figure 1).
 and the network, including 8 query proteins and 50 additional relevant proteins (right side). The query proteins in the right network are shown in yellow color. The 981 edges connect 58 nodes.")
The interaction pattern of queried proteins indicates 8 nodes and 19 interactions among them (left side) and the network, including 8 query proteins and 50 additional relevant proteins (right side). The query proteins in the right network are shown in yellow color. The 981 edges connect 58 nodes.
For assessing the hub-bottlenecks, the top 20% of nodes based on degree value as hubs and 20% of nodes based on betweenness as bottlenecks were considered. Common hubs and bottlenecks were identified as hub-bottlenecks that are tabulated in Table 1. Eight proteins in the constructed network of RA affecting thyroid cancer cells could be understood as hub-bottlenecks. Among these proteins, some of the investigated DEPs, including GAPDH, ENO1, and PKM, are top hub-bottlenecks.
| Row | Display Name | K | BC |
|---|---|---|---|
| 1 | GAPDH* | 57 | 0.04 |
| 2 | ENO1* | 53 | 0.03 |
| 3 | PKM* | 52 | 0.03 |
| 4 | PGK1 | 52 | 0.03 |
| 5 | TPI1 | 50 | 0.02 |
| 6 | LDHA | 48 | 0.02 |
| 7 | GAPDHS | 45 | 0.02 |
| 8 | ENO2 | 42 | 0.01 |
GeneMANIA analysis revealed relations between DE Hub-bottlenecks that are physical interactions, co-expression, predicted function, and co-localization that are assigned in different colors (Figure 2). The highest score is for physical interactions (ENO1 and GAPDH) (GAPDH and PKM), which is 67.64. The next ranked interaction is co-expression (ENO1, GAPDH, and PKM) with a score of 13.50. The later one is between ENO1 and GAPDH, which are co-localized. Predicted action is as well valid for all 3 proteins.

GeneMANIA annotation of proteins’ interactions. The interaction types here are colored differently.
As it is illustrated in Figure 3, 3 complexes are obtained from the network. Four DEPs, including PKM, GAPDH, ENO1, and TKT are presented in the first complex. This cluster has 31 nodes and 457 edges. The seed protein in this protein complex is PDHB. The next cluster contains 19 and 139 nodes and edges, respectively. PRDX2 is the only DEP that is present in this complex, which is PRDX2. The seed of this complex is HSPA8. The last complex includes 3 nodes, and GSTP1 is the only DEPs that is presented in this protein complex. The seed protein here is CAT.

MCODE analysis of the network of thyroid cancer cells, which are treated with RA. Node score cut-offs for the complex 1, 2, and 3 are 30.467, 15.444, and 3.000, respectively. The square-shaped node indicates seed protein. Node score cut-off: 0.2, K-core: 2, Degree cut-off: 2.
Biological process analysis of the hub-bottlenecks and the first cluster of the main network as well could show the possible influenced groups of biological terms in the treatment of RA as shown in A and B parts of Figure 4, respectively. As it is shown in Figure 4, the Glycolytic process through fructose-6- phosphate and ATP generation from ADP is the most highlighted groups in hub-bottlenecks and, similarly, NADH regeneration and glyceraldehyde-3-phosphate metabolic processes are the most important ones for cluster 1.
 evaluations of the hub-bottlenecks and the first protein complex are shown in parts A and B, respectively. The glycolytic process through fructose-6 phosphate and NADH regeneration are the primary BCs in the A and B charts, respectively.")
Pie charts view of biological processes (BCs) evaluations of the hub-bottlenecks and the first protein complex are shown in parts A and B, respectively. The glycolytic process through fructose-6 phosphate and NADH regeneration are the primary BCs in the A and B charts, respectively.
Since the glycolytic process through fructose-6- phosphate was the leading group in Figure 4, which was related to hub-bottlenecks, its relationships with the 3 query hub-bottlenecks (GAPGH, PKM, and ENO1) are shown in Figure 5. This group via 8 terms is connected to DE hub-bottlenecks.

The network of biological terms, which are related to differentially expressed hub-bottlenecks. The terms are grouped as the glycolytic process through fructose-6- phosphate.
As it is shown in Figure 1, there are several oncogenic proteins among the added neighbors. To find the possible regulatory relationships between the oncogenic proteins and the metabolic central nodes, the action map between these elements was analyzed and shown in Figure 6. In Figure 6, AKT1, STAT3, and MYC (the 3 oncogenes) activate GAPDH, ENO1, and PKM as the metabolic proteins. Therefore, it can be concluded that the regulation of the metabolic proteins has resulted from the regulation of oncogene proteins by RA.

Activation map between metabolic central query proteins and oncogenic proteins among added neighbor proteins. PDHB as a seed protein in the main complex protein is also considered; however, it is not included in the map.
5. Discussion
Network analysis is a useful method to screen large numbers of differential proteins for introducing a few central ones that can be used for clinical purposes. Interactome study is also a suitable method to determine new potent molecular agents that are involved in the onset, progress, and treatment of diseases. In this regard, the PPI network study is applied to discover potent proteins that are related to suppressing thyroid cancer cells by using RA. As it is shown in the result part, 8 DE proteins, which are highlighted by a proteomic study, were candidates for exploring the most crucial ones in terms of interacting in thyroid cancer treatment by RA.
At first glance, all of the query proteins are connected directly or indirectly. GAPDH and ENO1 are connected to all of the neighbors and PKM, and ANAXA2 are linked to 5 proteins among 8 queries DE proteins. It seems that the role of these 4 proteins is prominent relative to the other ones. Centrality analysis revealed that GAPDH, ENO1, and PKM proteins are the ones with significant centrality properties known as DE hub-bottlenecks. In other words, these 3 DE proteins not only are central proteins but also identified as top hub-bottlenecks in our network analysis. GeneMANIA analysis (Figure 2) showed the different types of relationships between the queried hub-bottlenecks. The analysis of this algorithm expresses that all the proteins tend to have similar expression as it is also indicated as down-regulation in the main proteomic study. The first complex is the most worthy one in terms of a high score of interconnections and containing half of the DEPs.
The 3 query hub-bottlenecks are included in this protein complex. This finding leads to 2 valuable advantages; first, confirming the prominent role of GAPDH, ENO1, and PKM as central proteins and; second, introducing PDHB (seed of complex) as a crucial new element. PDHB gene encodes pyruvate dehydrogenase E1 beta subunit protein (19). Therefore, it can be inferred, as indicated in Figure 3 and Table 1, that the first cluster worth pursuing more analysis in terms of gene ontology. Figure 4 demonstrates that the high ranked cluster is significantly involved in metabolic processes. This finding also aligns with the results of the study in 2010, in which the participation of metabolic relations in thyroid cancer treated with RA was highlighted (5). This finding concludes that, as the pathway linked to the hub-bottlenecks and the most critical cluster is the same for DEPs in the first research, our outcome is valid coordination.
Moreover, the biological process analysis for the 3 down-regulated hub-bottlenecks shows that the Glycolytic process through fructose-6- phosphate is a fundamental process for these proteins. This process is also highlighted for the whole hub-bottlenecks of the main network. This indicates that the most influenced part of the metabolic system could be the Glycolytic process through fructose-6- phosphate. Biological studies suggest that metabolic alterations, including the activation of glycolysis, are prerequisites of the promotion of aggressive cancers (20). As it is reported, cancer cells suppress the oxidation phosphorylation process in mitochondria and activate aerobic glycolysis to provide the energy required for cancer cell survival and growth. It is observed that thyroid cancer cells can switch oxidation phosphorylation-glycolysis to access suitable energy levels for growing (21). Extensive alteration in the regulation of mitochondrial biochemical pathways is reported in thyroid cancer disease. The up-regulation of different tyrosine receptor kinase genes that elevates the relevant activities are stated (22). GAPDH as potent central DE protein in our study is a housekeeping protein (23) and such as the other identified hub-bottlenecks is not an oncogenic protein. As it is shown in Figure 1, several oncogenes are connected to the introduced central nodes. MYC and STAT3 are two oncogenes that play a critical role in different cancers. MYC plays a key role in the regulation of cancer cells’ metabolism. STAT3 is a well-known oncogene that is activated in the many cancer types and is involved in the block of apoptosis (24, 25). The role of the other oncogene, AKT1, in the regulation of several cellular functions in various cancers is reported and discussed in detail (26).
It can be concluded that the introduced central proteins could not be the main causes of thyroid cancer and may have indirect associations. Therefore, their regulation by RA does not result in thyroid cancer suppression. It is a logical conclusion that RA regulates the adequate protein expression level of oncogenes, which involves the promotion of cancer.
The regulation of these oncogenes leads to the control of the metabolic enzymes. The action map confirms this hypothesis (Figure 6). This finding does not decrease the importance of our findings because the introduced central proteins can be useful in the follow-up of the patients.
5.1. Conclusions
GAPDH, ENO1, PKM, and PDHB are introduced as a consequence effect of RA on thyroid cancer cells based on network analysis. Besides, they are revealed to be related to the oncogenes such as MYC, STAT3, and AKT1. The introduced crucial DE proteins are linked to the term, namely the glycolytic process through fructose-6-phosphate, which is an important energy consumption style in mitochondria. Therefore, the identified critical central proteins can be used in the follow-up of the patients and monitoring of the treatment of RA used as a chemotherapy reagent.
