1. Background
Gastric cancer is one of the leading causes of cancer death worldwide. The incidence and mortality of this cancer are higher in the Asian population compared with other nations. The highest incidence in Asia has been reported from some countries, such as China and Korea and the survival rate is about 5 years (1, 2). Gastric cancer is classified into two subgroups including intestinal and diffuse types according to Lauren classification. Furthermore, recently another molecular classification divided gastric cancer into 4 subgroups characterized by the existence of Helicobacter pylori or Epstein-Barr virus (EBV), microsatellite instability (MSI), mutations related to gastric cancer, and transcriptional or epigenetic changes (3, 4). In spite of the aforementioned classifications, gastric cancer’s poor prognosis is still challenging and complementary methods are needed for the early diagnosis. In addition to the timely diagnosis of cancer, the invasive and metastatic state of gastric cancer is one of the problems that can increase the mortality rate of this type of cancer.
One of the mechanisms involved in the formation of metastasis and the creation of an aggressive state in cancer is an epithelial-mesenchymal transition (EMT) process. EMT is a highly-regulated process in embryogenesis and wound healing. In cancer, cells progressively lose their epithelial features while gaining mesenchymal markers that lead to cellular detachment from the primary tumor, which leads to metastasis and invasion of cancer. The extracellular matrix (ECM) is a key component of a cell’s microenvironment that could induce EMT in cancer cells by activating different signaling cascades. The aberrant regulation of signaling pathways may lead to the EMT activation of gastric cells, which allows tumor cells to spread throughout the body (5, 6).
In the last decades, high-throughput next generation sequencing (NGS) technologies have replaced the traditional methods for identifying novel molecular biomarkers and alteration of gene expression. Several large-scale studies have identified the various genes involved in the EMT process (3, 7).
One of the targeted genes in the current study was thrombospondin 2 (THBS2), which is the second member of the thrombospondin family that can mediate ECM interactions by interacting with multiple cell receptors and other proteins (8). Adherence ability to ECM is important for cancer cell migration and invasion. Furthermore, this glycoprotein, which is secreted by various types of cells, including stromal fibroblasts, endothelial, and immune cells, could promote EMT by activating different cascades such as TGF-β and PI3K pathways (6, 9). The overexpression of THBS2 was observed in the bladder, CNS, breast, colorectal, pancreatic, lung, and gastric cancers and correlated with poor prognosis (10).
Another targeted gene in this study was the oncostatin M receptor (OSMR), which is a member of the interleukin 6 (IL6) receptor family. This receptor binds to gp130 to form the receptor for its main ligand, multifunctional cytokine oncostatin M (OSM) (11). Also, it can bind to IL31, which is one of the inflammatory cytokines. OSMR is expressed in many types of cells including leukocytes, endothelial cells, hepatocytes, neurons, and some epithelial cells. The overexpression of this cytokine and its receptor was reported in many tumor cell types. OSM-OSMR could induce the EMT process mainly through the JAK/STAT pathway (12).
Chitinase-3-like protein 1 (CHI3L1) or cartilage glycoprotein-39, also known as YKL-40, was the last gene that was validated in the current experiment. This glycoprotein is a 40 k Da carbohydrate-binding lectin and it has no chitinase activity. Normally, CHI3L1 is a growth factor for connective tissue cells, but the exact biological function of this protein in cancer is largely unknown. The upregulation of this gene was reported in many inflammatory conditions and inflammatory cytokines like IL6, IL13, and TNF-alpha could regulate its expression (13). It is believed that YKL-40 interacts with many components of ECM like collagens and fibronectin. The upregulation of this gene might induce EMT through JAK/STAT signaling pathway (14).
Given the role of genes involved in EMT and subsequent malignancy in gastric cancer, we have carried out a bioinformatics analysis on the raw data that were collected from RNA-seq published in the study. At the end of the analysis, we have reached a vast variety of genes that were differentially expressed in both up- and downregulation in gastric cancer tissues compared with normal samples. Then, we have selected those genes, which were involved in the EMT procedure from the top 10 significantly upregulated candidates for validating their role in the malignancy of gastric cancer in the Iranian population.
2. Methods
2.1. Bioinformatic Analysis
Six gastric cancer (including three tissues and three cell lines) and two normal sequencing raw sample datasets were collected from the European Nucleotide Archive (ENA) (ENA; SRX193413) (https://www.ebi.ac.uk/ena/data/view/SRR585570-SRR585577). These paired datasets were generated, using Illumina Genome Analyzer II and were downloaded in the form of FASTQ files. All raw reads were qualified by FastQC software and, then, were trimmed by Trimommatic (version 0.36) tool, which was developed to remove adapters and scan every read and trim the lower-scored bases. After quality control and trimming, the clean reads were aligned to the human reference genome (GRCh38.92), using Hisat2 (version 2.1.0) software. The output of the previous step was stored in the form of the SAM file and was used as an input for obtaining raw counts by HTSeq software. Finally, in order to get DEGs, the analysis was performed, using the R software and DESeq2 package (Bioconductor package).
Pathway enrichment analysis has been performed for all upregulated and downregulated genes, using the Enrichr database (Enrichr; http://amp.pharm.mssm.edu/Enrichr/). Then, 3 genes from upregulated DEGs were selected for validating in the Iranian population and protein-protein interactions (PPI) have been used by the STRING database (STRING; https://string-db.org/).
2.2. Tissue Samples
In this case-control study, 25 confirmed adenocarcinoma gastric cancer and non-malignant normal tissues according to their pathology reports (Table 1) were recruited within 2 years from Taleghani Educational Hospital and Imam Hossein Educational Hospital, Tehran, Iran. The participants of this study have not received any treatment like chemotherapy, radiotherapy, and immune therapy. Written consent was obtained from each individual. Specimens were stored in RNA later stabilizing solution (QIAGEN) at -70°C.
| Features | Frequency (%) |
|---|---|
| Age | |
| > 50 | 21 (84) |
| ≤ 50 | 4 (16) |
| Sex | |
| Female | 5 (20) |
| Male | 20 (80) |
| Gastric cancer type | |
| Adenocarcinoma, moderate to poorly differentiated | 15 (60) |
| Adenocarcinoma, differentiated | 10 (40) |
aSamples were from 25 patients with gastric cancer.
2.3. RNA Extraction and cDNA Synthesis
Total RNA was extracted by QIAGEN All Prep DNA/RNA/miRNA Universal Kit (Cat. No.: 80224) from 30 mg of fresh tissue. The tissue was grinded in liquid nitrogen by mortar and pestle and the rest of the process was carried out according to protocol step by step. Finally, the quality of RNAs was checked by measuring the optical density with the Nanodrop (Thermo Fisher Scientific, USA) to confirm that the ratio of the absorbance at 260 nm and 280 nm ranging from 1.8 to 2.0. cDNA was synthesized by Thermo Fisher Revert Aid First Strand cDNA Synthesis Kit, using Random Hexamer primers (Cat. No.: k1691).
2.4. Real-Time Polymerase Chain Reaction (PCR)
To confirm the targeted genes with real-time PCR, their expression levels were measured. The reaction was carried out in a total volume of 25 μL, which included 12.5 μL of Amplicon SYBR Green without ROX (Cat. No.; A323402). PCR was performed at 95°C for 15 minutes in order to activate the Hot start Taq DNA polymerase and, then, for 40 cycles of amplification at 95°C for the 30 seconds appropriate annealing temperature for each gene and 60 seconds in a two-step program on a Rotor-Gene Q real-time PCR machine. All samples were tested in duplicate, and samples without template were included in each PCR plate as a negative control. The levels of glyceraldehyde-3-phosphate dehydrogenase (GAPDH) mRNA were quantified in each sample, and the expression level of each sample was calculated as the value of targeted mRNAs divided by that of GAPDH mRNA. The amplified fluorescence signal in each specimen was measured at the late extension step of each cycle. All primers were designed by Primer 3 software and the accuracy and specificity of the primers were evaluated by the Gene Runner tool (version 6.0.04). Finally, primers were blasted at NCBI. The following sequence of primers was used: 5′-ACTTCAGGGGTTTGCTTCAG-3′ (forward) and 5′-GTGTTCTCACTGATGGCGTTG-3′ (reverse) for THBS2, 5′-CGTTTACCATTGACTCCTGT -3′ (forward) and 5′- AATTCCCCACCCAGATGAC -3′ (reverse) for OSMR, 5′- CTCAAGAACAGGAACCCC -3′ (forward) and 5′- TCCAGCCCATCAAAGCCAT -3′ (reverse) for CHI3L1, 5′-AATCCCATCACCATCTTCAA -3′ (forward) and 5′-TGGACTCCACGACGTACTCA -3′ (reverse) for GAPDH.
2.5. Statistical Analyses
The analysis was performed, using the R package (DESeq2). Normalization and differential analysis are carried out according to the DESeq2 model (P < 0.05). The validation of real-time PCR datasets was analyzed, using REST 2009 (version 2.0.13) and Prism5 software. All data are presented as the mean ± SEM and expression ratio was analyzed, using the two-tailed, unpaired t-test (P < 0.05).
3. Results
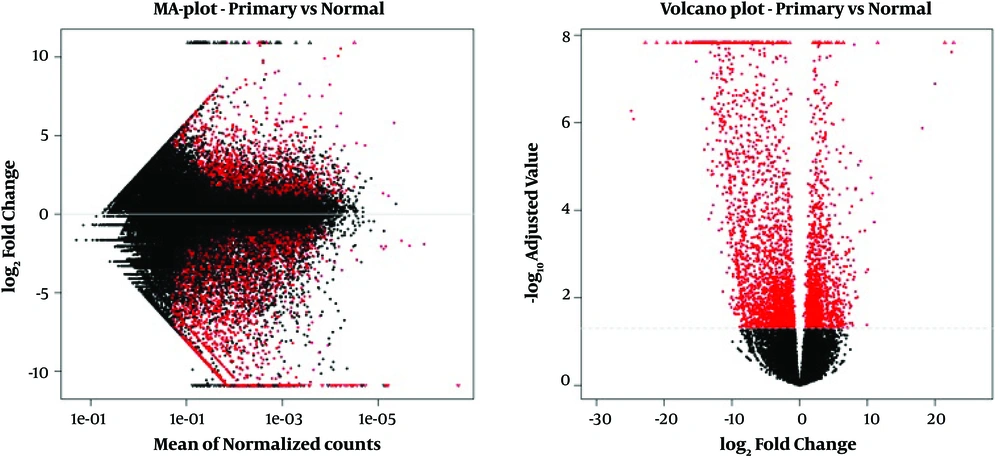
In this study, we have carried out the bioinformatic analysis of raw data that was collected from the RNA-seq published experiment; 3762 genes were differentially expressed between normal and affected tissues (Padj value < 0.05), including 1393 upregulated and 2369 downregulated (Figure 1).
MA-plot and Volcano plot of each comparison. Red dots represent significantly differentially expressed features between normal and affected (primary) tissues. MA-plot (left) represents the log ratio of differential expression as a function of the mean intensity for each feature and Volcano plot (right) represents the log of the adjusted P value as a function of the log ratio of differential expression.
To better understand, the biological pathways of all upregulated and downregulated genes were considered, using the Enrichr online database (Reactome 2016) (Tables 2 and 3). The downregulation of different immune-related pathways was observed in gastric cancer tissues (Table 2) (P < 0.05). Here, we have focused on upregulated genes. Reactome pathway enrichment analysis has demonstrated the upregulation of ECM interactions and changing in ECM structure, which is the main step in the EMT process (Table 2).
| Pathways | P Value |
|---|---|
| Crosslinking of collagen fibrils-Homo sapiens_R-HSA-2243919 | 0.002204 |
| Extracellular matrix organization-Homo sapiens_R-HSA-1474244 | 0.004527 |
| Laminin interactions-Homo sapiens_R-HSA-3000157 | 0.004028 |
| Non-integrin membrane-ECM interactions-Homo sapiens_R-HSA-3000171 | 0.007538 |
| Interleukin-6 family signaling-Homo sapiens_R-HSA-6783589 | 0.009309 |
| Fibronectin matrix formation-Homo sapiens_R-HSA-1566977 | 0.005712 |
| Assembly of collagen fibrils and other multimeric structures-Homo sapiens_R-HSA-2022090 | 0.01147 |
| Purine ribonucleoside monophosphate biosynthesis-Homo sapiens_R-HSA-73817 | 0.007317 |
| Collagen formation_Homo sapiens_R-HSA-1474290 | 0.01427 |
| IL-6-type cytokine receptor ligand interactions_Homo sapiens_R-HSA-6788467 | 0.01036 |
| Pathways | P Value |
|---|---|
| Immunoregulatory interactions between a Lymphoid and a non-Lymphoid cell_Homo sapiens_R-HSA-198933 | 1.467e-17 |
| FCGR activation_Homo sapiens_R-HSA-2029481 | 2.928e-13 |
| Role of phospholipids in phagocytosis_Homo sapiens_R-HSA-2029485 | 1.395e-10 |
| Classical antibody-mediated complement activation_Homo sapiens_R-HSA-173623 | 3.213e-10 |
| Initial triggering of complement_Homo sapiens_R-HSA-166663 | 3.393e-10 |
| Complement cascade_Homo sapiens_R-HSA-166658 | 1.239e-10 |
| Creation of C4 and C2 activators_Homo sapiens_R-HSA-166786 | 1.150e-9 |
| Scavenging of heme from plasma_Homo sapiens_R-HSA-2168880 | 1.689e-9 |
| FCERI mediated Ca+2 mobilization_Homo sapiens_R-HSA-2871809 | 5.369e-8 |
| Binding and Uptake of Ligands by Scavenger Receptors_Homo sapiens_R-HSA-2173782 | 3.514e-8 |
We have selected 3 genes involving in ECM, including THBS2, OSMR, and CHI3L1 from the top 10 upregulated genes (Table 4) (Padj value < XE-11 and log2 fold change > 2).
| Gene Name | Ensemble Gene ID | Padj Value | Log2 Fold Change |
|---|---|---|---|
| CDH4 | ENSG00000179242 | 1.33E-23 | 6.416 |
| MTHFD1L | ENSG00000120254 | 2.73E-19 | 2.937 |
| THBS2 | ENSG00000186340 | 1.06E-16 | 4.639 |
| SERPINH1 | ENSG00000149257 | 1.63E-13 | 3.06 |
| CHI3L1 | ENSG00000133048 | 5.84E-13 | 11.516 |
| OSMR | ENSG00000145623 | 1.03E-12 | 4.253 |
| EEF1A1P16 | ENSG00000213235 | 2.73E-12 | 2.969 |
| RPS12P23 | ENSG00000180172 | 8.82E-12 | 4.058 |
| NRK | ENSG00000123572 | 2.22E-11 | 5.427 |
| EEF1A1P38 | ENSG00000261557 | 5.74E-11 | 2.982 |
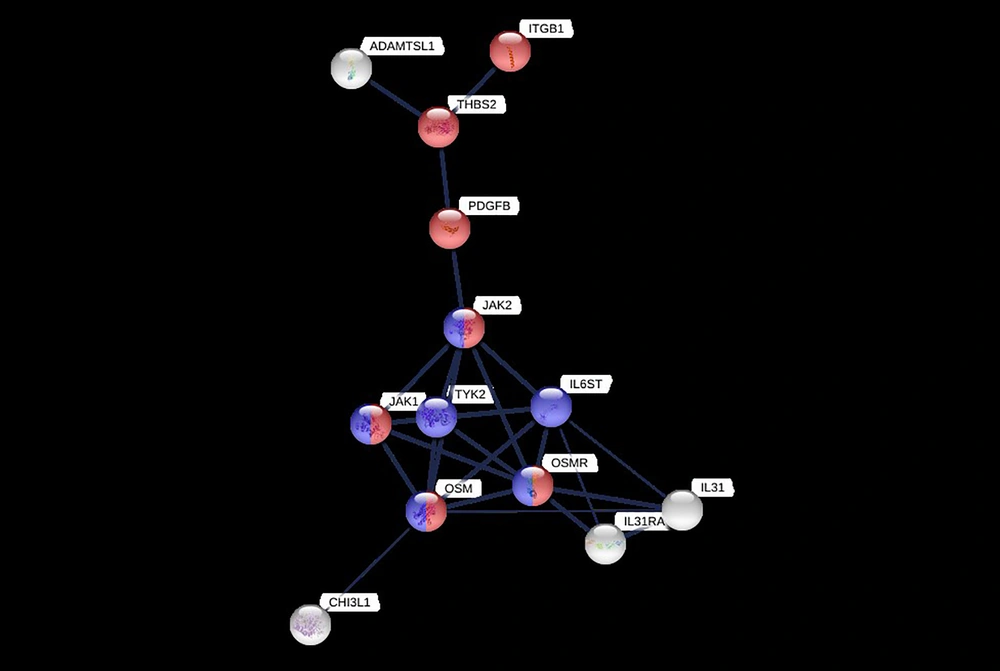
Based on PPI information from the STRING database, we have evaluated the interaction of these proteins (Figure 2). Proteins in this network are involved in two regulatory signaling pathways, including JAK/STAT and PI3K/AKT (KEGG pathway ID; 04630 and 04151, respectively). Both pathways have been considered to activate by ECM interactions.
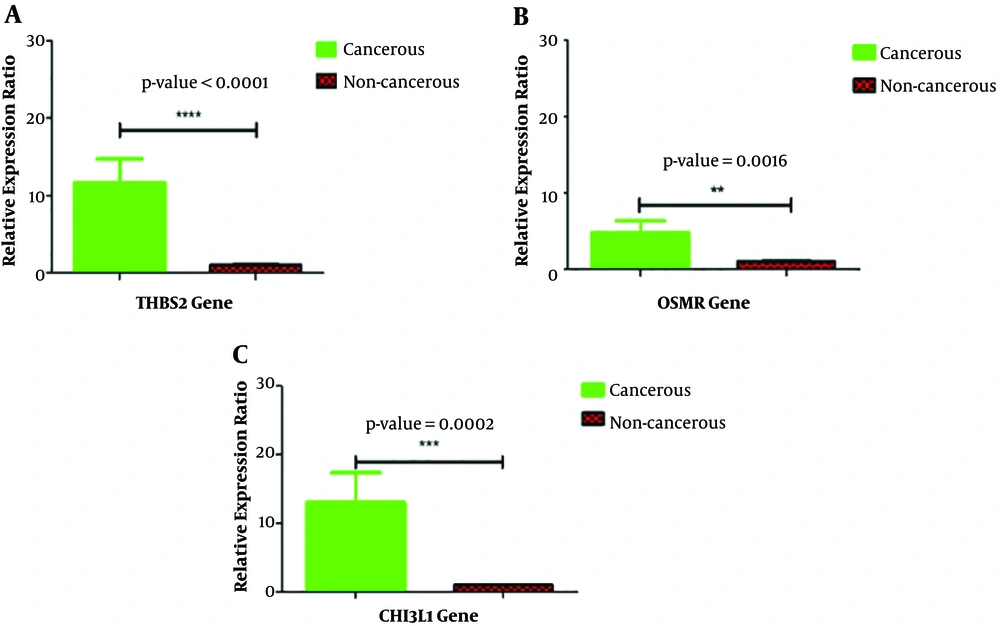
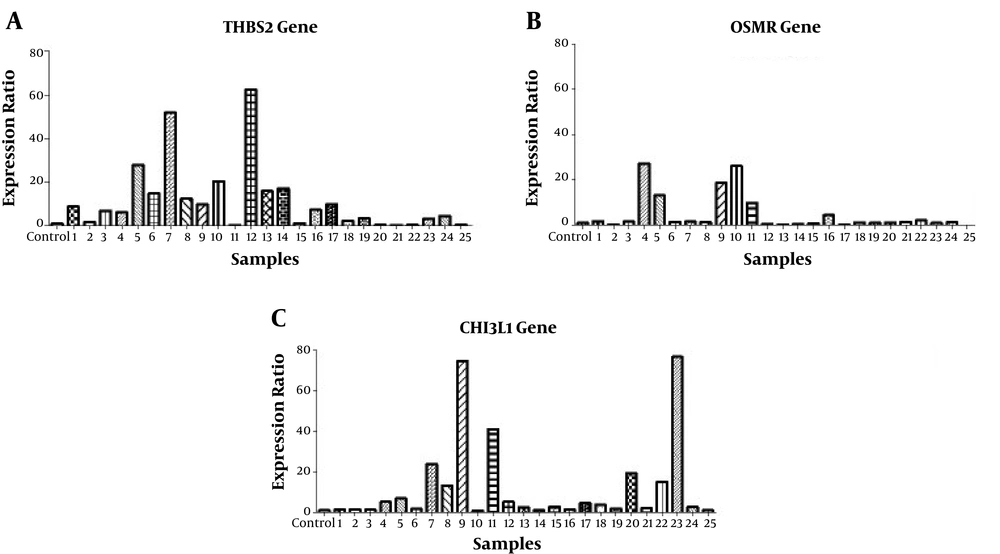
Real-time PCR verified the upregulation of THBS2, OSMR, and CHI3L1 (P < 0.05) in 25 gastric cancer tissues compared with noncancerous tissues (Figures 3 and 4).
Validation of differentially expressed mRNA in 25 gastric cancer patients. Alteration in the expression of THBS2 (A), OSMR (B) and CHI3L1 (C) genes between cancerous and non-cancerous groups of patients. The genes were normalized by GAPDH as a housekeeping gene. The expressions of these three genes were significantly upregulated (P < 0.05). The data is presented as SEM of three times experiments (**P < 0.01, ***P < 0.001, and ****P < 0.0001).
4. Discussion
Although important progress has been made to identify the biological and molecular mechanisms of gastric cancer, the heterogeneity and poor prognosis of gastric cancer are still challenging.
In the current study, we have collected DEGs in gastric cancer, using the bioinformatics pipeline. The results of the present study have indicated that most of the genes that were significantly upregulated in gastric cancer tissues have a role in ECM interactions. We have aimed at selecting genes that have a role in the EMT process by making changes in the ECM environment. Although EMT is a complex process in metastasis initiation in cancer cells, changing in ECM organization including collagen, laminin, and fibronectin formation have been observed in our analysis (Table 2). We have assumed that the overlapping of different intracellular cascades activated by the upregulation of ECM interactions leads to EMT in cancer cells.
THBS2 was one of the targeted genes that have a role in ECM interactions. Previously, Wang et al., have considered THBS2 a novel prognostic marker in colorectal cancer detection. They have verified the role of this glycoprotein in the focal adhesion, ECM interactions, and TGF-β signaling pathway. Also, they have demonstrated the correlation between THBS2 and EMT markers in their comprehensive meta-analysis study (8). Sun et al. have reported that most cases with gastric cancer showed a lower level of THBS2 in comparison with normal cases in 14 Chinese patients (15). In contrast with the previous study, in another experiment in China with a larger sample size including 105 patients, the relationship between the expression of THBS2, COL1A2, and SPP1 genes, as well as gastric cancer incidence, was investigated (16). Their results have shown the upregulation of THBS2, but not COL1A2 and SPP1 in gastric cancer tissues. In line with the previous study, Kim et al. have reported THBS2/CA19-9 as a new biomarker in the early detection of pancreatic ductal adenocarcinoma. They have found out that the concentration of THBS2 in plasma could discriminate patients with pancreatic ductal adenocarcinoma from healthy controls with high specificity but not significant sensitivity (17). According to their results, combining THBS2 with CA19 has increased sensitivity up to 87%. Furthermore, in another meta-analysis study by Jiang et al., the upregulation of the THBS2 gene was confirmed in gastric cancer from an integrative analysis of gene expression dataset (18). As our expectations and inconsistent with most studies, we have validated the upregulation of this gene in the Iranian group of patients including 25 patients with confirmed gastric adenocarcinoma by real-time PCR (P < 0.0001). This glycoprotein may play its role through the PI3K-AKT signaling pathway via ECM (Figure 2). In parallel with our analysis, in a very recent report, THBS2 was confirmed as a novel EMT inducer marker through PI3K-AKT signaling pathway (19). PI3K-AKT is an important signaling pathway activated by TGF-β or via EGF and PDGF receptors. In addition, former studies have widely shown the relationship between this pathway and EMT-related markers (20).
OSMR was another targeted protein that was validated in our experiment. Jiang et al. have reported this gene as one of the potential biomarkers for gastric cancer in their integrative microarray analysis (21). Hence, Kucia-Tran et al. have confirmed the overexpression of this gene and its correlation with EMT-related markers in cervical squamous cell carcinoma. They have shown the role of OSM-OSMR in activating the JAK/STAT signaling pathway by JAK2 and STAT3 silencing independently (22). Signal transducer and activator of transcription 3 (STAT3) is an important EMT-inducer that could upregulate the expression of EMT-related markers, especially Snail, Slug, and Twist transcription factors. The aberrant expression of STAT3 has been reported in many cancers, especially in metastatic stages. IL6R/gp130 and OSMR/gp130 could activate STAT3s via JAK2s phosphorylation. JAK/STAT pathway also could be activated via integrins, EGFR-dependent, or independent (23). Smigiel et al. have found a relationship between invasive pancreatic cancer and the upregulation of OSM-OSMR via the JAK/STAT signaling pathway, which leads to cancer stem cell phenotypes formation (24). In the current study, we have observed an overall high expression of this gene in our group of participants with gastric cancer by real-time PCR (P = 0.0016). However, the expression ratio was variable among patients (Figure 4). In parallel with other studies that we described above, OSMR may induce the JAK/STAT signaling pathway via ECM in cancer cells (Figure 2).
Among 10 high-upregulated candidate genes, CHI3L1 or YKL40 was the last targeted protein involving in ECM, which was validated in Iranian patients. The biological function of this gene is less studied compared with others. However, most studies have identified CHI3L1 as a biomarker for a variety of cancers (13, 25-29) and the high serum level of this glycoprotein is correlated with malignancies (13, 25, 27). Bi et al. have investigated the CHI3L1 expression in 174 Chinese patients with gastric cancer. According to their results, the high expression of CHI3L1 gene is correlated with tumor invasiveness and patient’s short survival rate (28). Similar to Bi et al., this study showed the significant upregulation of CHI3L1 in Iranian patients with gastric cancer (P = 0.0002). In spite of less information about the exact function of this glycoprotein in cancer cells, the correlation between CHI3L1 gene and EMT-related markers was reported (29). YKL40 has a role in ECM remodeling and might be regulated by STAT3 through the JAK/STAT signaling pathway (14).
As we mentioned above, emphasizing TGF-β, PI3K, and JAK/STAT signaling pathways, signaling mediated by ECM is a key regulator of EMT. The overlapping of different cascades and the expression of EMT-related markers in the response of these activations lead to an alteration in the ECM environment of the surface of cancer cells (30). These findings have supported the importance of ECM components in changing the ECM environment in cancer invasion and progression. Consequently, in parallel with most studies that were discussed above, the results of this study have shown THBS2, OSMR, and CHI3L1 as new candidate biomarkers for gastric cancer in the Iranian population. In line with the present study, the diagnosis of these markers along with other diagnostic markers in gastric cancer can be studied.
4.1. Conclusions
In conclusion, due to the importance of ECM in EMT initiation in cancer cells, we have selected THBS2, OSMR, and CHI3L1 from the top 10 upregulated genes from the large scale analysis of whole transcriptome analysis of gastric cancer raw sample datasets. All selected genes were involved in the EMT procedure via ECM interactions. The expression of these genes has not already been evaluated in the Iranian population. However, there were limitations of sample size; but our results have validated the upregulation of these genes in Iranian patients with gastric cancer. In line with the current study, more extensive research through next generation sequencing and large-scale analysis techniques on Iranian samples can provide a more accurate assessment of gastric cancer malignancy.


