


1. Background
Serum creatinine (Cr) is most commonly used to quantify the glomerular filtration rate (GFR) and is considered a classic kidney function indicator (1). Decreased GFR has been regarded as an independent risk factor for cardiovascular disease (CVD) morbidity and mortality (2). In 2013, a GFR of < 60 ml/min/1.73 m2 contributed to nearly 4% of all deaths and 18.7 million cardiovascular DALYs worldwide (3). Moreover, the presence of cardiovascular risk factors confers higher CVD mortality and morbidity in patients with decreased GFR (4, 5).
The Modification of Diet in Renal Disease Study (MDRD) and the Chronic Kidney Disease Epidemiology Collaboration (CKD-EPI) equations are widely used in clinical laboratories for the estimation of GFR and reporting the prevalence of chronic kidney disease (CKD) based on serum Cr concentrations. The MDRD equation was developed in patients with CKD, and its use in clinical and public health practice is limited by the systematic underestimation of GFR in populations with normal or near-normal kidney function and overestimation of CKD prevalence. The CKD-EPI equation has been developed to provide more reliable GFR estimations and improve the precision and bias of the MDRD equation, especially in individuals with higher levels of measured GFR; thus, it can have important implications for clinical decision-making in patients with decreased kidney function (6, 7).
The burden of CVD, as the leading cause of premature mortality in Iran and the Middle East, is high and still increasing, with larger trends than those in America, Europe, and Eastern Asia (8). A meta-analysis of studies mainly conducted in western and eastern Asian countries has indicated that the CKD-EPI equation predicts all-cause and cardiovascular mortality and end-stage renal disease (ESRD), more accurately than the MDRD equation (9). However, since both of these equations were derived from large North American populations and comprise coefficients adjusted for the African American ethnicity (7, 10), there are still concerns that they may not perform similarly in different ethnicities. This is while experimental evidence to support these results being applicable across the middle eastern populations is lacking.
2. Objectives
The purpose of this study was to compare the MDRD and CKD-EPI equations for the detection of CVD and cardiovascular risk factors in a large sample of the general Tehranian adult population.
3. Methods
3.1. Study Population
The Tehran Lipid and Glucose Study (TLGS) is an observational population-based cohort study being launched since 1999 to evaluate the incidence of cardiovascular outcomes and their risk factors among a representative sample of the general Tehranian population. The aims and designs of TLGS have been described previously (11). The participants were recruited by a multistage cluster random sampling technique from the urban district 13 of Tehran in the first phase (1999 - 2001) and the second phase (2002 - 2005). The follow-up assessments were performed in subsequent surveys at approximately 3.6-year intervals. For the current study, from a total of 11,420 participants in the sixth (2016 - 2018) TLGS phase, 10,092 adults aged ≥ 20 years were initially selected, and 122 were excluded due to missing data. All procedures performed in studies involving human participants followed the ethical standards of the Human Research Review Committee of the Endocrine Research Center, Shahid Beheshti University, Tehran, Iran, and the 1964 Helsinki declaration and its later amendments, with approval from the National Research Council of the Islamic Republic of Iran (No. 121).
3.2. Clinical and Laboratory Measurements
Data on age, gender, medical history, medication (antihypertensive, lipid-lowering, and antidiabetic agents), and smoking status were collected by trained interviewers using a pretested questionnaire. The protocol for the CVD outcome data collection has been described in detail elsewhere (12). Height was measured barefoot using a stadiometer. Waist circumference (WC) was measured at the level of umbilicus with minimal clothing, using a tape with an accuracy of 1 mm. Weight was measured using digital scales and recorded to the nearest 100 g. Two measurements of systolic and diastolic blood pressures were done from the right arms of participants after 15 minutes of resting in the supine position. The laboratory methods of TLGS have been described in detail elsewhere (11). Laboratory measurements were done at the TLGS research laboratory on the same day of sampling. Plasma Cr concentrations were assessed by the standard colorimetric Jaffe_Kinetic reaction method (Pars Azmon Inc., Iran; with intra- and inter-assay coefficients of variation of 2.5% and 1.9%, respectively, and sensitivity of 0.2 mg/dL). The assay range was between 18 and 1330 μmol/L (0.2 - 15 mg/dL). The reference intervals according to the manufacturer’s recommendations were 80 - 115 μmol (0.9 - 1.3 mg/dL) and 53 - 97 μmol (0.6 - 1.1 mg/dL) in men and women, respectively.
3.3. Definitions
We calculated the estimated GFR (eGFR) in ml/min/1.73 m2 using the four-variable MDRD equation (13) and the CKD-EPI equation (7), as follows:
in which k is 0.7 for females and 0.9 for males, α is -0.329 for females and -0.411 for males, min indicates the minimum of serum Cr/k or 1, and max indicates the maximum of serum Cr/k or 1.
Besides, CKD was defined as eGFR < 60 mL/min/1.73 m2 according to each equation. The body mass index (BMI) was classified into three categories of < 25, 25 - 29.9, and ≥ 30 kg/m2. Diabetes mellitus (DM) was defined based on the 2016 guideline of the American Diabetes Association as fasting plasma glucose ≥ 126 mg/dL, 2-h post-challenge plasma glucose ≥ 200 mg/dL, or the use of any anti-hyperglycemic medications (14). Hypertension was defined as blood pressure of ≥ 140/90 mmHg, a self-reported history of hypertension, or usage of anti-hypertensive agents (15). Dyslipidemia was defined as serum triglyceride of ≥ 200 mg/dL, TC of ≥ 240 mg/dL, or taking any lipid-lowering medications (16). Regarding smoking status, participants were placed into two groups of 1) current smokers, referring to those with a daily or occasional use of any tobacco products at the time of examination, and 2) non-smokers, including quitters and those who have never smoked. Moreover, CVD was defined as any coronary heart disease (CHD) or stroke (a new neurological deficit that lasted ≥ 24 h), where CHD was regarded as present if cases had definite myocardial infarction according to diagnostic electrocardiographic results and biomarkers; probable myocardial infarction, positive electrocardiographic findings plus cardiac symptoms or signs plus missing biomarkers or positive electrocardiographic findings plus equivocal biomarkers; or proven CHD by angiography. The 10-year risk of atherosclerotic cardiovascular disease (ASCVD) was defined according to the guidelines of the American College of Cardiology/American Heart Association and estimated in subjects aged 40 to 79 years (17).
3.4. Statistical Methods
Continuous variables, all with normal distribution, were expressed as mean ± standard deviation (SD), and categorical variables were expressed as percentages. To reduce selection bias, the prevalence of CKD was weighted directly to the characteristics of the urban population of Tehran (18) based on the 2016 national Iranian census. For this, a propensity score, the estimated probability of a participant being followed in the study, was computed for each participant using maximum likelihood logistic regression analysis based on all baseline measures including age, sex, education level, systolic and diastolic blood pressure, FPG, TG, HDL, WC, BMI, intervention, family history of diabetes, and CVD as exposures in a logistic model, with participation in the follow-up as the outcome. The characteristics of the study participants were compared between those with and without CKD, using Student’s t-test or chi-square test for continuous and categorical variables, respectively. All the participants were then categorized into four subgroups of CKD, according to each, both, or neither of the MDRD and the CKD-EPI equations, using the 2 × 2 cross-tabulation. Comparisons across the subgroups were performed using the one-way analysis of variance with the post hoc Bonferroni multiple-comparison test for continuous variables. The chi-square tests were used for the comparison of categorical variables. Multivariate logistic regression models, expressed as odds ratios (OR) and 95% confidence intervals (CIs), were used to explore the association of clinical characteristics with CKDMDRD and CKDCKD-EPI, separately. SPSS software version 22.0 (SPSS Inc., Chicago, IL, USA) was used to conduct the analysis. A two-tailed p-value of ≤ 0.05 was considered significant in conjunction with all statistical tests.
4. Results
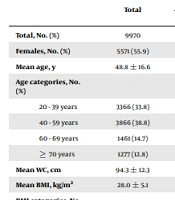
A total of 9,970 participants were enrolled in this study, of whom 4,399 (44.1%) were males. The mean age was 48.8 ± 16.6 years. The mean serum creatinine was 1.1 ± 0.2 mg/dl. The mean eGFRMDRD and eGFRCKD-EPI values were 76.3 ± 13.8 and 80.5 ± 16.1 mL/min/1.73 m2, respectively. The weighted prevalence (95% CI) of CKDMDRD and CKDCKD-EPI was 11.0% (10.3 - 11.6) and 9.7% (9.1 - 10.2), respectively. The prevalence of DM, hypertension, and dyslipidemia was 18.4%, 26.7%, and 47.0%, respectively; and CVD was detected in 711 (7.1%) of the total study population. The mean ACC/AHA 10-year ASCVD risk score among participants aged 40 - 79 years was 5.4 ± 7.3.
Table 1 shows the eGFR classification of study participants based on the MDRD and CKD-EPI equations. From the classification of the MDRD equation, 830 (8.3%) subjects were reclassified into a higher eGFR category and 182 (1.8%) subjects into a lower eGFR category by the CKD-EPI equation; 152 (1.5%) of the study participants had CKDCKD-EPI but not CKDMDRD, and 347 (3.5%) had CKDMDRD but not CKDCKD-EPI.
| MDRD eGFR, mL/min/1.73 m2 | CKD-EPI eGFR, mL/min/1.73 m2 | Total | |||
|---|---|---|---|---|---|
| < 30 | 30 - 59 | 60 - 89 | ≥ 90 | ||
| < 30 | 29 (0.3) | 0 (0) | 0 (0) | 0 (0) | 29 (0.3) |
| 30 - 59 | 26 (0.3) | 2,268 (22.7) | 347 (3.5) | 0 (0) | 2,641 (26.5) |
| 60 - 89 | 0 (0) | 152 (1.5) | 6,340 (63.6) | 483 (4.8) | 6,975 (70.0) |
| ≥ 90 | 0 (0) | 0 (0) | 5 (0) | 320 (3.2) | 325 (3.3) |
| Total | 55 (0.5) | 2,420 (24.3) | 6,692 (67.1) | 803 (8.0) | 9,970 (100.0) |
Abbreviations: eGFR, estimated glomerular filtration rate; MDRD, modification of diet in renal disease; CKD-EPI, chronic kidney disease epidemiology collaboration.
aValues are presented as No. (%).
In bivariate analysis, older age, female gender, higher WC and BMI, having DM, hypertension, dyslipidemia, and CVD, and not being currently a smoker were significantly associated with CKD according to both equations. Besides, CVD associated with CKD was 16.3% and 18.6% using the MDRD and CKD-EPI equations, respectively. Among participants aged 40 to 79 years, subjects with CKD, according to both equations, had significantly higher mean ACC/AHA 10-year ASCVD risk scores than those without CKD (Table 2).
| Total | eGFRMDRD, mL/min/1.73 m2 | P Value | eGFRCKD-EPI, mL/min/1.73 m2 | P Value | |||
|---|---|---|---|---|---|---|---|
| Non-CKD | CKD | Non-CKD | CKD | ||||
| Total, No. (%) | 9970 | 7300 (73.2) | 2670 (26.8) | < 0.001 | 7495 (75.2) | 2475 (24.8) | < 0.001 |
| Females, No. (%) | 5571 (55.9) | 3711 (50.8) | 1860 (69.7) | < 0.001 | 3995 (53.3) | 1576 (63.7) | < 0.001 |
| Mean age, y | 48.8 ± 16.6 | 43.8 ± 14.7 | 62.6 ± 13.4 | <0.001 | 43.2 ± 13.8 | 65.9 ± 11.9 | < 0.001 |
| Age categories, No. (%) | <0.001 | < 0.001 | |||||
| 20 - 39 years | 3366 (33.8) | 3227 (44.2) | 139 (5.2) | 3325 (44.4) | 41 (1.7) | ||
| 40 - 59 years | 3866 (38.8) | 3020 (41.4) | 846 (31.7) | 3180 (42.4) | 686 (27.7) | ||
| 60 - 69 years | 1461 (14.7) | 624 (8.5) | 837 (31.3) | 695 (9.3) | 766 (30.9) | ||
| ≥ 70 years | 1277 (12.8) | 429 (5.9) | 848 (31.8) | 295 (3.9) | 982 (39.7) | ||
| Mean WC, cm | 94.3 ± 12.3 | 93.1 ± 12.3 | 98.0 ± 11.2 | < 0.001 | 93.1 ± 12.3 | 98.4 ± 11.0 | < 0.001 |
| Mean BMI, kg/m2 | 28.0 ± 5.1 | 27.5 ± 5.0 | 29.3 ± 5.0 | < 0.001 | 27.6 ± 5.0 | 29.1 ± 4.9 | < 0.001 |
| BMI categories, No. (%) | < 0.001 | < 0.001 | |||||
| < 25 kg/m2 | 2740 (28.6) | 2301 (32.4) | 439 (17.9) | 2321 (31.7) | 419 (18.7) | ||
| 25 - 29.9 kg/m2 | 3920 (41.0) | 2878 (40.5) | 1042 (42.5) | 2965 (40.5) | 955 (42.6) | ||
| ≥ 30 kg/m2 | 2906 (30.4) | 1933 (27.2) | 973 (39.6) | 2040 (27.8) | 866 (38.7) | ||
| DM, No. (%) | 1587 (18.4) | 834 (13.2) | 753 (32.9) | < 0.001 | 831 (12.7) | 756 (36.0) | < 0.001 |
| Hypertension, No. (%) | 2644 (26.7) | 1327 (18.3) | 1317 (49.6) | < 0.001 | 1308 (17.6) | 1336 (54.3) | < 0.001 |
| Dyslipidemia, No. (%) | 4677 (47.0) | 3068 (42.1) | 1609 (60.4) | < 0.001 | 3136 (41.9) | 1541 (62.5) | < 0.001 |
| Currently smoking, No. (%) | 1282 (13.0) | 1123 (15.5) | 159 (6.0) | < 0.001 | 1133 (15.2) | 149 (6.1) | < 0.001 |
| CVD, No. (%) | 711 (7.1) | 276 (3.8) | 435 (16.3) | < 0.001 | 250 (3.3) | 461 (18.6) | < 0.001 |
| 10-year ASCVD risk, % | 5.4 ± 7.3 | 4.2 ± 5.9 | 7.7 ± 9.0 | < 0.001 | 3.7 ± 5.2 | 8.9 ± 9.5 | < 0.001 |
| Serum Cr, mg/dL | 1.10 ± 0.22 | 1.05 ± 0.15 | 1.25 ± 0.31 | < 0.001 | 1.05 ± 0.15 | 1.26 ± 0.32 | < 0.001 |
| Mean MDRD eGFR | 67.03 12.25 | 72.35 ± 9.01 | 52.49 ± 7.04 | < 0.001 | 71.92 ± 9.26 | 52.24 ± 7.35 | < 0.001 |
| Mean CKD-EPI eGFR | 69.65 14.75 | 76.07 ± 10.87 | 52.10 ± 8.32 | < 0.001 | 75.77 ± 10.85 | 51.11 ± 7.92 | < 0.001 |
Abbreviations: eGFR, estimated glomerular filtration rate; MDRD, modification of diet in renal disease; CKD-EPI, chronic kidney disease epidemiology collaboration; BMI, body mass index; WC, waist circumference; DM, diabetes mellitus; CVD, cardiovascular disease; ASCVD, atherosclerotic cardiovascular disease; Cr, creatinine.
According to Table 3, participants with CKDCKD-EPI but without CKDMDRD tended to be male and older, and more frequently had diabetes, hypertension, dyslipidemia, and CVD when compared to those without CKD based on either equation; and were more likely to be male, older, and current smokers and have more CVD but less dyslipidemia when compared to those with CKDMDRD and CKDCKD-EPI. On the other side, 347 (3.5%) subjects with CKDMDRD but without CKDCKD-EPI were more likely to be female and younger and had a lower prevalence of diabetes, hypertension, dyslipidemia, and CVD when compared to those with CKD according to both equations, and more likely to be female and current smokers when compared to those without CKD based on either equation. Participants with CKDCKD-EPI but without CKDMDRD and those with CKDMDRD but without CKDCKD-EPI presented the highest and the lowest 10-year ASCVD risks across the study subgroups, respectively.
| Variables | CKDCKD-EPI and CKDMDRD | Non-CKDCKD-EPI and non-CKDMDRD | Non-CKDCKD-EPI and CKDMDRD | CKDCKD-EPI and non-CKDMDRD |
|---|---|---|---|---|
| No. (%) | 2323 (23.3) | 7148 (71.7) | 347 (3.5) | 152 (1.5) |
| Females | 67.3 | 51.7 | 85.6 b, c | 8.6 b,c |
| Age, y | 65.2 ± 11.8 | 43.1 ± 14.0 | 44.8 ± 9.5 b | 77.0 ± 8.1 b,c |
| Age categories | ||||
| 20 - 39 years | 1.8 | 45.1 | 28.2 b,c | 0.0 b,c |
| 40 - 59 years | 28.8 | 42.0 | 51.3 b,c | 11.8 b,c |
| 60 - 69 years | 33.0 | 8.7 | 20.5 b,c | 0.0 b,c |
| ≥ 70 years | 36.5 | 4.1 | 0.0 b,c | 88.2 b,c |
| BMI, kg/m2 | 29.3 ± 4.9 | 27.5 ± 5.0 | 29.3 ± 5.1 c | 26.5 ± 4.1 b |
| WC, cm | 98.6 ± 11.0 | 93.0 ± 12.4 | 94.6 ± 11.6 b | 96.0 ± 10.4 c |
| DM | 36.0 | 12.7 | 12.9 b | 36.1 c |
| Hypertension | 54.1 | 17.4 | 19.9 b | 57.9 c |
| Dyslipidemia | 63.2 | 41.9 | 42.4 b | 52.0 b,c |
| Currently smoking | 5.7 | 15.6 | 8.1 b,c | 12.1 b,c |
| CVD | 18.2 | 3.3 | 3.7 a | 25.7 b,c |
| 10-year ASCVD risk score | 8.4 ± 9.2 | 3.9 ± 5.3 | 1.6 ± 2.2 b,c | 18.9 ± 10.0 b,c |
| Serum Cr, mg/dL | 1.3 ± 0.3 | 1.0 ± 0.1 | 1.1 ± 0.1 b | 1.2 ± 0.1 b,c |
| Mean eGFRMDRD | 51.6 ± 7.1 | 72.6 ± 9.0 | 58.5 ± 1.1 b | 62.2 ± 1.3 b,c |
| Mean eGFRCKD-EPI | 50.7 ± 8.0 | 76.5 ± 10.6 | 61.7 ± 1.4 b | 57.8 ± 1.8 b,c |
Abbreviations: eGFR, estimated glomerular filtration rate; MDRD, modification of diet in renal disease; CKD-EPI, chronic kidney disease epidemiology collaboration; BMI, body mass index; WC, waist circumference; DM, diabetes mellitus; CVD, cardiovascular disease; Cr, creatinine; ASCVD, atherosclerotic cardiovascular disease.
aValues are expressed as percentages or mean ± SD.
b Significantly different compared to CKDCKD-EPI and CKDMDRD.
c Significantly different compared to non-CKDCKD-EPI and non-CKDMDRD.
In multivariate logistic regression analysis, ORs of CKDMDRD and CKDCKD-EPI were statistically significant for older age, female gender, higher BMI, hypertension, dyslipidemia, and CVD. Older age and female gender were the only factors with significantly different odds between the MDRD and CKD-EPI equations (Table 4).
| Variables | CKDMDRD, Odds Ratio (95% CI) | CKDCKD-EPI, Odds Ratio (95% CI) |
|---|---|---|
| Gender | ||
| Male | Reference | Reference |
| Female | 3.1 (2.7 - 3.6) | 2.2 (1.9 - 2.5) |
| Age | ||
| 20 - 39 years | Reference | Reference |
| 40 - 59 years | 5.3 (4.3 - 6.6) | 14.3 (10.1 - 20.4) |
| 60 - 69 years | 25.0 (19.8 - 31.5) | 65.2 (45.2 - 93.9) |
| ≥ 70 years | 37.2 (28.8 - 48.2) | 193.4 (131.4 - 284.8) |
| BMI | ||
| < 25 kg/m2 | Reference | Reference |
| 25 - 29.9 kg/m2 | 1.3 (1.1 - 1.6) | 1.3 (1.1 - 1.5) |
| ≥ 30 kg/m2 | 1.3 (1.1 - 1.6) | 1.2 (1.0 - 1.5) |
| DM | 1.0 (0.9 - 1.2) | 1.1 (0.9 - 1.3) |
| Hypertension | 1.3 (1.1 - 1.5) | 1.4 (1.2 - 1.6) |
| Dyslipidemia | 1.3 (1.1 - 1.4) | 1.3 (1.1 - 1.5) |
| Currently smoking | 0.9 (0.7 - 1.4) | 0.8 (0.6 - 1.0) |
| CVD | 1.4 (1.2 - 1.8) | 1.4 (1.1 - 1.7) |
Abbreviations: CI, confidence interval; CVD, cardiovascular disease; MDRD, modification of diet in renal disease; CKD-EPI, chronic kidney disease epidemiology collaboration; BMI, body mass index; DM, diabetes mellitus.
5. Discussion
The primary findings of this study were that among the general Tehranian adult population, older individuals, males, and those with higher rates of CVD and cardiovascular risk factors were more frequently classified to have CKD based on the CKD-EPI equation compared to the MDRD equation. These findings were in line with those observed in a multi-ethnic meta-analysis of populations from America, Europe, and Eastern Asia. In the mentioned studies, subjects reclassified to non-CKDCKD-EPI were younger, more likely to be female, and had lower rates of DM and hypertension, while subjects who were reclassified to CKDCKD-EPI were much older as compared to those who remained in the same eGFR categories according to both equations. Moreover, the reclassification of individuals to CKDCKD-EPI categories from the MDRD equation provided a more accurate prediction of cardiovascular mortality, even after adjustment for multiple potential confounders (9).
While CVD is preventable and treatable in patients with CKD, these patients are more likely to die from CVD than to develop ESRD (19). Both CVD and CKD have become important health problems in Iran, associated with alarming decreases in longevity and quality of life over the previous decades (20, 21). In 2015, Iran was among the countries with the greatest burden of CVD in the world, with an overall prevalence of 9% and one million DALYs, accounting for 46% of all deaths (21). Likewise, in 2017, the prevalence of CKD was estimated to be 8.6% and 5.8% among Iranian males and females, respectively, which were higher than the global averages (22). Together, these data imply the importance of identifying CKD patients and appropriate allocation of health-care resources.
In this study, we observed that the CKD-EPI equation categorized participants more appropriately respecting their 10-year risk of developing ASCVD events than did the MDRD equation. In Italy, using the UK Prospective Diabetes Study 10-year CHD risk score among patients with type 2 DM and without a previous CVD event, subjects with CKDCKD-EPI had significantly higher 10-year CHD risks when compared to those with CKD by only the MDRD and both of the equations (23). Likewise, in a general Korean population with a rather high average eGFR of 96.8 ml/min/1.73 m2, with only 2.6% of the participants having CKD, reclassification by the CKD-EPI equation improved the 10-year Framingham CVD risk prediction in all GFR categories (24).
The presence of CKD is associated with the increased risk of CVD in community-based populations with and without preexisting CVD. Moreover, the level of kidney function is now recognized as an independent risk factor for the development of non-fatal and fatal CVD events in the general population (25-27). The increased risk of CVD in patients with CKD is not only due to the high prevalence of traditional risk factors, including obesity, DM, and hypertension but also independently because of atherogenic lipid profile and low-grade inflammation, attributed to excessive oxidative stress and accumulation of toxins due to impaired kidney function; moreover, increased activity of the renin-angiotensin system, and decreased bioavailability of nitric oxide, which suggests a possible mechanism for coronary endothelial dysfunction in early stages of CKD (28).
We demonstrated by multivariate logistic analysis that the better performance of the CKD-EPI equation was independently and substantially caused by the reclassification of older individuals and fewer females into CKDCKD-EPI. The GFR decreases with aging, and decreased GFR is an independent risk factor for CVD morbidity and mortality in older adults (29). In addition, in the general population, the female gender is associated with a lower cardiovascular risk across all GFR levels (30, 31). Hence, this finding would be another endorsement of the superior performance of CKD-EPI over the MDRD equation. Similarly, in a representative sample of 11,247 Australians, the reclassification of subjects with CKDMDRD into the category of non-CKDCKD-EPI was associated with a significant improvement in 10-year Framingham CVD risk score, only for those aged over 65 years, but with no improvement in younger age groups (32). In a study of 9,308 adults aged ≥ 50 years, 0% and 77.7% of their population reclassified to CKDCKD-EPI were aged 50 - 64 and ≥ 75 years, respectively, while these rates were 76.7% and 1.8%, respectively, among those who were reclassified to non-CKDCKD-EPI. Subjects reclassified to non-CKDCKD-EPI and CKDCKD-EPI from the MDRD categories had respectively lower and higher 10-year Framingham CVD risk scores when compared to those who were not reclassified (33). In a 16.9-year cohort of 131,905 U.S. adults aged 45 to 64 years, the better performance of the CKD-EPI equation over the MDRD equation for the prediction of CHD, stroke, and all-cause mortality was explained by more frequent classification of younger participants and females to higher CKD-EPI eGFR categories (34).
The present study is the first of its kind that provides evidence on the superiority of the CKD-EPI equation over the MDRD equation for the detection of cardiovascular risk in a large Middle Eastern population. However, several limitations should be noted. First, we calculated eGFR based on single-time Cr measurement and could not validate it as persistent CKD. Second, we used the traditional MDRD equation because the serum Cr assay was not traceable to isotope dilution mass spectroscopy. Third, since we included participants from the 2016 - 2018 TLGS survey, the representativeness of the data was a major concern; accordingly, we weighted our population characteristics to the 2016 Tehranian urban population. Finally, due to the cross-sectional design of the study, it was impossible to infer a causal relationship between eGFR decline and cardiovascular events.
5.1. Conclusions
As in other ethnicities, in a large sample of the general Tehranian adult population, the CKD-EPI equation provided more appropriate detection of cardiovascular risk than did the MDRD equation, which is caused by the reclassification of older individuals and fewer females into lower eGFR categories. Our findings imply the potential benefits of replacing MDRD with the CKD-EPI equation in clinical and public health practice across the Middle Eastern countries.
