


1. Background
Chronic kidney disease (CKD) is an increasing global public health problem, defined as an increased urinary albumin excretion or reduced glomerular filtration rate (GFR) for three or more months (1). The incidence and prevalence of CKD are increasing rapidly worldwide, particularly in developing countries (2). The prevalence of CKD in Iran was estimated at 15.14% (3). In all developed and many developing countries, diabetes and hypertension appear to be major causes of CKD (1). According to the CDC in 2019, CKD occurs in over 26% of patients with high blood pressure (4). Among the many lifestyle risk factors, diet appears to have an important role in the incidence and progression of CKD (5). Traditional nutritional epidemiology has focused on investigating the association of a single food or nutrient with the risk of disease. However, dietary patterns may better represent the association between diet and diseases by considering the interaction or additive effects of dietary components (6).
Recently, several studies have been conducted on the relationship between dietary patterns and kidney function (5, 7-12). Previous studies indicated that adherence to the Western dietary pattern was associated with an increased risk of CKD (7-10). On the other hand, a meta-analysis of cohort studies and some previous studies have demonstrated that the healthy dietary pattern may have a protective role in the occurrence of CKD (8, 9, 11, 12). Despite the high incidence of CKD in Iranian populations, most of the previous studies have been done in East Asia (9, 11), Europe (10), and the USA (7, 12). Furthermore, to the best of our knowledge, most research to investigate the association between the dietary pattern and renal dysfunction has been conducted in healthy populations (7-10, 12) or diabetics (11) and there is a lack of data on patients with high blood pressure.
2. Objectives
The present study aimed to examine the association between dietary patterns and the incidence of CKD in adults with high blood pressure in a 3.6-year follow-up.
3. Methods
3.1. Study Population
This cross-sectional study was conducted within the framework of the Tehran Lipid and Glucose Study (TLGS), an ongoing community-based prospective investigation. The details of the TLGS were mentioned in previous studies (13). In the fourth examination survey of the TLGS, of 12,523 participants who had complete data on their medical histories and underwent physical examinations, we randomly selected a representative sample of 7,956 participants for dietary assessment. In the current study, 7,199 participants aged ≥ 27 years were selected and followed for 3.6 years. Participants without any data on covariates (n = 841), those with over- or under-reporting in dietary data (daily energy intake outside the range of 800 - 4200 kcal/day) (n = 1,429), those with a history of cancer or CVD (n = 109), those on a specific diet (n = 557), those with CKD (n = 946) at baseline, and pregnant and lactating women (n = 73) were excluded from the study. Eventually, among the remaining participants, we selected subjects with systolic blood pressure (SBP) ≥ 120, diastolic blood pressure (DBP) ≥ 80, or the current use of antihypertensive drugs for the final analysis (n = 1,521).
The protocol of the study was approved by the Ethics Committee of the Research Institute for Endocrine Sciences (RIES), Shahid Beheshti University of Medical Sciences. All study participants provided written informed consent.
3.2. Dietary Intake Assessment
A valid and reliable semi-quantitative Food Frequency Questionnaire (FFQ) with 147 food items was used to collect dietary data (14). The interviewer asked participants to designate their consumption frequency of each food item during the past year on a daily, weekly, or monthly basis. Portion sizes of consumed foods that were reported in household measures were then converted to grams. To identify the dietary patterns, food items of the FFQ were classified into 24 food groups according to the nutrient profiles and culinary usage (6).
3.3. Clinical and Biological Measurements
Data on demographics, smoking status, medical history, and medication use of the participants were collected through interviews held by skilled interviewers and using pretested questionnaires. Physical activity levels were estimated by using the Modifiable Activity Questionnaire (MAQ), which had been previously modified and validated among Iranians (15). Then, the metabolic equivalent task (MET) minutes per week was calculated for all subjects. Physical activity was classified into three levels: light (MET < 600 min/week), moderate (600 ≤ MET < 1200 min/week), and vigorous (MET ≥ 1,200 min/week).
Anthropometric parameters, including weight and height, were measured and body mass index (BMI) was calculated. Diastolic blood pressure (DBP) and systolic blood pressure (SBP) were measured twice from the right arm in a sitting position, after a 15-minute rest; the average of both blood pressure measurements was considered as the participants’ blood pressure. An enzymatic colorimetric method was used to measure fasting plasma glucose (FPG), triglycerides (TG), and total cholesterol (TC) concentrations. After the precipitation of apolipoprotein-β with phosphotungstic acid, high-density lipoprotein (HDL) was measured. Low-density lipoprotein cholesterol (LDL-C) was calculated using the Friedewald formula. Serum creatinine (Cr) was measured following the standard colorimetric Jaffe Kinetic reaction method.
3.4. Definitions
The SBP/DBP 120 - 139/80 - 89 mmHg was considered as prehypertension and SBP/DBP ≥ 140/90 mmHg was considered as hypertension. Patients with prehypertension, hypertension, or the current use of antihypertensive medications were considered as subjects with high blood pressure (16).
The modified diet in renal disease (MDRD) equation was used to express eGFR in mL/min/1.73 m2 of body surface area (17). The abbreviated MDRD study equation is defined as follows:
Based on the national kidney foundation guidelines, patients with eGFR ≥ 60 mL/min/1.73 m2 and eGFR < 60 mL/min/1.73 m2 were considered to be non-CKD and CKD individuals, respectively (18).
3.5. Statistical Analysis
Factor analysis/principal component analysis was applied to identify dietary patterns. The factors were orthogonally transformed by using Varimax rotation to obtain uncorrelated factors and improve interpretability. The scree plot and the interpretability of each factor were used to identify the number of principal factors or dietary patterns to be retained. Correlation coefficients between food groups and dietary patterns were represented by factor loadings. Food groups with factor loadings ≥ 0.3 were considered as important contributors to a dietary pattern. Dietary patterns were named based on food items with greater loadings on each of these dietary patterns. By summing the intakes of food groups weighted by his/her factor loading, each subject received a score for each identified pattern. Scores reflected how closely a participant’s diet was similar to each identified pattern.
All the statistical analyses were performed using SPSS version 15.0 (SPSS Inc., Chicago, IL, USA). Histogram charts and Kolmogorov-Smirnov test were used to examine the assumption of normality of all parameters and variables were log-transformed if they did not fit the assumption of normality. To compare demographic, lifestyle, and clinical characteristics across quartiles of different dietary pattern scores, one-way ANOVA, Kruskal-Wallis test, and chi-square test were used. Multivariable logistic regression analysis was applied to investigate the associations between dietary patterns and the incidence of CKD. The odds ratio (OR) and 95% confidence interval (CI) were reported. We calculated P values for trends across dietary patterns by assigning the medians of scores in quartiles and modeling them as continuous variables. A P value of < 0.05 was regarded as statistically significant.
4. Results
4.1. Study Participants and Dietary Patterns
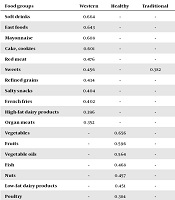
The results showed that CKD occurred in 255 (16.8%) of 1,521 subjects after 3.6 years of follow-up. Our sample consisted of 887 (58.3%) men and 634 (41.7%) women. The mean age of the study participants was 46.32 ± 11.59 years. A total of 157 (10.5%) participants had diabetes. Using factor analysis, three main dietary patterns were revealed. The components of these dietary patterns are shown in Table 1.
| Food groups | Western | Healthy | Traditional |
|---|---|---|---|
| Soft drinks | 0.664 | - | - |
| Fast foods | 0.643 | - | - |
| Mayonnaise | 0.608 | - | - |
| Cake, cookies | 0.601 | - | - |
| Red meat | 0.476 | - | - |
| Sweets | 0.456 | - | 0.382 |
| Refined grains | 0.434 | - | - |
| Salty snacks | 0.404 | - | - |
| French fries | 0.402 | - | - |
| High-fat dairy products | 0.396 | - | - |
| Organ meats | 0.352 | - | - |
| Vegetables | - | 0.656 | - |
| Fruits | - | 0.596 | - |
| Vegetable oils | - | 0.564 | - |
| Fish | - | 0.468 | - |
| Nuts | - | 0.457 | - |
| Low-fat dairy products | - | 0.451 | - |
| Poultry | - | 0.384 | - |
| Solid fat | 0.355 | -0.383 | 0.381 |
| Whole grains | - | - | 0.559 |
| Legumes | - | 0.323 | 0.505 |
| Potatoes | - | - | 0.466 |
| Eggs | 0.329 | - | 0.376 |
| Tea and coffee | - | - | 0.340 |
| Variance explained (%) | 13.64 | 9.41 | 7.22 |
Component Loadings for Major Dietary Patterns Identified by Factor Analysisa
4.2. Profile of Baseline Characteristics by Quartiles of Dietary Pattern Scores
Tables 2 and 3 show the baseline characteristics of the study participants based on the quartiles of each dietary pattern score. Participants who had a higher score on the Western dietary pattern were more likely to be men, smoker, and younger, and had a shorter duration of hypertension, higher diastolic blood pressure, lower use of lipid-lowering medication, and lower mean concentration of HDL cholesterol (Table 1). Participants with greater scores on the Healthy dietary pattern were more likely to be women and physically active and they had a higher education level (Table 2). Participants who had a higher score on the traditional Iranian dietary pattern tended to be men and older and had lower levels of education (Table 4).
| Western Dietary Pattern Scores | P Value | ||||
|---|---|---|---|---|---|
| Q1 (N = 379) | Q2 (N = 380) | Q3 (N = 380) | Q4 (N = 379) | ||
| Age (y) | 52.26 ± 11.41 | 47.43 ± 11.02 | 45.17 ± 10.13 | 40.45 ± 10.59 | < 0.001 |
| Male (%) | 20.9 | 22.4 | 25.6 | 31.1 | < 0.001 |
| Education ≥ 12 years (%) | 19.7 | 24.2 | 23.1 | 33.0 | < 0.001 |
| Smoking habits (%) | 13.5 | 23.8 | 28.1 | 34.6 | < 0.001 |
| Activity level (METs/wk) | 0.002 | ||||
| Light | 22.4 | 26.6 | 25.2 | 25.7 | |
| Moderate | 29.9 | 19.0 | 23.9 | 27.2 | |
| Vigorous | 34.4 | 21.1 | 25.4 | 19.1 | |
| Calorie intake (kcal/d) | 1984.48 ± 666.00 | 2257.79 ± 638.57 | 2501.92 ± 644.19 | 2808.67 ± 647.22 | < 0.001 |
| BMI (kg/m2) | 29.17 ± 4.62 | 29.32 ± 4.93 | 29.14 ± 4.68 | 28.48 ± 4.49 | 0.06 |
| Diabetes (%) | 43.9 | 22.9 | 23.6 | 9.6 | < 0.001 |
| Fasting glucose (mg/dL) | 96 (90 - 106) | 94 (89 - 102) | 96 (90 -102) | 94 (89 - 100) | 0.008 |
| SBP (mm Hg) | 127.08 ± 15.97 | 123.24 ± 12.48 | 123.76 ± 14.10 | 122.77 ± 13.48 | < 0.001 |
| DBP (mm Hg) | 83.54 ± 8.06 | 83.89 ± 7.82 | 84.82 ± 8.17 | 85.06 ± 8.48 | 0.02 |
| Duration of hypertension ≥ 10 years (%) | 29.5 | 26.5 | 22.4 | 21.6 | < 0.001 |
| Lipid-lowering medication use (%) | 45.6 | 22.8 | 20.3 | 11.4 | < 0.001 |
| Triglycerides (mg/dL) | 158.44 ± 88.80 | 164.66 ± 158.70 | 167.11 ± 99.76 | 161.13 ± 93.62 | 0.54 |
| Cholesterol (mg/dL) | 195.90 ± 36.09 | 197.20 ± 44.79 | 193.33 ± 34.99 | 190.32 ± 36.21 | 0.06 |
| HDL- cholesterol (mg/dL) | 46.81 ± 11.05 | 46.71 ± 11.23 | 45.11 ± 10.19 | 44.13 ± 9.88 | 0.001 |
| LDL- cholesterol (mg/dL) | 117.88 ± 30.79 | 118.86 ± 31.09 | 116.00 ± 30.22 | 114.39 ± 32.17 | 0.20 |
Baseline Characteristics of Adults with High Blood Pressure by Quartiles of Western Dietary Pattern Scoresa
| Traditional Dietary Pattern Scores | P Value | ||||
|---|---|---|---|---|---|
| Q1 (N = 379) | Q2 (N = 380) | Q3 (N = 380) | Q4 (N = 379) | ||
| Age (y) | 44.94 ± 11.97 | 45.33 ± 11.11 | 46.81 ± 11.63 | 48.2 ± 11.41 | < 0.001 |
| Male (%) | 22.9 | 23.2 | 26.5 | 27.4 | 0.004 |
| Education ≥ 12 years (%) | 27.5 | 27.5 | 25.5 | 19.5 | 0.03 |
| Smoking habits | 23.8 | 20.5 | 22.2 | 33.5 | 0.03 |
| Activity level (METs/wk) | 0.43 | ||||
| Light | 25.2 | 25.4 | 25.0 | 24.4 | |
| Moderate | 22.8 | 25.0 | 29.3 | 22.8 | |
| Vigorous | 25.4 | 23.0 | 21.5 | 30.1 | |
| Calorie intake (kcal/d) | 2008.97 ± 653.99 | 2182.10 ± 630.25 | 2481.85 ± 620.71 | 2879.98 ± 638.53 | < 0.001 |
| BMI (kg/m2) | 29.29 ± 4.81 | 28.99 ± 4.66 | 29.16 ±4.77 | 28.66 ± 4.49 | 0.27 |
| Diabetes (%) | 28.7 | 24.8 | 25.5 | 21.0 | 0.59 |
| Fasting glucose (mg/dL) | 96 (90 - 102) | 94 (89 - 101) | 96 (90-103) | 95 (90 - 102) | 0.10 |
| SBP (mmHg) | 123.8 ± 13.56 | 124.04 ± 13.82 | 124.97 ± 14.34 | 124.74 ± 14.83 | 0.25 |
| DBP (mmHg) | 83.80 ± 8.00 | 84.59 ± 8.29 | 84.81 ± 7.82 | 84.11 ± 8.48 | 0.31 |
| Duration of hypertension ≥ 10 years (%) | 26.0 | 24.0 | 24.4 | 25.6 | 0.54 |
| Lipid-lowering medication use (%) | 38.0 | 24.1 | 26.6 | 11.4 | 0.008 |
| Triglycerides (mg/dL) | 166.22 ± 104.94 | 161.59 ± 87.05 | 161.38 ± 92.24 | 162.17 ± 157.22 | 0.70 |
| Cholesterol (mg/dL) | 195.04 ± 36.81 | 192.50 ± 35.93 | 192.27 ± 35.10 | 196.94 ± 44.48 | 0.35 |
| HDL- cholesterol (mg/dL) | 46.18 ± 11.28 | 45.87 ± 10 .72 | 45.07 ± 10.33 | 45.63 ± 10.24 | 0.53 |
| LDL- cholesterol (mg/dL) | 116.24 ± 32.38 | 115.02 ± 30.84 | 116.22 ± 30.52 | 119.66 ± 30.55 | 0.20 |
Baseline Characteristics of Adults with High Blood Pressure by Quartiles of Traditional Iranian Dietary Pattern Scoresa
| Healthy Dietary Pattern Scores | P value | ||||
|---|---|---|---|---|---|
| Q1 (n = 379) | Q2 (n = 380) | Q3 (n = 380) | Q4 (n = 379) | ||
| Age (y) | 45.22 ± 10.84 | 46.84 ± 11.87 | 46.14 ± 11.83 | 47.09 ± 11.76 | 0.11 |
| Male (%) | 27.7 | 27.2 | 23.6 | 21.5 | < 0.001 |
| Education ≥ 12 years (%) | 19.2 | 22.3 | 29.1 | 29.4 | 0.001 |
| Smoking habits (%) | 24.3 | 26.5 | 25.4 | 23.8 | 0.95 |
| Activity level (METs/wk) | < 0.001 | ||||
| Light | 27.9 | 25.2 | 23.8 | 23.2 | |
| Moderate | 13.6 | 25.5 | 28.3 | 32.6 | |
| Vigorous | 19.1 | 23.4 | 29.2 | 28.2 | |
| Calorie intake (kcal/d) | 2069.83 ± 682.33 | 2250.44 ± 658.06 | 2509.08 ± 691.85 | 2723.48 ± 656.08 | < 0.001 |
| BMI (kg/m2) | 28.63 ± 4.64 | 29.08 ± 4.68 | 29.02 ± 4.86 | 29.37 ± 4.56 | 0.19 |
| Diabetes (%) | 23.6 | 26.8 | 25.5 | 24.2 | 0.93 |
| Fasting glucose (mg/dL) | 95 ( 89 - 102 ) | 97 (90 - 104) | 94 (89 - 102) | 94(89 - 101) | 0.03 |
| SBP (mmHg) | 123.86 ± 14.95 | 124.71 ± 14.28 | 123.66 ± 13.48 | 124.60 ± 13.89 | 0.63 |
| DBP (mmHg) | 84.57 ± 7.47 | 84.50 ± 8.83 | 83.81 ± 7.55 | 84.43 ± 8.68 | 0.55 |
| Duration of hypertension ≥ 10 years (%) | 23.1 | 24.9 | 23.5 | 28.5 | 0.3 |
| Lipid-lowering medication use (%) | 20.3 | 27.8 | 15.2 | 36.7 | 0.03 |
| Triglycerides (mg/dL) | 160.03 ± 82.28 | 163.35 ± 159.63 | 165.23 ± 96.22 | 162.74 ± 101.54 | 0.84 |
| Cholesterol (mg/dL) | 194.36 ± 37.60 | 194.61 ± 42.73 | 195.69 ± 38.15 | 192.08 ± 34.20 | 0.69 |
| HDL- cholesterol (mg/dL) | 45.54 ± 10.28 | 45.14 ± 10.30 | 45.72 ± 10.52 | 46.34 ± 11.46 | 0.47 |
| LDL- cholesterol (mg/dL) | 117.47 ± 32.09 | 117.40 ± 28.45 | 117.58 ± 32.84 | 114.63 ± 30 .85 | 0.51 |
Baseline Characteristics of Adults with High Blood Pressure by Quartiles of the Healthy Dietary Pattern Scores
4.3. Odds of CKD by Quartile of Dietary Pattern Scores
The ORs (95% CI) of CKD across each quartile of the scores of three dietary patterns are shown in Table 5. In the crude model, there was no association between the Western dietary pattern and the incidence of CKD. In the second model, after adjustment for age, sex, energy intake, education, physical activity and smoking, a significant increase was observed in the risk of CKD in the highest quartile of the Western dietary pattern score compared to the lowest one (OR: 1.77; 95% CI: 1.09 to 2.89). In the third model, after additional adjustment for baseline TGs, TC, lipid-lowering medication use, BMI, duration of hypertension, and diabetes, the subjects in the highest quartile of the Western pattern score had a two-fold increase in the odds of CKD incidence (OR: 2.12, 95% CI: 1.19 to 3.76). Moreover, there was a significantly increasing trend in the CKD risk across the quartiles of the Western dietary pattern score (P for the trend = 0.002). In the crude model and after multivariable adjustment, no association was observed between the healthy and traditional Iranian dietary patterns and the incidence of CKD.
| Dietary Patterna | Q1 | Q2 | Q3 | Q4 | P for Trend |
|---|---|---|---|---|---|
| Western | |||||
| Model 1 | 1.00 | 1.05 (1.51 - 0.72 ) | 0.91 (0.62 - 1.32) | 0.68 (0.46 - 1.01) | 0.10 |
| Model 2 | 1.00 | 1.55 (1.04 - 2.31) | 1.65 (1.08 - 2.53) | 1.77 (1.09 - 2.89) | 0.008 |
| Model 3 | 1.00 | 1.79 (1.13 - 2.85) | 2.09 (1.28 - 3.41) | 2.12 (1.19 - 3.76) | 0.002 |
| Healthy | |||||
| Model 1 | 1.00 | 0.87 (0.58 - 1.31) | 1.32 (0.90 - 1.93) | 1.39 (0.95 - 2.03) | 0.20 |
| Model 2 | 1.00 | 0.70 (0.45 - 1.08) | 1.04 (0.68 - 1.58) | 0.97 (0.63 - 1.50) | 0.70 |
| Model 3 | 1.00 | 0.79 (0.48 - 1.30) | 0.95 (0.58 - 1.55) | 1.10 ( 0.67 - 1.81) | 0.51 |
| Traditional | |||||
| Model 1 | 1.00 | 0.97 (0.66 - 1.43) | 0.99 (0.68 - 1.46) | 1.07 (0.73 - 1.57) | 0.70 |
| Model 2 | 1.00 | 0.97 (0.64 - 1.45) | 0.90 (0.59 - 1.37) | 0.89 (0.56 - 1.39) | 0.57 |
| Model 3 | 1.00 | 0.90 (0.57 - 1.43) | 0.94 (0.59 - 1.50) | 0.75 (0.45 - 1.25) | 0.33 |
Odds Ratios and 95% Confidence Intervals of Chronic Kidney Disease by Quartiles of Dietary Pattern Scores
5. Discussion
This cross-sectional study revealed that the western dietary pattern, characterized by higher intake of soft drinks, fast food, mayonnaise, cakes, cookies, red meat, sweets, refined grains, salty snacks, French fries, high-fat dairy products, and organ meats, was associated with the increased risk of CKD after adjustment for multiple co-variants in adults with high blood pressure in Iran. In agreement with our findings, several studies have also reported a significant association between adherence to the Western dietary pattern and the risk of kidney function decline (5, 7-10). In the TLGS, the high fat, high sugar dietary pattern was associated with a 49% increased odds of the incidence of CKD after 6.1 years of follow-up (8). In the Nurses’ Health Study (NHS), a prospective observational cohort study of over 3,000 women, adherence to the Western dietary pattern was associated with the significantly increased odds of microalbuminuria and a rapid eGFR decrease during an 11-year follow-up (7). However, two cross-sectional studies showed inconsistent results regarding the impacts of the high-fat dietary pattern on kidney function (11, 12). The Western dietary pattern with high contents of animal proteins, fats, and cereal grains, but low content of fruits and vegetables, leads to high inflammation (19), high dietary acid load (20), and high advanced glycation end-products (21). That is a potential mediator between the Western dietary pattern and renal function decline. Furthermore, sugar-sweetened carbonated soft drinks (SSSDs), a major contributor to the Western dietary pattern, are sweetened with high fructose corn syrup that leads to hyperuricemia, which is considered to play a causal role in fructose-induced renal dysfunction (22).
In this study, the healthy dietary pattern, characterized by a high intake of vegetables, fruits, vegetable oils, fish, nuts, low-fat dairy products, and poultry, was not significantly associated with the risk of CKD in subjects with high blood pressure. Similar to our study, the NHS indicated no significant association between the healthy dietary pattern and microalbuminuria or eGFR decline. In contrast to the above findings, other studies including TLGS (8) and those conducted in the USA (7, 12), China (9) and Taiwan (11) reported the protective effects of the healthy dietary pattern on kidney function. Our healthy dietary pattern shares several characteristics with Mediterranean and DASH style diets. Recent studies conducted in general populations support the notion that adherence to the Mediterranean and DASH dietary patterns can improve kidney function (23-25). Regarding the lack of the association between the healthy dietary pattern and the incidence of CKD in subjects with high blood pressure, some explanations exist, as follows. The short follow-up duration of our study (3.6 years) may have prevented the putative effect of this dietary pattern. Also, it is possible that in subjects with high blood pressure, other renal risk factors like proteinuria could be more effective (19). Furthermore, the different components of our healthy dietary pattern with those of other studies may explain this inconsistency. In our study, whole grains and legumes were the main contributors to the traditional dietary pattern, whereas, in some previous studies, they were the components of the healthy dietary pattern. It may have diminished the possible protective effects of the healthy dietary pattern because current evidence indicates that higher intakes of whole grains and legumes are associated with the reduced incidence of CKD (26). Finally, the Mediterranean or DASH diet may better reflect food groups that are highly related to the CKD risk.
In this study, no significant association was found between the traditional Iranian dietary pattern characterized by high intakes of whole grains, legumes, potatoes, eggs, tea, and coffee, and the incidence of CKD. In accordance with our findings, Asghari et al. also did not find any significant association between the Iranian traditional dietary pattern and the incidence of CKD. However, their food items and their contributions to the traditional dietary pattern were different from ours (8). Previous studies indicated that Iranian dietary patterns mainly consisted of refined grain, tea, red meat, egg, potato, hydrogenated fat, and sugar (27, 28). Thus, the dietary pattern identified in our study was not a good representative of the traditional dietary pattern of the Iranian population.
Some strengths of the current study deserve to be mentioned. First, to our knowledge, this is the first population-based cohort study investigating the association between the dietary patterns and the incidence of CKD in subjects with high blood pressure. Second, the availability of detailed information on substantial numbers of covariates facilitated controlling for a wide range of relevant confounders. Third, the use of a valid and reliable FFQ to assess regular dietary intakes was another strength of our study.
This study also has some limitations. First, the collected data of dietary intake were self-reported. Since the FFQ was administered once at baseline, there was the probability of misclassification although it has been shown that most individuals’ dietary patterns are relatively stable over time (14). Second, as in most epidemiologic studies, to define chronic kidney diseases, creatinine measurements were conducted only once and were not repeated within three months to confirm a chronic reduction in GFR. Third, patients with CKD stage 1 (CKD 1) that have a normal GFR were not excluded from our study. Fourth, despite adjusting for the confounding effects of various variables in our analysis, the presence of other confounders is also possible, such as household income, occupation status, albuminuria/proteinuria, consumption of food additives and dietary supplements, fluid intakes, hemoglobin A1c, weight change, and the use of medications affecting kidney function.
5.1. Conclusions
In conclusion, the Western dietary pattern was associated with an increased risk of CKD in adults with high blood pressure. Therefore, targeting dietary behavior might be a beneficial strategy for the prevention of CKD in subjects with high blood pressure. However, these findings need to be confirmed by further cohort studies with larger sample sizes and longer duration or randomized controlled trials.
