


1. Background
The traffic and speed cameras and count stations near the roads are some technologies developed to manage, control, and predict traffic status in different countries. These devices produce massive datasets hourly and daily, making them one of the primary resources for discovering patterns and relationships. For example, there are diverse indices, including the count of driving offenses and total vehicles based on their type, which could be considered (1, 2). According to the global status report on road safety by the World Health Organization, driving accidents and risky driving are among the remarkable causes of death worldwide (2).
This study investigated the hourly and spatial patterns of driving offenses using two advanced statistical methods, respectively. Firstly, the generalized additive model (GAM) extended the generalized linear model (GLM) idea by adding the smoothing functions, such as cubic regression splines for estimating, hypothesis testing, and confidence interval for coefficients. The GAM was enhanced to capture complex and nonlinear relationships between response variables and covariates (3-5). Secondly, the stochastic partial differential equation (SPDE) method is one of the techniques to study spatial variability with the integrated nested Laplace approximation (R-INLA) (6).
2. Objectives
The traffic offenses dataset from count stations is a source for studying driving behaviors in Iran. The speeding and unsafe-distance indices are the indicators of risky driving for the control and prevention for which governments worldwide have different laws (2). Firstly, this study estimated the hourly average of each traffic offense per count station national-wide and province-wise. It shows how many traffic offenses occurred on average in each count station hourly. Secondly, the correlations and bivariate distribution between speeding and unsafe distance province-wise offenses were evaluated by Pearson’s and Spearman’s correlation coefficients and bivariate normal test based on the energy statistics, respectively. Thirdly, this study modeled the nonlinear relationship between the number of traffic offenses and the time of a day for each province with GAMs separately. Finally, this study introduced the percentage of traffic offenses among all transported vehicles as a key index to study the risky behavior of drivers on roads and investigated their spatial variability with SPDE. Moreover, temporal variability for four different ranges of hours was evaluated.
3. Materials and Methods
3.1. Population and Dataset
The population of this study was all count data stations near the interprovincial roads of Iran, which are available online from Iran Road Maintenance and Transportation Organization on the website of the Ministry of Roads and Urban Development (rmto.ir). All days of the first Iranian month, Farvardin, were considered in this analysis (31 days within 3/21/2019 to 4/20/2019). The number of individuals traveling between provinces increases in the first and second weeks of this month due to the Iranian New Year holidays. The condition of the roads gets back to regularly slow during the third and fourth weeks of this month. Therefore, the risky driving behavior of most Iranians could be estimated in this month.
The count data stations record hourly and daily different indices, such as total vehicles and the number of speeding and unsafe distance offenses. There were 31 separated provincial datasets. The active count stations record 60 minutes an hour, and only 2,316 count data stations remain. The count of unsafe distance offenses is the total number of vehicles with a distance shorter than 2 seconds between them. The count of speeding is the total number of vehicles on the road with a speed higher than the speed control limit (rmto.ir).
3.2. Statistical Analysis
3.2.1. Testing the Multivariate Normal Distribution
In order to study the bivariate distribution of these two traffic offenses, this study chose the energy test statistics that have the best performance among multivariate Gaussian distribution tests (7, 8). The observation Z ∈ Rd has a multivariate Gaussian distribution Nd (0, Id) with the mean vector of 0 and the variance-covariance matrix Id (9) as follows:
The y1,…, yn are the standardized elements of the sample. The energy test statistics for the d-distribution standard normal are as follows:
And
For computation, the sample of observation is standardized based on the mean and correlation matrix. The obtained test statistic
3.2.2. Correlation Tests
The correlation between the two random variables Y1 and Y2 or ρ12 was assessed with the maximum likelihood estimation of the Pearson product-moment correlation coefficient if their distribution was bivariate normal. When the joint distribution of the two random variables was not multivariate normal, the correlation was evaluated utilizing Spearman’s Rank correlation coefficient. In this test, the ranks of Y1 and Y2 are R1 and R2 for calculation, respectively (10).
3.2.3. Generalized Additive Model
The GAM is a GLM with a set of smoothing functions of covariates. The general form is as follows:
where μi ≡ E (Yi) and Yi ~ EF (μi, ϕ). The response term is Yi with the exponential family, a mean of μi, and the scale parameters of ϕ. The Ai is related to the parametric part of the model, and θ represents a vector related to the parameters. The fi is the smoothing function of the covariate xk (4). This study considered and compared the five distributions of univariate Poisson, univariate quasi-Poisson, univariate Gaussian, univariate location-scale Gaussian, and bivariate Gaussian for Yi. There are two models for each distribution, with the response variable in models 1 and 2 being the number of speeding and unsafe distance offenses, respectively. The only covariate in the model is the hour of the day, and the smoothing function f1(x) is a cubic regression spline with k = 20. The mean squared error (MSE) and correlation between observations and fitted values are the criteria for choosing the best model (4, 5).
3.2.4. Spatial Data Analysis
The response variable was the percentage of total speeding and unsafe distances in the total traffic during one month for each count station, respectively. The count station location has some information that accounts for this model. The Yi refers to the percentage of each traffic offense at count station si and has a Gaussian distribution as follows:
where Z(.) indicates a spatially structured random effect with zero-mean Gaussian process and Matérn covariance. The fitting method was the SPDE approach with R-INLA. The mesh was constructed with different margins to approximate Yi to a discrete Gaussian Markov random field. The models predict the lower and upper limits with 95% credible intervals, and the result is a map plot (6). All the statistical analyses were performed using R 4.0.2 (r-project.org) with mgcv, energy, geoR, maps, rgdal, maptools, sf, viridis, and ggplot2 packages (11-18).
4. Results
Table 1 shows the results of descriptive statistics and p-values for the bivariate normal test based on the energy statistics and correlation coefficients. Diverse factors were associated with driving offenses, among which only the time of day as a spline function was considered in this study. Table 2 shows the results of fitting 1) univariate GAM with quasi-Poisson distribution and 2) bivariate Gaussian GAM (other models, including univariate Poisson, univariate Gaussian, and univariate location-scale Gaussian, in Appendix 1). These two models had the best performance among their Poisson-related and Gaussian-related families according to the MSE and correlation indices.
| Provinces | Number of Count Stations | Hourly Average per Station (SD) | P-Value of Bivariate Normal Test b | Correlation | ||
|---|---|---|---|---|---|---|
| Speeding | Unsafe Distance | Pearson | Spearman | |||
| Ardebil | 64 | 12.2 (12.3) | 33.3 (29.2) | < 0.05 | 0.16 (< 0.05) | 0.29 (< 0.05) |
| Isfahan | 120 | 26.5 (35.4) | 30.3 (50.2) | > 0.05 | 0.26 (< 0.05) | 0.50 (< 0.05) |
| Alborz | 40 | 99.4 (197.6) | 320.8 (555.8) | < 0.05 | 0.32 (< 0.05) | 0.49 (< 0.05) |
| Ilam | 48 | 5.5 (5.7) | 14.5 (17.4) | > 0.05 | 0.21 (< 0.05) | 0.46 (< 0.05) |
| West Azarbayjan | 90 | 17.9 (19.2) | 40 (28.6) | < 0.05 | 0.25 (< 0.05) | 0.46 (< 0.05) |
| East Azarbayjan | 82 | 15.4 (23.5) | 18.2 (63.6) | < 0.05 | -0.01 (0.11) | 0.08 (< 0.05) |
| Bushehr | 52 | 16.9 (14.8) | 53.5 (68) | < 0.05 | 0.26 (< 0.05) | 0.30 (< 0.05) |
| Tehran | 103 | 49.5 (79.3) | 259.6 (334.7) | < 0.05 | 0.27 (< 0.05) | 0.41 (< 0.05) |
| Chaharmahal and Bakhtiari | 62 | 23.7 (24.8) | 26 (21.3) | > 0.05 | 0.46 (< 0.05) | 0.49 (< 0.05) |
| South Khorasan | 72 | 20.5 (16.4) | 13.9 (12.7) | > 0.05 | 0.51 (< 0.05) | 0.61 (< 0.05) |
| Razavi Khorasan | 131 | 19.6 (31.5) | 70 (133.9) | < 0.05 | 0.30 (< 0.05) | 0.48 (< 0.05) |
| North Khorasan | 47 | 12.6 (17.4) | 32.5 (27.5) | > 0.05 | 0.33 (< 0.05) | 0.26 (< 0.05) |
| Khuzestan | 104 | 14.5 (17.8) | 34.7 (31.2) | > 0.05 | 0.16 (< 0.05) | 0.41 (< 0.05) |
| Zanjan | 74 | 7.3 (8.7) | 40.5 (52.5) | > 0.05 | 0.38 (< 0.05) | 0.48 (< 0.05) |
| Semnan | 54 | 43.9 (49.3) | 33.1 (36.2) | > 0.05 | 0.58 (< 0.05) | 0.69 (< 0.05) |
| Sistan and Balouchestan | 70 | 26.2 (24) | 1.2 (1.3) | > 0.05 | 0.50 (< 0.05) | 0.44 (< 0.05) |
| Fars | 126 | 33.7 (46.1) | 74 (110.9) | > 0.05 | 0.21 (< 0.05) | 0.35 (< 0.05) |
| Qazvin | 57 | 14.8 (25.1) | 171.5 (268.2) | > 0.05 | 0.25 (< 0.05) | 0.50 (< 0.05) |
| Qom | 76 | 49 (74) | 82.4 (124.3) | > 0.05 | 0.16 (< 0.05) | 0.20 (< 0.05) |
| Kordestan | 52 | 7.6 (9.9) | 26.9 (28) | < 0.05 | 0.30 (< 0.05) | 0.37 (< 0.05) |
| Kerman | 107 | 13.4 (13.4) | 19.6 (17.2) | < 0.05 | 0.27 (< 0.05) | 0.33 (< 0.05) |
| Kermanshah | 72 | 9.8 (12.1) | 42.2 (47.9) | < 0.05 | 0.32 (< 0.05) | 0.52 (< 0.05) |
| Kohkilouye and Boyerahmad | 28 | 7.1 (8.5) | 24.6 (19.7) | < 0.05 | 0.34 (< 0.05) | 0.50 (< 0.05) |
| Golestan | 52 | 13.1 (24.6) | 78.5 (109.9) | < 0.05 | 0.00 (0.65) | 0.29 (< 0.05) |
| Gilan | 84 | 9.8 (15) | 193 (179.2) | < 0.05 | 0.09 (< 0.05) | 0.30 (< 0.05) |
| Lorestan | 62 | 11.7 (12.5) | 28.7 (31.8) | < 0.05 | 0.38 (< 0.05) | 0.49 (< 0.05) |
| Mazandaran | 102 | 23.7 (34.7) | 111.6 (164) | > 0.05 | 0.13 (< 0.05) | 0.32 (< 0.05) |
| Markazi | 64 | 30.6 (29.7) | 56.7 (64.2) | < 0.05 | 0.36 (< 0.05) | 0.47 (< 0.05) |
| Hormozgan | 72 | 27.5 (31.7) | 37.4 (37.9) | < 0.05 | 0.49 (< 0.05) | 0.48 (< 0.05) |
| Hamedan | 71 | 15.3 (20.3) | 44.4 (74.9) | > 0.05 | 0.47 (< 0.05) | 0.69 (< 0.05) |
| Yazd | 78 | 19.6 (32.6) | 19.8 (40.8) | < 0.05 | 0.58 (< 0.05) | 0.53 (< 0.05) |
Descriptive Statistics a
| Provinces | Univariate Quasi-Poisson | Bivariate Gaussian | ||||||
|---|---|---|---|---|---|---|---|---|
| MSE | COR | MSE | COR | |||||
| Speeding | Unsafe Distance | Speeding | Unsafe Distance | Speeding | Unsafe Distance | Speeding | Unsafe Distance | |
| Ardebil | 431.58 | 5585.6 | 0.26 | 0.37 | 313.039 | 3886.618 | 0.2655 | 0.4164 |
| Isfahan | 4234.72 | 9435.8 | 0.25 | 0.24 | 3305.632 | 7955.29 | 0.2588 | 0.2578 |
| Alborz | 100001.65 | 741558.34 | 0.11 | 0.22 | 86774.854 | 576048.427 | 0.1071 | 0.2286 |
| Ilam | 115.86 | 2336.48 | 0.28 | 0.24 | 84.528 | 1887.848 | 0.2714 | 0.253 |
| West Azarbayjan | 1083.11 | 2514.08 | 0.23 | 0.3 | 1544.517 | 12434.603 | 0.2564 | 0.2809 |
| East Azarbayjan | 1943.81 | 15195.81 | 0.25 | 0.26 | 839.992 | 1988.403 | 0.2496 | 0.3423 |
| Bushehr | 779.4 | 14589.36 | 0.22 | 0.29 | 540.01 | 10785.777 | 0.2256 | 0.3195 |
| Tehran | 15866.28 | 354773.14 | 0.17 | 0.3 | 12766.231 | 242816.189 | 0.1775 | 0.3289 |
| Chaharmahal and Bakhtiari | 1664.66 | 2716.23 | 0.3 | 0.41 | 1105.088 | 1737.031 | 0.3112 | 0.4543 |
| South Khorasan | 1319.27 | 1133.26 | 0.33 | 0.32 | 834.305 | 873.05 | 0.3386 | 0.3355 |
| Razavi Khorasan | 2241.12 | 50497.25 | 0.18 | 0.22 | 1682.416 | 40515.689 | 0.1797 | 0.2487 |
| North Khorasan | 936.37 | 5419.72 | 0.16 | 0.38 | 767.099 | 3592.478 | 0.1647 | 0.4066 |
| Khuzestan | 978.81 | 6959.98 | 0.2 | 0.33 | 737.537 | 4672.25 | 0.1983 | 0.3649 |
| Zanjan | 229.03 | 19909.58 | 0.18 | 0.24 | 193.617 | 17284.791 | 0.1796 | 0.2557 |
| Semnan | 10017.67 | 11546.95 | 0.25 | 0.24 | 7481.894 | 9765.432 | 0.2607 | 0.2609 |
| Sistan and Balouchestan | 2478.86 | 12.47 | 0.34 | 0.3 | 1363.401 | 10.218 | 0.3528 | 0.3227 |
| Fars | 5385.19 | 39761.19 | 0.21 | 0.27 | 4162.456 | 31543.184 | 0.2155 | 0.2845 |
| Qazvin | 2263.28 | 360868.29 | 0.14 | 0.24 | 1600.491 | 244795.473 | 0.1557 | 0.218 |
| Qom | 16924.48 | 61534.78 | 0.23 | 0.27 | 13419.011 | 49202.503 | 0.2369 | 0.2833 |
| Kordestan | 235.64 | 3365.31 | 0.17 | 0.38 | 197.928 | 2299.921 | 0.1735 | 0.4272 |
| Kerman | 659.95 | 2465.71 | 0.26 | 0.34 | 419.746 | 1635.215 | 0.2572 | 0.3666 |
| Kermanshah | 744.38 | 11365.21 | 0.17 | 0.32 | 665.794 | 8546.778 | 0.1719 | 0.3573 |
| Kohkilouye and Boyerahmad | 339.82 | 5697.06 | 0.25 | 0.4 | 238.177 | 3585.047 | 0.2614 | 0.4133 |
| Golestan | 1439.64 | 35333.35 | 0.18 | 0.33 | 1237.653 | 24184.02 | 0.1821 | 0.3728 |
| Gilan | 508.84 | 143528.05 | 0.14 | 0.37 | 439.298 | 88628.456 | 0.1437 | 0.4038 |
| Lorestan | 483.89 | 6004.13 | 0.24 | 0.31 | 365.061 | 4710.623 | 0.2407 | 0.3312 |
| Mazandaran | 4042.83 | 77117.08 | 0.14 | 0.31 | 3398.741 | 55020.8 | 0.1454 | 0.3335 |
| Markazi | 3435.27 | 24601.29 | 0.28 | 0.3 | 2382.4 | 19328.955 | 0.2917 | 0.3174 |
| Hormozgan | 3159.51 | 8827.06 | 0.22 | 0.29 | 2209.037 | 6432.453 | 0.2174 | 0.2983 |
| Hamedan | 1741.22 | 22891.93 | 0.23 | 0.27 | 1362.917 | 18492.39 | 0.2293 | 0.2981 |
| Yazd | 2615.35 | 7838.14 | 0.16 | 0.18 | 2153.476 | 7174.672 | 0.1643 | 0.1896 |
Mean Squared Error and Correlation Between Observed Values and Predicted Values by Provinces in Three Generalized Additive Models
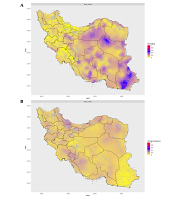
Figure 1 shows the predicted responses for the bivariate Gaussian model in Sistan and Baluchestan, and Gilan provinces, Iran. The patterns of these two plots were in contradiction. All figures for both univariate quasi-Poisson and bivariate Gaussian GAM models are presented in the appendix (Appendix 2). Figure 2 illustrates the predicted percentage of speeding and unsafe distance offenses with their spatial patterns in Iran. The two plots had a different pattern that indicated the percentage of speeding is higher in the central, northeast, and southeast regions than in other parts of Iran. The predicted percentage of speeding was higher than unsafe distance, indicating that speeding is high in Iran. The predicted percentage of unsafe distance with a range of 20 - 40% was higher for north, northwest, west, and some parts of southwest than other parts of Iran. These plots were produced with the triangulated mesh method. The other mesh method is available for comparison in Appendix 3.
 and unsafe distance (red) offenses in A, Gilan; and B, Sistan and Balouchestan, Iran")
Estimated number of speeding (blue) and unsafe distance (red) offenses in A, Gilan; and B, Sistan and Balouchestan, Iran
 and 1 (red))")
Mean prediction of A, speeding; and B, unsafe distance rates (within 0 (yellow) and 1 (red))
The temporal and hourly patterns of the predicted percentage for traffic offenses are available in Appendix 4.1 and Appendix 4.2, respectively. There were four intervals of 6 hours, including 0 - 5, 6 - 11, 12 - 17, and 18 - 23. According to Appendix 4.1, the predicted percentage of speeding was the highest at 0 - 5. On the other hand, Appendix 4.2 shows that the predicted percentage of unsafe distance was the lowest at 0 - 5 and had the highest value at 12 - 17 (Appendix 4.1 and Appendix 4.2).
5. Discussion
The speed limit and speeding fines for intercity highways are different in European countries and Iran. As illustrated in Figure 3, Norway has the highest speeding fines (€711), and the Czech Republic has the lowest speeding fines (€19) among other countries, respectively. In some countries, the speeding limits are different based on the two lanes or other roads (Norway), winter and other seasons (Sweden and Finland), rainy and other weather conditions (Luxembourg and Italy), and free speed (Germany). The traffic fines for speeding in Iran within 2021 - 2022 is 2,100,000 Iranian Rial (IR) (equivalently about €44.30 if €1 = 47,377 IRR (i.e., official governmental NIMA, the Central Bank of the Islamic Republic of Iran exchange rate) and about €6.72 if €1 = 312,480 IRR (i.e., unofficial open market exchange rate) in Q1 2022). Nevertheless, this comparison of speeding fines is simple and naive according to the different purchasing power parity and gross domestic product between countries; therefore, it is suggested to compare them to new indices, such as Big Mac Index, in future studies (19). The Figure 3 dataset is made from speedingeurope.com and rahvar120.ir datasets.
 of highway speed limit (km/h) and line chart (red) of speeding traffic fines (euro) by countries")
Bar chart (green) of highway speed limit (km/h) and line chart (red) of speeding traffic fines (euro) by countries
A significant relationship has been reported between road traffic accidents (RTA) and time (e.g., the time of the day) in Yazd, Iran, during the New Year holidays and summer (20). It has been the other study for these holidays in the six most populous provinces of Iran, namely Fars, Khorasan Razavi, Tehran, Isfahan, Kerman, and Khuzestan, within 2011 - 2015, indicating that Fars and Khorasan Razavi, with attractive tourist sites, have different high RTA among others (21). The mortality rate due to traffic accidents is higher in Iran at midnight and summer (22, 23) and in spring and summer in Shiraz (24) than in other times. The present study showed that the speeding rate was higher from midnight to early morning throughout Iran. This finding might be due to the existence of black spots with low and not uniform lighting on the roads (25). It also suggests that risky driving, not darkness, is the main reason for accidents (26). However, there are some exceptions; for example, in the south of Iran (27) and Yasuj (28), the rate of accidents during the day is higher than at night. The provinces in the south of Iran are located in the warmest region in the country, with an average daily high temperature. The high rate of accidents during the day in these provinces might be due to heat stress on drivers. A similar finding was reported in a study in Saudi Arabia (29) and high ambient temperatures in Spain (30). The percentage of RTA in Fars, Isfahan, Ilam, and the southeast region of Iran has a nonlinear trend in 24 hours with different peaks of speeding and unsafe distance (26, 31-34).
The rate of unsafe distance offense is almost high in Kermanshah, Iran, and it can be added as a new risk factor of RDA in this province (35). The highest rate of mortality for drivers, passengers, and pedestrians has been reported during 13:00 - 18:00 in the west of Iran (36), 18:00 - 20:00 in Mashhad (37), and 16:00 - 18:00 in the southeast of Iran (38). The findings of other studies showed that most of the collisions occurred in the early hours of the night. A part of these collisions is due to poor visibility. Inadequate visibility has a key role in crashes involving pedestrians, motorcyclists, cyclists, and drivers (39). Moreover, crashes at dark hours cause severe injuries (40, 41). According to the findings of a meta-analysis study, the odds ratio of mortality in dark-hour crashes is 53% higher than in day-hour crashes (42). Consequently, traffic offenses might have a relationship with RTA-related mortality. In this regard, this study suggests adding traffic offenses statistics to the Iranian Integrated Road Traffic Injury Registry (43, 44) and RTA studies. The other risk factors are the spatial variations of traffic offenses and accidents, seatbelt and helmet status, gender, age group (45), and climatic conditions, such as fog in the north of Iran (46).
The traffic fines and risky driving in Iran are studied in different ways, including the relationship between the number of traffic offenses and fuel costs within 2011 - 2019 (47), the relationship between increasing traffic fines policies and the road traffic law enforcement (48), the prevalence and determination of speeding in Iran (49), the comparison study of traffic fines in Iran and other countries (50), risky driving fined by police in 2006 and 2007 in Tehran (51), the effect of cameras on speeding behavior of taxi drivers in two highways (52), and aggressive violations (e.g., “sound horn to indicate your annoyance”, “get angry, give chase”, and “aversion, indicating hostility”). Moreover, Iran and Great Britain, the Netherlands, and Finland are among the countries with higher speeding violations than other countries, such as Greek and Turkey (53). In addition, visual, perceptual, and cognitive capabilities and physiological condition of drivers (e.g., Barkley’s Attention Deficit Hyperactivity Disorder Screening Test, Risk Perception Questionnaire, Risk Taking Questionnaire, Sensation Seeking Scale Survey, and Driver Behavior Questionnaire), among other factors in SHRP2 naturalistic driving study, are assessed in the USA (54).
Advanced and sophisticated statistical methods are in demand for traffic-related datasets. The GAMs are among the statistical models that can be used for complex relationships, such as risky driving in Iran (4) (e.g., driving offenses near public places, such as airports (1)). The bivariate structure of the response can estimate the correlation and compare the traffic offenses between provinces at distinct times of the day (5). It also calculates the peak hours and 95% confidence interval with their pattern for each province. The Getis-Ord General G* statistic in geographically weighted regression models revealed that the hotspot for fatal pedestrian accidents is in Mazandaran, Iran, and it is more common in Yazd, East Azerbaijan, and Ardebil (55). Future studies can investigate clustering methods, statistical learning methods (56), functional data analysis (57), and GAM for location, scale, and shape techniques to estimate the exact distribution with many parameters and their estimation for the underlying distribution (58).
5.1. Conclusions
The present study concluded that the risky driving behaviors due to traffic offenses can be estimated straightforwardly at different times and locations and add new information about the time of the days and roads that have not registered or occurred any traffic accidents. In this regard, they are predictive models. The geographical status of the roads, such as mountains or deserts, is shown to be related to the type of traffic offenses. For example, speeding violations on desert roads are higher than mountain roads, and unsafe distance violations on mountain roads are higher than desert roads. The day-night, rush hours, and holidays are the main time-related factors for occurring traffic offenses. The future direction of this study is to investigate the relationships between the percentage of traffic offenses and traffic accident occurrence, climate status (e.g., raining, foggy, and sunny), and holidays and restrictions (e.g., coronavirus disease 2019 restriction) on all roads in different times of the day.
In highway safety research, crash modification factors and safety performance are introduced based on the traffic volume and road characteristics, and different statistical methods are proposed to estimate them (59, 60). Therefore, defining new and easy-to-compute indices is needed for future studies to measure and model the percentage of risky driving. This study had some limitations. Firstly, the police statistics have crime classification errors (e.g., some errors in detecting speeding and unsafe distance) and systematic errors (e.g., the failure of count stations in some hours) (61). Secondly, the statistics on traffic accidents are not publicly available.
