
1. Background
Given ever-evolving medical and scientific technologies, human life expectancy continues to increase. Over the past 10 years, the life expectancy of South Korean men has increased by eight years, while their health or disease-free life expectancy increased by 6.4 years (1). Life expectancy is a quantitative measure, whereas healthy life expectancy is a qualitative measure. An extended healthy life expectancy thus means an enhanced quality of life (QOL) (2). Quality of life is improves as healthy life expectancy is gradually increasing. However, the discrepancy between life expectancy and healthy life expectancy is likely because the qualitative aspects of QOL continue to lag behind the quantitative ones (2, 3).
In South Korea, middle-aged adults (40 - 64 years) account for approximately 40% of the total population, with an increase of 3.4% over the last 10 years (1). Middle adulthood is a pivotal period for the family and society and a turning point in life, from which balance can be achieved (4). However, middle-aged adults have the double burden of supporting their parents and children, as they are caught between these two generations (5). They are also in a stage of transition from young adulthood to older adulthood, characterized by declining physical functions and the occurrence of various health issues, which lowers their QOL (3). Specifically, middle-aged men experience physical changes, such as andropause symptoms, due to a decrease in male hormones, aging-related changes in appearance, and chronic diseases (6). Under the burden of competition due to these changing circumstances, middle-aged men can feel a growing sense of crisis or a deterioration of their QOL (5).
Quality of life refers to feeling happy or satisfied with one's life; specifically, it indicates the feeling that one is living a good life by attaining happiness and meaning in life (7). In other words, QOL is a subjectively perceived state influenced by the changes in the social environment surrounding each individual and can be understood from a relative rather than an absolute perspective (8). While general QOL focuses on well-being, health-related QOL focuses on overall physical and mental health (9). In sum, it is essential to understand health-related QOL in middle age, which is the onset of physical aging and stressful experiences.
Middle-aged men tend to rely on alcohol to overcome stress due to various changes they undergo. While moderate drinking relieves stress and provides vitality, binge drinking has negative physical, psychological, and social effects (10). Although moderate drinking enhances QOL in the early years, it reduces it in the long run (11). Long-term exposure to binge drinking in middle adulthood is a predictor of senescence (12). A study on Korean adults found hazardous drinking among 51.7% of men compared to 34% of women (13). Kim et al. (10) demonstrated the effect of drinking on QOL among middle-aged men, which was mediated by depression and predicted the likelihood of the same pattern repeating in old age. As the lifestyle of middle adulthood is carried on into late adulthood, a healthy and satisfactory life during middle adulthood is required in preparation for older adulthood, which is extending due to the aging of society (5, 10). Therefore, understanding the QOL of middle-aged adults and related variables is crucial. As middle-aged women experience more conspicuous physical and emotional changes and more acute developmental crises owing to menopause than men (14), there is a considerable body of literature on middle-aged women's QOL; however, studies on the QOL of middle-aged men are scarce (5, 15, 16). Studies on the association between alcohol consumption and QOL in middle-aged men are even rarer.
2. Objectives
This study proposed to investigate the relationship between drinking and QOL among middle-aged men and explore strategies to prevent drinking problems and improve QOL by identifying influencing factors.
3. Materials and Methods
3.1. Research Design
This is a descriptive study based on secondary data analysis using raw data from the 2019 Korea National Health and Nutrition Examination Survey (KNHANES) conducted by the Korea Disease Control and Prevention Agency (KDCPA).
3.2. Participants and Data Collection
We downloaded the raw data, which were de-identified in compliance with the Personal Information Protection Act (2011) and Statistics Act (1962), after signing statements of compliance with the statistical data user's guidelines and security guidelines following the procedure specified on the KNHANES website. The raw data were screened to extract data on participants satisfying the inclusion criteria. Based on a study that defined adults of 40 - 64 years of age as middle-aged (3), this study was conducted on men aged 40 - 64 years who had been consuming alcohol over the past 12 months. A total of 992 participants was selected for analysis. The sample size required for this study was set at a minimum of 194, using the G*Power 3.1.9 program with the following parameters for the multiple regression analysis: Effect size = 0.15, significance level = 0.05, explainability = 95%, and 14 predictor variables. Consequently, the sample of 992 met the required sample size. This study was approved by the Institutional Review Board of the Korea Disease Control and Prevention Agency Research Ethics Review Committee (approval number: 2018-01-03-C-A).
3.3. Research Tools
3.3.1. Alcohol Consumption
Alcohol consumption was measured using the Alcohol Use Disorders Identification Test-Consumption (AUDIT-C) (17), a shortened version of AUDIT (18). Alcohol Use Disorders Identification Test-Consumption is rated on a five-point Likert scale from 0 to 4 and consists of three questions: (1) drinking occasions in the past year; (2) quantity of alcohol consumed; and (3) frequency of heavy drinking. Based on a study that presented the AUDIT-C cut-off values for men (13), hazardous drinking was defined as 6 points or higher (total score: 12 points).
3.3.2. Quality of Life
Quality of life was measured using the European QOL-5 dimensions (EQ-5D) developed by the EuroQol Group (19). This instrument consists of five dimensions (mobility, self-care, usual activities, pain/discomfort, and anxiety/depression), each including three levels (1 = no problem, 2 = moderate problem, 3 = severe problem). The EQ-5D index is calculated using the weight formula per the Korean EQ-5D measurement standard for each sub-area (20) and ranges between 0 and 1 point, where a higher score indicates a higher QOL.
3.4. Data Analysis
Data analysis was performed using SPSS/WIN v25.0. The participants' general characteristics, alcohol consumption, and QOL levels were calculated and expressed using descriptive statistics. Differences in QOL according to general characteristics, lifestyle, and mental health were analyzed using the t-test and one-way ANOVA, the differences' statistical significance was analyzed using scheffe's post-hoc test. A hierarchical multiple regression analysis was performed to identify the factors affecting QOL.
4. Results
4.1. General Characteristics and Quality of Life
The most common age group was that of individuals in their 40s (41.33%), followed by those in their 50 s (37.60%) and 60 s (21.07%), and the mean age was 51.95 ± 7.31. The most common education level was college or higher (48.69%); the majority of participants were married (87.40%); the majority had economic activity (88.71%); a high-income level (61.19%) was most common, and 92.24% were not one-person households.
The results indicated differences in the QOL based on general characteristics. Participants in their 40 s, college graduates or higher, married or single persons, economically active individuals, and those in the middle- or high-income groups had a higher QOL (Table 1).
| Variables | No. (%) or Mean ± SD | EQ-5D | |
|---|---|---|---|
| Mean ± SD | t or F (P) | ||
| Age | 4.95 (0.01) (a > b, c) | ||
| 40 - 49 a | 410 (41.33) | 0.98 ± 0.06 | |
| 50 - 59 b | 373 (37.60) | 0.97 ± 0.08 | |
| 60 - 64 c | 209 (21.07) | 0.96 ± 0.08 | |
| Mean age ± SD | 51.95 ± 7.31 | ||
| Education | 15.90 (< 0.001) (a, b < c) | ||
| ≤ Middle school a | 149 (15.02) | 0.95 ± 0.10 | |
| High school b | 360 (36.29) | 0.96 ± 0.08 | |
| ≥ College c | 483 (48.69) | 0.98 ± 0.04 | |
| Marital status | 6.49 (< 0.001) (a, c > b) | ||
| Married a | 867 (87.40) | 0.97 ± 0.06 | |
| Separation, divorce, widowed b | 58 (5.85) | 0.94 ± 0.12 | |
| Unmarried c | 67 (6.75) | 0.96 ± 0.09 | |
| Economic activity | 4.12 (< 0.001) | ||
| Yes | 880 (88.71) | 0.98 ± 0.06 | |
| No | 112 (11.29) | 0.93 ± 0.12 | |
| Income | 28.28 (< 0.001) (a < b, c) | ||
| Low a | 178 (17.94) | 0.94 ± 0.11 | |
| Middle b | 207 (20.87) | 0.97 ± 0.07 | |
| High c | 607 (61.19) | 0.98 ± 0.05 | |
| One-person households | -0.96 (0.34) | ||
| Yes | 77 (7.76) | 0.96 ± 0.09 | |
| No | 915 (92.24) | 0.97 ± 0.07 | |
General Characteristics and Quality of Life (N = 992) 1
4.2. Lifestyle, Mental Health, and Quality of Life
Regarding the lifestyle variables, 56.76% of the participants had a good sleep status, and 32.96% exercised regularly. The level of alcohol consumption as the mean AUDIT-C score was 6.56 ± 3.22. Based on the cut-off AUDIT-C score of 6 points, 63.51% of the participants were in the hazardous drinking group, and 38.21% were smokers. Regarding the mental health variables, 54.44% of the participants perceived their health as moderate, 40.22% rated their happiness as moderate, 61.39% felt some stress, and 95.46% did not have suicidal ideation. The level of QOL expressed as the mean EQ-5D index score was 0.97 ± 0.07.
A higher QOL was observed in people having good sleep status, exercising, not smoking, perceiving good subjective health, perceiving moderately happy or high happy, having some or almost no stress, and having no suicidal ideation (Table 2).
| Variables | No. (%) or Mean ± SD | EQ-5D | |
|---|---|---|---|
| Mean ± SD | t or F (P) | ||
| Sleep status | 36.79 (< 0.001) (a < b < c) | ||
| Poor a | 54 (5.44) | 0.92 ± 0.12 | |
| Moderate b | 375 (37.80) | 0.96 ± 0.08 | |
| Good c | 563 (56.76) | 0.98 ± 0.05 | |
| Exercise | 4.00 (< 0.001) | ||
| Yes | 327 (32.96) | 0.98 ± 0.05 | |
| No | 665 (67.04) | 0.96 ± 0.08 | |
| AUDIT-C | 1.81 (0.07) | ||
| < 6 | 362 (36.49) | 0.98 ± 0.06 | |
| ≥ 6 | 630 (63.51) | 0.97 ± 0.09 | |
| Mean AUDIT-C ± SD | 6.56 ± 3.22 | ||
| Smoking | -2.94 (0.00) | ||
| Yes | 379 (38.21) | 0.96 ± 0.09 | |
| No | 613 (61.79) | 0.98 ± 0.05 | |
| Subjective health | 44.67 (< 0.001) (a < b < c) | ||
| Poor a | 114 (11.49) | 0.92 ± 0.11 | |
| Moderate b | 540 (54.44) | 0.97 ± 0.07 | |
| Good c | 338 (34.07) | 0.99 ± 0.04 | |
| Happiness | 30.05 (< 0.001) (a < b, c) | ||
| No a | 350 (35.28) | 0.95 ± 0.09 | |
| Moderate b | 399 (40.22) | 0.98 ± 0.06 | |
| High c | 243 (24.50) | 0.99 ± 0.05 | |
| Stress | 17.05 (< 0.001) (a, b > c) | ||
| Almost none a | 116 (11.69) | 0.99 ± 0.04 | |
| Some b | 609 (61.39) | 0.98 ± 0.06 | |
| A lot c | 267 (26.92) | 0.95 ± 0.09 | |
| Suicidal ideation | -5.44 (< 0.001) | ||
| Yes | 45 (4.54) | 0.86 ± 0.14 | |
| No | 947 (95.46) | 0.98 ± 0.06 | |
| EQ-5D | 0.97 ± 0.07 | ||
Lifestyle, Mental Health, and Quality of Life (N = 992) 1
4.3. Factors Affecting Participants' Quality of Life
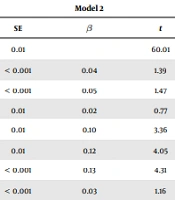
Hierarchical multiple regression analysis was performed by converting the variables with significant differences in general characteristics, lifestyle, and mental health into dummy variables and entering them as independent variables along with AUDIT-C. The explanatory power of the model 1 was 8.9%, and the regression equation was statistically significant, with education, economic activity, and income affecting QOL. Similarly, in model 2, the regression equation was statistically significant, with an explanatory power of 21.0%, and suicidal ideation, sleep status, income, economic activity, subjective health, and stress affect QOL in descending order of importance (Table 3).
| Variables | Model 1 | Model 2 | ||||||||
|---|---|---|---|---|---|---|---|---|---|---|
| B | SE | β | t | P | B | SE | β | t | P | |
| (Constant) | 0.90 | 0.01 | 86.31 | < 0.001 | 0.82 | 0.01 | 60.01 | < 0.001 | ||
| Age | < 0.001 | 0.01 | 0.03 | 0.90 | 0.37 | 0.01 | < 0.001 | 0.04 | 1.39 | 0.16 |
| Education | 0.01 | 0.01 | 0.10 | 2.97 | 0.00 | 0.01 | < 0.001 | 0.05 | 1.47 | 0.14 |
| Marital status | 0.01 | 0.01 | 0.04 | 1.30 | 0.20 | 0.01 | 0.01 | 0.02 | 0.77 | 0.44 |
| Economic activity | 0.03 | 0.01 | 0.15 | 4.80 | < 0.001 | 0.02 | 0.01 | 0.10 | 3.36 | 0.00 |
| Income | 0.03 | 0.01 | 0.16 | 4.98 | < 0.001 | 0.02 | 0.01 | 0.12 | 4.05 | < 0.001 |
| Sleep status | 0.02 | < 0.001 | 0.13 | 4.31 | < 0.001 | |||||
| Exercise | 0.01 | < 0.001 | 0.03 | 1.16 | 0.25 | |||||
| Smoking | < 0.001 | < 0.001 | 0.01 | 0.47 | 0.64 | |||||
| Subjective health | 0.01 | < 0.001 | 0.08 | 2.58 | 0.01 | |||||
| Happiness | 0.01 | 0.01 | 0.06 | 1.87 | 0.06 | |||||
| Stress | 0.01 | 0.01 | 0.06 | 2.06 | 0.04 | |||||
| Suicidal ideation | 0.08 | 0.01 | 0.24 | 7.82 | < 0.001 | |||||
| AUDIT-C | < -0.001 | < 0.001 | -0.03 | -1.18 | 0.24 | |||||
| R2 = 0.093, adjusted R2 = 0.088, F = 20.12, P < 0.001 | R2 = 0.220, adjusted R2 = 0.210, F = 21.27, P < 0.001 | |||||||||
Factors Affecting the Subject's Quality of Life (N = 992)
The Durbin-Watson value was 1.95, the tolerance limit was 0.80 - 0.95, and the variance inflation factor was 1.05 - 1.25.
5. Discussion
This study aimed to provide essential data to create strategies to improve the QOL of middle-aged men by identifying influencing factors. Among general characteristics and lifestyle and mental health variables, significant differences in QOL were observed by age, education, marital status, economic activity, income, sleep status, exercise, smoking, subjective health, happiness, stress, and suicidal ideation. In order of importance, the factors affecting QOL were suicidal ideation, sleep status, income, economic activity, subjective health, and stress.
The participants' mean alcohol consumption score based on AUDIT-C was 6.56 points, which was higher than that of German men over 18 years of age (3.5 points) (21). In addition, over half of the participants belonged to the hazardous drinking group. Their QOL score was higher than the results of a study targeting adults over 30 years old and lower than those of adult male workers over 20 years old (22, 23). The regression analysis revealed that alcohol consumption did not affect QOL. Contrastingly, a study on middle-aged Korean adults found that binge drinking significantly lowered QOL (10). Another survey of Korean adult men demonstrated that the level of problem drinking was negatively correlated with QOL through the mediating role of depression (24). Unlike previous studies, we showed that alcohol consumption did not affect QOL. However, follow-up studies should be conducted to identify which individual or social variables made the difference.
The analysis of the QOL scores based on general characteristics revealed that participants in their 40s had a higher QOL than those in their 50 s and 60 s. Likewise, Kim et al. (16) found that men in their 40 s had a higher QOL than those in their 50 s, albeit without statistical significance. This highlights the importance of maintaining a high QOL throughout midlife to prevent its deterioration in late adulthood. Higher QOL scores were found among participants with higher education or middle- or high-level income. Kim and Sung (15) found that college graduates had higher QOL scores than middle-school graduates, and those with high-income levels (≥ 5 million won) had higher QOL than those with low-income levels (< 2 million won), which was in line with the present study. Participants who were married or single and those who were economically active scored higher on QOL than those who were widowed/divorced/separated and unemployed. These results support a previous study on QOL in adults in their 30s and older (22), indicating that individuals living with a spouse and having economic activity had a higher QOL. Quality of life can be improved through expanded social relationships established through education and consequent leisure activities and job opportunities, which are directly associated with a higher QOL (10, 25).
A higher QOL was associated with better sleep status, exercise, no smoking, good subjective health, happiness (moderate to high), little or almost no stress, and no suicidal ideation. These findings are consistent with previous research findings that QOL in middle-aged men increases when they are physically active (15, 16), do not smoke (16), and have good subjective health (5). Similar results were found in a study reporting that among adults over 30 years of age, the low-stress group scored higher on QOL than the high-stress group (22). Another study reported that in the population aged 15 or over, those with better sleep status had a high QOL (26). Happiness was a component of QOL, along with well-being, satisfaction with life, and meaning in life (7), while suicidal ideation was associated with low QOL (27), which was also supported by the findings of the present study.
The present analyses identified the following variables as factors affecting QOL: Suicidal ideation, sleep status, income, economic activity, subjective health, and stress in order of importance. These results align with the findings of previous studies that middle-aged adults with a negative perception of their QOL tended to have suicidal ideation (27), sleep disturbances resulted in lower QOL (28), and a lower monthly income was associated with a lower QOL in middle-aged men (16). In addition, a higher QOL was found to be associated with being economically active (22) and having good subjective health (16, 23), whereas stress was identified as a factor affecting QOL (15, 24), which is also consistent with the present study. Middle-aged men may experience negative emotions, such as stress or depression, due to reduced income from reduced opportunities for economic activity due to early retirement or dismissal due to an economic recession (5). Therefore, efforts are required to provide middle-aged men who lost their jobs due to socioeconomic problems with opportunities to engage in economic activity and use their knowledge and skills. Moreover, as stress or depression is a predictor of suicidal ideation (27), creating a system that can detect related symptoms and initiate timely interventions to prevent QOL impairment is necessary. Middle adulthood is characterized by an increased risk of chronic diseases (6) and deterioration in sleep quality due to andropause symptoms (29), leading to a negative view of their health and affecting QOL.
This study identified factors affecting QOL in middle-aged men. As QOL is influenced by various aspects of life, such as the psychological dimension, including stress and suicidal ideation, the physical dimension, including sleep status and subjective health, and the social dimension, including income and economic activity, there is a need to develop integrated interventions considering these multidimensional factors.
5.1. Conclusions
This study is significant because it presented primary data to better understand middle-aged men's QOL and develop intervention programs to improve their QOL by examining the relationship between alcohol consumption and QOL. A practical implication of this study is the need to develop and implement integrative intervention programs to improve middle-aged men's QOL, as it is affected by various psychological, physical, and social factors. Future research should focus on developing such a program and testing its efficacy.
This study had some limitations. The results cannot be directly generalized to all middle-aged men owing to the small sample size (n = 992) and implementation in a single country (South Korea). In addition, various variables, such as religious, cultural, and occupational characteristics, which can affect the alcohol consumption of middle-aged men, were not considered. Due to the lack of literature on the association between alcohol consumption and QOL in middle-aged men, the correlation between these two variables could not be sufficiently tested. Further, this study examined the relationship between alcohol consumption and QOL at a single point in time. Therefore, future studies should analyze time-series changes in QOL by assessing the changes in drinking patterns at multiple points in time.
