1. Background
Social media platforms, such as social networking sites (SNS), have become integral to our daily lives. Initially utilized as web-based tools, the advent of smartphones capable of internet access combined with our growing reliance on these devices has led to an increased use of and addiction to SNSs, including social networks, forums, Twitter, blogs, Instagram, and Facebook (1-3). Indeed, the interactive nature of cyberspace, which allows for immediate commenting and response checking, poses a significant risk of SNS addiction (4).
Social networking sites addiction falls under the broader category of internet addiction and impacts individuals across all demographics and age brackets (5, 6). It is characterized by an unhealthy psychological dependence on SNSs, marked by compulsive engagement and the need to check and use these platforms (5) constantly. Andreassen and Pallesen describe SNS addiction as an excessive worry about SNSs, a strong desire to log on and engage with them, and dedicating a substantial amount of time and effort to these activities. This obsession can detrimentally affect individuals' social engagements, academic pursuits, careers, personal relationships, mental health, and overall well-being (7).
Symptoms of SNS addiction, akin to those observed in other types of addiction, encompass withdrawal symptoms, relapse, tolerance, isolation, conflicts, and mood modification (6, 8). Additionally, frequent use of SNS and smartphones can lead to mental (such as depression, anxiety, and sleep disorders), physical (including visual disturbances and musculoskeletal issues like neck pain), and social (such as traffic issues and accidents) disorders (9, 10). Behavioral addictions, such as excessive use of social networking sites, similar to drug addiction, are linked with disruptions in dopaminergic regulation (11, 12). Prior research indicates that normal regulation of striatal dopamine activity by the prefrontal cortex signaling is disrupted, suggesting that reduced striatal dopamine activity may reflect abnormal regulation of the mesolimbic dopamine system by the prefrontal cortex (13).
Dopamine receptors are categorized into five main subtypes (D1-D5) (14). These receptors are split into two groups based on pharmacological characteristics; the D1-like group, comprising D1 and D5 receptors, shares pharmacological structure and sensitivity and stimulates intracellular cAMP levels. The D2-like group includes D2, D3, and D4 receptors, which are structurally similar and inhibit intracellular cAMP levels (15, 16). Metabotropic dopamine receptors initiate the formation of second messengers, which then either trigger or inhibit the activation of specific cellular signaling pathways (17). Studies have shown that individuals with substance abuse disorders (including opium, cannabis, nicotine, etc.) and those with internet addiction exhibit a decreased availability of D2 and D3 receptors (11, 18-20).
Peripheral blood lymphocytes serve as effective and accessible indicators for assessing changes in neurotransmitter receptors, such as dopamine receptor genes, and are a suitable proxy for gene expression analysis in the brain (21). Although mRNA expressions of D1 and D2 are prevalent in the brain, evidence for their expression in peripheral blood lymphocytes remains insufficient (22).
2. Objectives
To date, only a limited number of studies have focused on alterations in dopamine receptor subtypes in addictive behaviors, particularly in the context of SNS addiction. As a result, this study evaluated the mRNA expression levels of D3 and D4 receptors in peripheral blood lymphocytes of SNS addicts and their relatives in comparison with a control group. This investigation aimed to determine the efficacy of these receptor subtypes as biomarkers in research on addictive behaviors, with a special emphasis on SNS addiction.
3. Patients and Methods
This study utilized an applied research approach with a case-control design, involving a total sample size of 30 participants (10 in each group), determined based on the findings of previous research (23, 24). The diagnosis of SNS addiction was established using the modified version of Young's Internet Addiction Scale (YIAS), which comprises 20 items rated on a five-point Likert scale (25). The YIAS scores were categorized into 3 levels: Lower than 50 indicating no addiction, between 50 and 70 indicating mild addiction, and higher than 80 indicating severe addiction (26).
Initially, students from 2 major dormitories at Kerman University of Medical Sciences who were willing to participate completed the questionnaire. Subsequently, 10 participants (5 women and 5 men) who scored higher than 80, indicating a severe addiction to social networks on smartphones and were willing to participate in the second phase of the study, were randomly chosen. Additionally, to explore addiction among first-degree relatives (parents and siblings), 10 participants were selected after obtaining consent and considering the age group of individuals addicted to SNS on smartphones. The control group, consisting of 6 women and 4 men of similar age and also students from the same university, had experience using SNS on smartphones but scored lower than 50 on the YIAS. Selected participants, who had provided their consent, were considered young (aged 25 - 45 years, in line with the WHO's definition) and had no history of serious mental health issues such as substance abuse, neurological disorders, or major or chronic physical illnesses (Table 1).
| Demographic Variables | Control | Patients | Relatives |
|---|---|---|---|
| Age Mean (SD) | 27.82 (4.16) | 26.34 (3.95) | 30.81 (4.63) |
| Gender | |||
| Male | 4 | 5 | 5 |
| Female | 6 | 5 | 5 |
| Smoking | |||
| Smoker | 0 | 0 | 0 |
| Non-smoker | 10 | 10 | 10 |
| History of mental diseases | 0 | 0 | |
| Substance addiction | 0 | 0 | |
| Having hepatitis B and HIV | 0 | 0 |
3.1. Preparing Peripheral Blood Lymphocytes
Over the course of three days, all participants visited specified locations in two dormitories for sampling. Adhering to sterile procedures, 5ml of blood was drawn from the forearm vein of each participant and immediately mixed in tubes containing 0.05 molar ethylenediaminetetraacetic acid (EDTA) at a 1 to 10 ratio. We aimed to isolate lymphocytes within 3 hours post-blood collection. To each 15 mL clear conical tube, 2 mL of Ficoll was added. Following the manufacturer’s guidelines, the samples were centrifuged in a cell separator at 2500 g at room temperature for 20 minutes. The lymphocyte layer was then harvested using cold phosphate-buffered saline (pH = 4.7) and washed three times.
3.2. Extraction of Total RNA and Reverse Transcription
The RNA was extracted from the lymphocytes using the RNeasy Mini Kit (Qiagen). The quantity and purity of the RNA were assessed through gel electrophoresis (1% agarose, Gibco/BRL) and spectrophotometry. To synthesize 20μl of single-stranded cDNA, 1µg of RNA was utilized, following the QuantiTect Reverse Transcription Kit (Qiagen) instructions.
3.3. Oligonucleotide Primers Used in Real-Time PCR
Oligonucleotide primers for D5, D3, and D4 receptors used in the real-time PCR were obtained from Qiagen's primer bank. β-actin, also from Qiagen, served as the housekeeping gene to normalize the dopamine receptor genes. To enhance accuracy and reduce cDNA contamination, forward and reverse primers were specifically designed to span exon-exon junctions (Table 2).
| Locus | Forward Primer 5′ 3′ | Reverse Primer 5′-3′ | Accession Number (Gene Bank) | Size (bp) |
|---|---|---|---|---|
| β-actin | 5’-AGACGCAGGATGGCATGGG-3’ | 5’-GAGACCTTCAACACCCCAGCC-3’ | NM_001101.3 | 161bp |
| DRD3 | 5’- TCTGTGCCATCAGCATAGACAGGT-3’ | 5’-TAAAGCCAAACAGAAGAGGGCAGG-3’ | NM_000796.3 | 156bp |
| DRD4 | 5’- TCTTCGTCTACTCCGAGGTCCA-3’ | 5’- TGATGGCGCACAGGTTGAAGAT-3’ | NM_000797.3 | 100bp |
| DRD5 | 5’-TCATCTATGCCTTCAACGCCGACT-3’ | 5’- AGCTGCGATTTCCTTGTGGAAGAC-3’ | NM_000798.4 | 155bp |
3.4. Real-time PCR
Following the manufacturer's guidelines for the Power SYBR Green PCR Master Mix in real-time PCR, we utilized 2 µL of single-stranded cDNA, specific primers, and Power SYBR Green PCR Master Mix to conduct the real-time PCR. The reaction conditions for each primer pair were optimized at temperatures ranging from 60 - 63°C to ensure uniform product formation. The specificity of the PCR products was verified by observing a single peak in the melt curve analysis. The sizes of the PCR products were confirmed by visualization on a 2% agarose gel stained with ethidium bromide.
3.5. Data Analysis
The samples were normalized against β-actin (the housekeeping gene). The cycle threshold (Ct) was defined as the number of cycles at which the fluorescence reached a predetermined threshold.
The samples underwent analysis twice (across 2 transcriptions), and the mean values were used for data analysis. The Ct values were compared to the standard curve generated for each reaction cycle. To determine and compare the relative gene expression levels between the control group and SNS addicts and to identify significant differences between them, we analyzed the data using GenEX 4. The PCR efficiency and mean crossing point (CP) deviation were calculated using a mathematical model. The real-time PCR efficiency was determined with the formula E=10[-1/Slope], which was applied to serial dilutions of cDNA. The expression ratio of the target gene between the sample and control groups, as well as the normalization of target gene expression, was calculated using the following equation:
To assess the significance of the findings, the software employed pairwise fixed randomization, a robust method for parametric tests that does not assume any specific distribution for the data. This approach enhances the efficiency of the analysis compared to more conventional tests. Separate analyses were conducted for each target gene (D3, D4, and D5 receptors) comparing SNS addicts with the control group. A P-value of < 0.05 was deemed statistically significant. The results were presented as the mean ± the standard error of the mean (SEM) of the normalized mRNA expression values.
4. Results
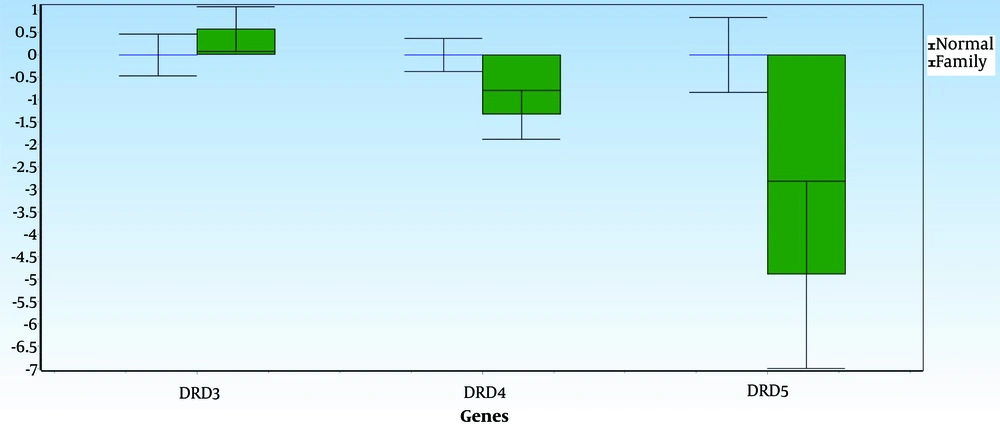
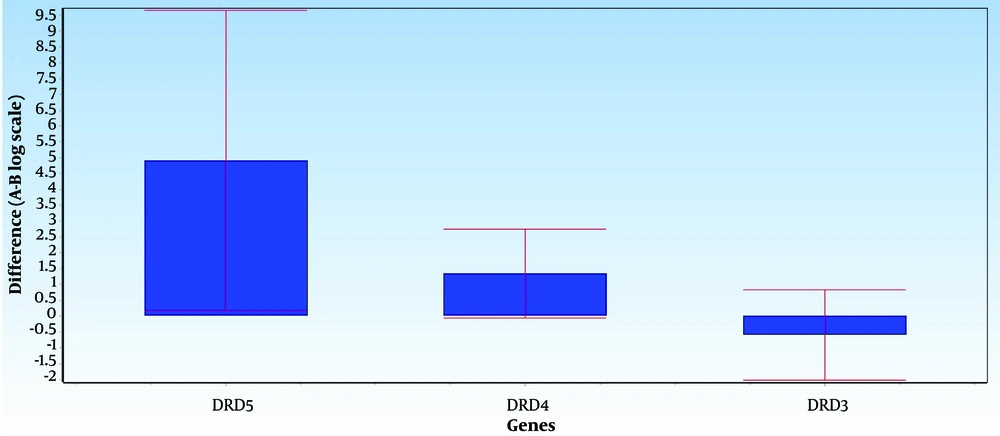
Figures 1 and 2 illustrate the average differences in data between Group A (the normal group) and Group B (the SNS addict group) for each gene, along with the data's error bars. The mean difference between the 2 groups, represented as ddCt, indicates the fold change in gene expression in the normal group relative to the addicts. Notably, DRD5 and DRD4 expression levels have decreased in the SNS addicts' group samples. Specifically, DRD4 expression has significantly increased in the normal group, as evidenced by a P-value less than 0.05 (0.01), while the increase in DRD5 expression is not considered significant. Furthermore, DRD3 expression has risen by 1.6 in the SNS addicts' group, meaning that this gene's expression has significantly decreased in the normal participants compared to the addicts, as indicated by a P-value less than 0.05 (0.01).
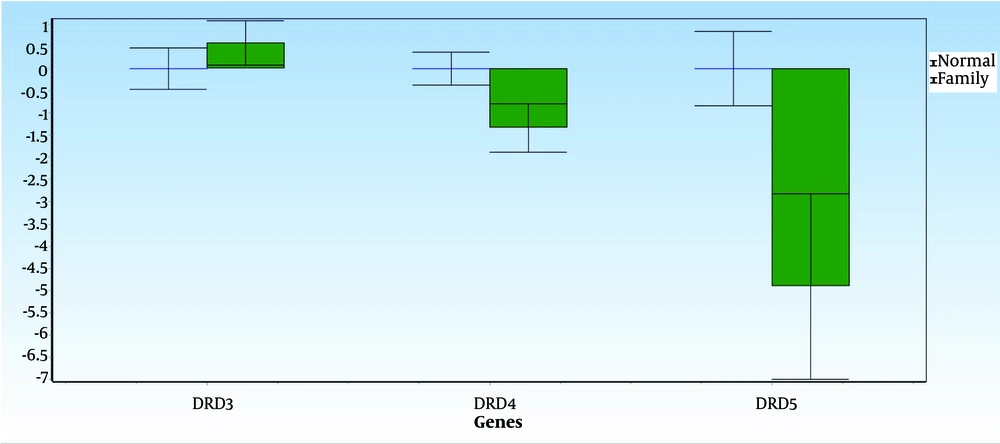
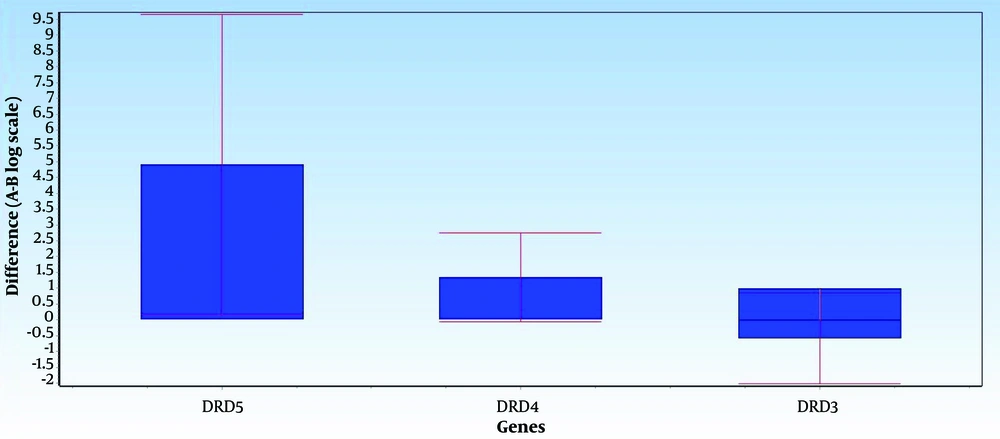
Figures 3 and 4 display the average data differences between Group A (the normal group) and Group B (the first-degree relatives of the SNS addicts' group) for each gene, along with their error bars. The mean difference, shown as ddCt, reveals the fold change in gene expression in the normal group versus the addicts. It is observed that DRD5 and DRD4 expression levels in the first-degree relatives of SNS addicts have decreased. In contrast, the increases in DRD4 and DRD5 expressions are not statistically significant in the normal group, with P-values greater than 0.05. Additionally, DRD3 expression has increased in the first-degree relatives of SNS addicts; in other words, this gene's expression has significantly decreased in the normal participants compared to the first-degree relatives of SNS addicts, as reflected by a P-value less than 0.05 (0.04).
According to the real-time PCR analysis results of the D2-like receptor genes in peripheral blood lymphocytes and the questionnaire responses, 4 first-degree relatives of SNS addicts meet Young’s criteria for addiction, while the remainder are non-addicts.
5. Discussion
Several factors, including mental, environmental, and biological aspects, contribute to addiction. Biologically, the brain is considered the principal component, with numerous neural circuits involved, most notably the dopamine system, in the addiction process (27). Evidence has shown that a reduction in dopamine receptor availability leads to reward deficiency syndrome (RDS). This condition is characterized by an increased need for intense stimulation and excitement in individuals with genetic variations in dopaminergic neurotransmission within the reward pathway. Affected individuals often turn to substances or alternative behaviors such as internet addiction, gambling, and SNS addiction to counteract their low dopamine activity (13).
This study's results revealed significant changes in mRNA expression levels of D4 and D5 receptors in the peripheral blood lymphocytes (PBL) of SNS addicts compared to the control group, while D3 levels showed no significant difference. Similarly, first-degree relatives of SNS addicts exhibited a significant reduction in D5 mRNA levels compared to the control group; however, D4 levels did not decrease significantly, and D3 levels remained stable. These findings align with previous research indicating reduced D4 mRNA expression and unchanged D3 levels in substance addicts' peripheral blood lymphocytes (28), suggesting that SNS addiction may lead to biological and neurological alterations akin to other forms of addiction. Additionally, the decrease in D5 receptor expression in both SNS addicts and their first-degree relatives could indicate a risk factor for addiction, supporting the findings of Goodarzi et al. Evidence suggests that genetic predispositions for addictive behaviors exist, theorizing that affected individuals, due to a deficiency in dopamine receptors or dopamine levels, struggle to enjoy activities that most people find rewarding. To enhance pleasure, these individuals engage more in behaviors that increase dopamine levels, offering greater rewards but also increasing their risk of addiction (29). However, it's crucial to recognize that biological factors are not the sole predictors of addiction risk. Negative experiences during childhood and adolescence, as well as exposure to physical, economic, or mental harm, can significantly heighten the likelihood of future addictions (30).
To our knowledge, no prior study has examined mRNA expression in dopamine receptors, specifically in SNS addicts. However, concerning behavioral addictions, such as video game addiction, this study's findings regarding the decrease in D5 expression and the absence of change in D3 receptor levels align with those of Vousooghi et al. Unlike their study, we observed changes in D4 receptor expression (22).
5.1. Limitations
Various factors influence mRNA expression, including genetics, age, gender, and diet. Additionally, expression levels can vary in women due to cyclical conditions. These factors should be considered in future research. Moreover, gene expression is influenced by multiple factors, and future studies are advised to employ not only questionnaires but also interviews. Based on the findings of this study, which highlight the significant impact of genetic and acquired factors on SNS addiction, it is imperative to implement preventive measures against this type of addiction within families and educational settings, such as schools and universities.


