

1. Background
The novel coronavirus disease 2019 (COVID-19) can cause acute lung injury, resulting in pulmonary failure (1). The clinical features of COVID-19 range from asymptomatic to acute respiratory distress syndrome (ARDS) and body organ dysfunctions. The most common clinical features include fever (not in all), cough, sore throat, headache, fatigue, myalgia, and breathlessness (2). However, these symptoms are indistinguishable from those of some other respiratory infections, such as H5N1 influenza A. Besides, some patients with COVID-19 may develop pneumonia, respiratory failure, and even death after one week (3, 4).
According to the World Health Organization (WHO), China’s National Health Commission (NHC), and the United States’ Centers for Disease Control and Prevention (CDC), the time from exposure until the development of symptoms, that is, the incubation period of the virus, is estimated to be 2 - 14 days (5), although it can extend beyond 14 days in some cases. In 97.5% of infected cases, the symptoms appear within 11.5 days, while less than 2.5% of patients are symptomatic within 2.2 days. For high-risk exposures, the estimated mortality rate is 21.2 per 10,000 people over a seven-day monitoring period (6, 7).
Severe acute respiratory syndrome (SARS)-coronavirus (SARS-CoV) causes a mild but prolonged disease. This infection is contagious, even when the patient is minimally symptomatic or asymptomatic; also, some patients are susceptible to reinfection (8). One of the most challenging aspects of COVID-19 is that a newly infected individual shows diagnosable symptoms, such as body temperature (Tb) rise, several days after contracting the disease. Nonetheless, in the early phase of infection, an unaware and undiagnosed individual can spread the virus to others. Therefore, early diagnosis of COVID-19 is of great significance for healthcare professionals, as well as the general population.
This study aimed to develop a simple yet practical model for the early diagnosis of COVID-19. Assuming that all other factors are constant, the mass balance was performed on the lungs to relate any sudden changes in the O2 or CO2 composition of the exhaled gas to the O2 consumption rate, which is an early indicator of lung dysfunction due to infection. Besides, the HYSYS chemical process simulator was used to perform more accurate mass and energy balances on the lungs and determine the effect of infection on another function of the respiratory system, that is, body cooling. In our calculations, the Tb was set constant at 37°C. Finally, the effects of ambient temperature (T0), pressure, and relative humidity (RH) were examined on the O2 consumption and respiratory heat loss rates.
The algebraic equations, based on the simplifying assumptions in our model, revealed that measuring the O2 or CO2 composition of exhaled gas using a non-invasive and inexpensive device at home allows for the early diagnosis of viral infection, and therefore, its prevention. For instance, a MedGraphics CPX/D cardiorespiratory gas exchange system, along with disposable PreVentTM pneumotach to prevent cross-contamination between measurements, can measure the exhaled gas composition, calibrated to each individual's health status, diet, and environmental conditions; also, by coupling this system with a cell phone application, it can be made available to the public. This is particularly important for highly infectious coronaviruses, which are currently being diagnosed using more costly methods, such as blood tests and X-rays of the lungs at hospitals.
Figure 1 presents a brief list of major background factors, affecting the body function upon viral infection. Our model can be further elaborated for early diagnosis and identification of interventional strategies to control the outbreak of COVID-19. Moreover, the effects of environmental conditions, such as temperature and RH, on the viral transmission rates are discussed.

Major background factors affecting the body function upon COVID-19 infection
2. Objectives
This study was conducted to model the respiratory system for developing an early intervention of COVID-19 and its transmission. This interdisciplinary study also aimed to highlight the actual effects of high temperature and high RH on increasing the virus transmission rates, as opposed to the generally accepted hypothesis of decreased coronavirus stability under these conditions.
3. Methods
The dry air we breathe in is normally composed of 21% O2 and 79% N2 at T0 and pressure. The exchange of O2, CO2, and H2O in our lungs saturates the air with moisture from the lung tissue at Tb, leading to a typical exhaled air composition of 75% N2, 16% O2, 4% CO2, and 5% H2O (9, 10). The oxygen consumption rate was calculated by measuring the volumetric flow rate and the O2 content of inhaled and exhaled air:
V, oxygen consumption volumetric flow rate (L/min); y, molar composition.
While the consumed oxygen is used for the oxidation of carbohydrates and fats from foods, proteins are used for purposes other than meeting our energy requirements. A convenient expression in metabolic calculations is the respiratory exchange ratio (RER), defined as the ratio of carbon dioxide production to oxygen consumption:
RER, Respiratory exchange ratio.
For a given diet consisting of a mixture of fats and carbohydrates, the RERs of 1.0 and 0.707 are approximated for carbohydrates and fats, respectively, according to well-known oxidation reactions (10, 11):
Assuming that a person's diet consists of xCH mole fraction of carbohydrates and (1-xCH) mole fraction of fat, the average respiratory exchange ratio was estimated as follows:
xCH, carbohydrate mole fraction in diet.
The released energy provides the minimum energy required for the maintenance of the body's vital functions, i.e., the basal metabolic rate, kcal/h (BMR) and mechanical work; if there is extra energy, it will be stored as fat. Assuming that there is no fat storage, the energy equivalent of consumed food was approximated as follows:
EE, energy expenditure rate (kcal/h).
The BMR is a function of a person's age, gender, general health status, and body surface area, correlated with weight and height (12). The energy expended internally (BMR) must be ultimately released as heat through respiration, radiation, and conduction, to maintain a constant Tb. The heat loss through respiration is divided into two parts: (1) sensible heat loss to increase the inhaled ambient air temperature to Tb; and (2) latent heat loss to increase the inhaled air humidity from ambient to saturated (100% RH) inside the lungs; therefore, we have the following equation:
Qloss,resp, heat loss rate through respiration (kcal/h).
Cp, heat capacity at constant pressure (kcal/mole.K); ΔHvap,H2o, heat of water evaporation (kcal/mole); F, molar flow rate (mole/h).
Where Cp,air and ΔHvap,H2O denote the air heat capacity at constant pressure and heat of water evaporation at constant Tb, respectively.
A person with COVID-19 is expected to experience a gradual decline in the lung capacity for exchanging O2, CO2, and H2O, and therefore, has decreased oxygen consumption rates. Because of decreased body cooling through respiration, the increased Tb is followed by a well-developed infection. Under normal conditions, about 14% of the body’s total cooling is accomplished through respiration (13). Also, 70% of energy gain from food consumption is expended to provide BMR. Therefore, regardless of the effect of a person’s specific BMR, typically, 10% of energy expenditure from food consumption is lost through respiration; this percentage is subject to change with exercise, diet, and ambient conditions. If the background factors remain unchanged, a significant deviation of this rate from the normal level can be regarded as an early sign of viral infection. Therefore, mass and energy balances on the lungs can detect changes in the body function in the early phase of infection.
Figure 2 presents a simple schematic representation of major material streams crossing the lungs boundaries. The inspired air at T0, pressure, and RH was warmed and saturated with moisture from the lung tissue, along with O2 and CO2 exchanges from food consumption in the stomach and intestines.

A schematic representation of major material streams crossing the lung boundaries.
Before performing mass balances on the lungs, the inhaled air flow rate must be determined based on the breathing rate and lung volume:
Despite variations in the breathing rate and lung capacity of different people under different conditions, we used the typical values of 12 breaths per minute and 0.5 L of air per breath for a resting body. Therefore, the inhaled air flow rate was measured as follows:
F, Molar flow rate, mole/h.
For a given diet mixture, the CO2 production rate was obtained from the respiratory exchange ratio, multiplied by the oxygen consumption rate:
Moreover, mole balances on the lungs were performed according to Figure 2:
Where for an ambient temperature of T0, ambient pressure of P0, and relative humidity of RH, we have:
P0, ambient pressure (Pa); PH2O, water vapor partial pressure (Pa).
The water vapor partial pressure for saturated ambient air was measured by the Clausius-Clapeyron equation:
Also, water composition in exhaled air was calculated at body temperature of Tb = 37ºC and relative humidity of RH=100%:
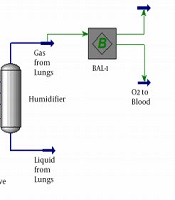
To perform more accurate mass and energy balances on the lungs, the Aspen Hysys software was used to simulate the process of respiration, as shown in Figure 3. The feed stream represents the inspired air at T0, pressure, and RH. The ambient air was heated to Tb in a heater, and the sensible heat loss was calculated. The warm humid air was then saturated with water in a vessel, which facilitated evaporative (latent) heat loss at constant Tb. While the bottom liquid stream of this unit had no flow rate (added only to fulfill the software requirements), the top gas stream from the lungs was divided by a mass balance operator into two streams, i.e., exhaled air and consumed O2.

The Aspen Hysys simulation of the lungs for the respiration process.
4. Results
In Figure 4, the ratio of heat loss by respiration to energy expenditure from food consumption (Qloss,resp/EE) and the oxygen conversion fraction (FO2,cons/FO2,in) versus the exhaled air O2 composition (yO2,out) by performing mass and energy balances on the lungs are shown by dashed and solid curves, respectively. Also, Figure 5 illustrates the effects of T0 and RH on heat loss through respiration versus the exhaled air O2 composition.
.")
Dashed curve, ratio of heat loss through respiration to energy expenditure from food consumption versus exhaled air O2 composition; Solid curve, oxygen conversion fraction vs. exhaled air O2 composition (constant parameters: Tb = 37ºC; T0 = 20ºC; P0 = 1 atm; RH = 50%; xCH = 0.5).
 and relative humidity (RH) on heat loss through respiration (constant parameters: T<sub>b</sub> = 37°C; P<sub>0</sub> = 1 atm; xCH = 0.5).")
The effects of ambient temperature (T0) and relative humidity (RH) on heat loss through respiration (constant parameters: Tb = 37°C; P0 = 1 atm; xCH = 0.5).
5. Discussion
A viral infection is expected to decrease the O2 and CO2 exchange rates in the damaged lungs. Due to the decreased oxygen consumption rates, exhaled air has an higher-than-normal O2 composition and a less-than-normal CO2 composition. In other words, upon viral exposure, the increased O2 composition of exhaled air can be an early indicator of viral infection. Besides, less efficient lungs lead to higher-than-normal CO2 blood concentration, and therefore, a lower blood pH. More severe symptoms, such as increased Tb, are assumed to appear after lung dysfunction. According to the dashed curve in Figure 4, the slope of the ratio of heat loss to energy expenditure increases at higher O2 compositions of exhaled air. It should be noted that the curves in Figure 4 are independent of the air inhalation rate (i.e., breathing rate × lung volume).
The sensitivity analysis showed that the diet and ambient conditions had insignificant effects on the oxygen consumption. However, the ratio of heat loss through respiration to energy expenditure increased by decreasing the T0, pressure, and RH. As shown in Figure 5, at temperatures above Tb, negative sensible heat loss is encountered. Consistent with the literature (14), an atmosphere of high RH could lead to the reverse transfer of water vapour from the atmosphere to the lungs and its condensation inside the lungs, making breathing difficult.
Moreover, the rate of heat loss through respiration is more sensitive to environmental conditions at higher O2 concentrations of exhaled air when the lungs are negatively affected by the viral infection. Therefore, a very hot and humid environment contaminated with the coronavirus is highly infectious, although previous findings on SARS-CoV showed better survival at low temperatures and in low-humidity environments (15, 16). Therefore, the contradictory effects of temperature and RH on the viral transmission rates and virus stability should be further examined in future studies.
Each of the simplifying assumptions adopted to develop the model indicated one limitation of this modeling study. In our model, the Tb was set constant at 37°C, assuming that an increase in Tb is a delayed symptom in those with well-developed infections. Also, the role of background factors affecting the body function, such as personal health status, diet, and environmental conditions, must be distinguished from the symptoms of a viral infection. Therefore, this model must be customized according to these factors (Figure 1). However, the effect of environmental factors on the virus mass transfer rate to the respiratory system was not examined in this study. Besides, further elaborate mathematical models of the respiratory system that consider the effects of environmental factors on the virus heat and mass transfer rates are recommended. Moreover, measurement of change in the oxygen composition in the exhaled gas can be considered as an indicator of the extent of virus damage to the lungs, and therefore, can be used for designing drug delivery systems.
5.1. Conclusion
Based on the results, performing material and energy balances on the lungs relates the individual's oxygen composition in exhaled air to oxygen consumption fraction and heat loss rate through the respiratory system. A higher-than-normal oxygen concentration in exhaled air can be regarded as a sensitive indicator of coronavirus activity in the lungs. An important implication of our model was to assist healthcare professionals, as well as non-expert individuals, to monitor minor changes in the respiratory system in the early phase of infection before a detectable Tb increase occurs in those with well-developed infections. Overall, evaluation of a range of T0 and RH corresponding to different weather conditions suggests that very hot and humid environments are highly infectious, despite previously reported findings on decreased coronavirus survival under these conditions. In conclusion, development of an individual- and climate-specific cell phone application, which considers all of the influential factors in oxygen consumption and body heat loss, can facilitate the diagnosis and early intervention of COVID-19.
