1. Background
The members of the family Coronaviridae are characterized by single-stranded positive-sense RNA genome. They have been named so owing to the resemblance of the structure of virions to a “crown” under the electron microscope (1, 2). Their genome size ranges from 26 to 32 Kb in length and exhibits a wide range of hosts from birds to mammals (3-5). However, their extension to humans as hosts is a recent phenomenon wherein it mostly causes mild respiratory and gastrointestinal problems (6). Some of the earlier known exceptions to this include severe acute respiratory syndrome (SARS) coronavirus in 2002 and Middle East respiratory syndrome (MERS) coronavirus in 2012 (7, 8). A novel human infecting Coronavirus, SARS-CoV-2 was identified from Wuhan, China in December 2019 (9). It exhibited extremely high transmission rates, and patients were reported to suffer from high fever and invasive lesions in lungs (10, 11). As of 11th July 2021, there have been 187,419,263 reported cases and 4,045,647 deaths worldwide (www.worldometers.info/coronavirus/). Of these, 3,08,37,222 cases and 4,08,040 deaths have been reported in India, making it one of the most affected countries in the world (www.mygov.in/covid-19).
Microsatellites or simple sequence repeats (SSRs) are 1 - 6 bp repeat motif sequences present across prokaryotic and eukaryotic genomes with various clinical implications besides being tools for conservation and evolutionary studies (12). Owing to their polymorphic nature and rapid detection protocols, they have been used for multiple plant and animal biotechnological applications (13). These polymorphisms, aided by copy number variations, can act as sites for natural selection and thereon be responsible for evolution (14). This has been studied at different levels of organisms. The study closest to humans reported a persistently smaller number of repeats across all microsatellites in Chimpanzees compared to humans (15). The fact that these sequences can leave an imprint on human evolution makes it worthwhile to assess the impact on viral genomes.
Our previous studies have implied a unique genome signature for each viral genome with implications in the host range as well (16-19). The viral genome provides a very apt candidate to study microsatellites due to their relatively small size, rapid evolution, and simplistic genome features. These SSRs are sources of variations in the genome due to strand slippage and recombination, which can impact different cellular processes like gene expression, chromatin organization and DNA replication (20).
2. Objectives
In the present study, we analyzed the Coronavirus genomes for incidence, distribution, and complexity of SSRs patterns to understand their role in host divergence and evolution.
3. Methods
3.1. Genome Sequences
As per the classification of International Committee of Taxonomy of Viruses (ICTV) prior to the emergence of SARS-CoV-2, Coronaviruses belonged to Nidovirales order, Coronaviridae family, and Coronavirinae subfamily. From the genera Alphacoronavirus (12 species), Betacoronavirus (12 species), Gammacoronavirus (3 species), Torovirus 1 (species), Bafinivirus (1 species), and others (3 species) were included in the study. Their full-length genomes were extracted from National Center for Biotechnology Information (NCBI) (https://www.ncbi.nlm.nih.gov/). The rest of the listed species at ICTV were not included in the study because either their full-length genome sequences were not available or due to the absence of their annotation, which was required to assess the distribution of SSRs across coding and non-coding regions. Further, the SARS-CoV-2 sequence from Wuhan, China, was included in the study for comparative purposes. The details of all the sequences used in the study are summarized in supplementary file 1. Though there have been some updates in Coronavirus since the SARS-CoV-2 pandemic, we have used the species as per earlier classification because we aimed to understand what led to the emergence of SARS-CoV-2.
3.2. Microsatellite Extraction
Extraction of microsatellites was done using imperfect microsatellite extractor (IMEx) in “Advanced Mode” with parameters as reported for human immunodeficiency virus (HIV) (21, 22). IMEx can extract microsatellites with repeat motifs of 1 - 6, and hence the present study ranges from mono- to hexa-nucleotide repeat motifs only. The conditions set were type of repeat: Perfect; repeat size: All; minimum repeat number: 6 (Mono), 3 (di), 3 (Tri), 3 (Tetra), 3 (Penta), 3 (Hexa). We also included the study of compound SSR (cSSR), which includes two or more SSRs separated by a distance of dMAX, which was set at 10bp in the study. Since SSR extraction forms the backbone of the study, we cross-checked our extracted SSRs with another software Krait (23), and found the results to be the same as IMEx (Data not shown).
3.3. Statistical Analysis
The extracted raw data were edited on the spreadsheet using data Analysis ToolPak of MS Office Suite v2016. The data for SSR incidence and localizations, along with computation of certain parameters like relative abundance [RA] and relative density [RD], were sorted using Microsoft Excel 2016. Herein, RA: Number of microsatellites present/kb of the genome and RD: Sequence composed of SSRs/kb of the genome.
3.4. SSR Distribution Across Coding Regions
The IMEx results give the start and end position of the SSRs, whereas the NCBI annotation provides for localization of the genes/coding regions on the genome. The incorporation of SSRs location into the gene is done through incorporation of gene location in SSR file (IGLSF) tool developed by our research group (16).
3.5. Phylogenetic Tree Construction
The construction of phylogenetic tree was performed by aligning the nucleotide sequence with the default parameter of MAFFT v6.861b (24), and the alignment was trimmed by gappyout algorithm of trimAl v1.4.rev6 (25) using the function "build" of ETE3 v3.1.1 (26) as implemented on the GenomeNet. We used pmodeltest v1.4 to select evolutionary model that best fits the alignment. The Maximum-Likelihood tree was inferred using RAxML v8.1.20 of the GTR+GAMMA+I model with default specifications (27). The precision of each node of the tree was evaluated using 100 replicates of bootstrap. Graphing of the phylogenetic tree with iTOL (28).
3.6. Heat Map of the Studied Genomes
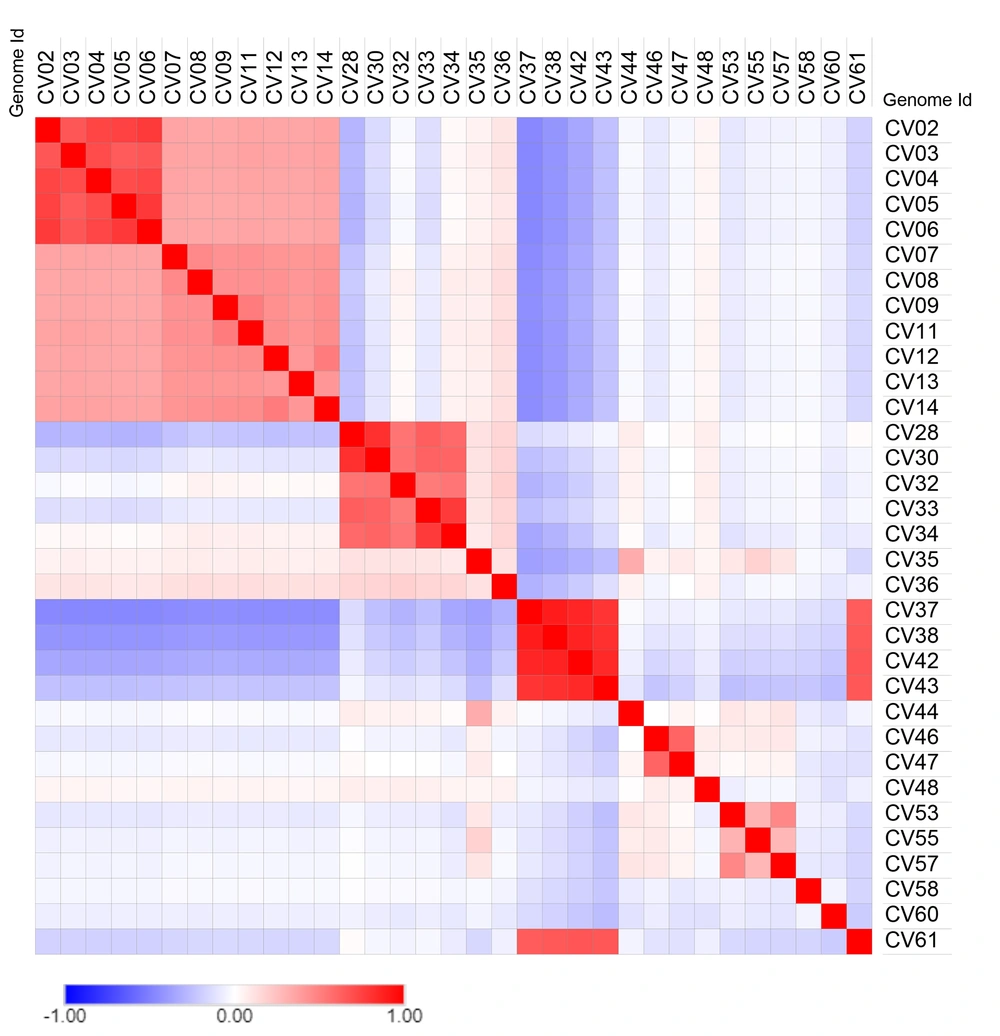
Pairwise sequence similarity percentages were calculated with an equation SIM%= 100 x (identical position / length of MSA) and unchecked similarity amino acid grouping options using the SIAS server from previously aligned multiple sequences. Multiple sequence alignment was performed using MAFFT (v7, online) with default parameter. The matrix of the similarity percentage was transformed using Morpheus web tool to heat maps with Euclidean distance and Pearson correlation metrics (24, 29).
4. Results
4.1. Genome Features
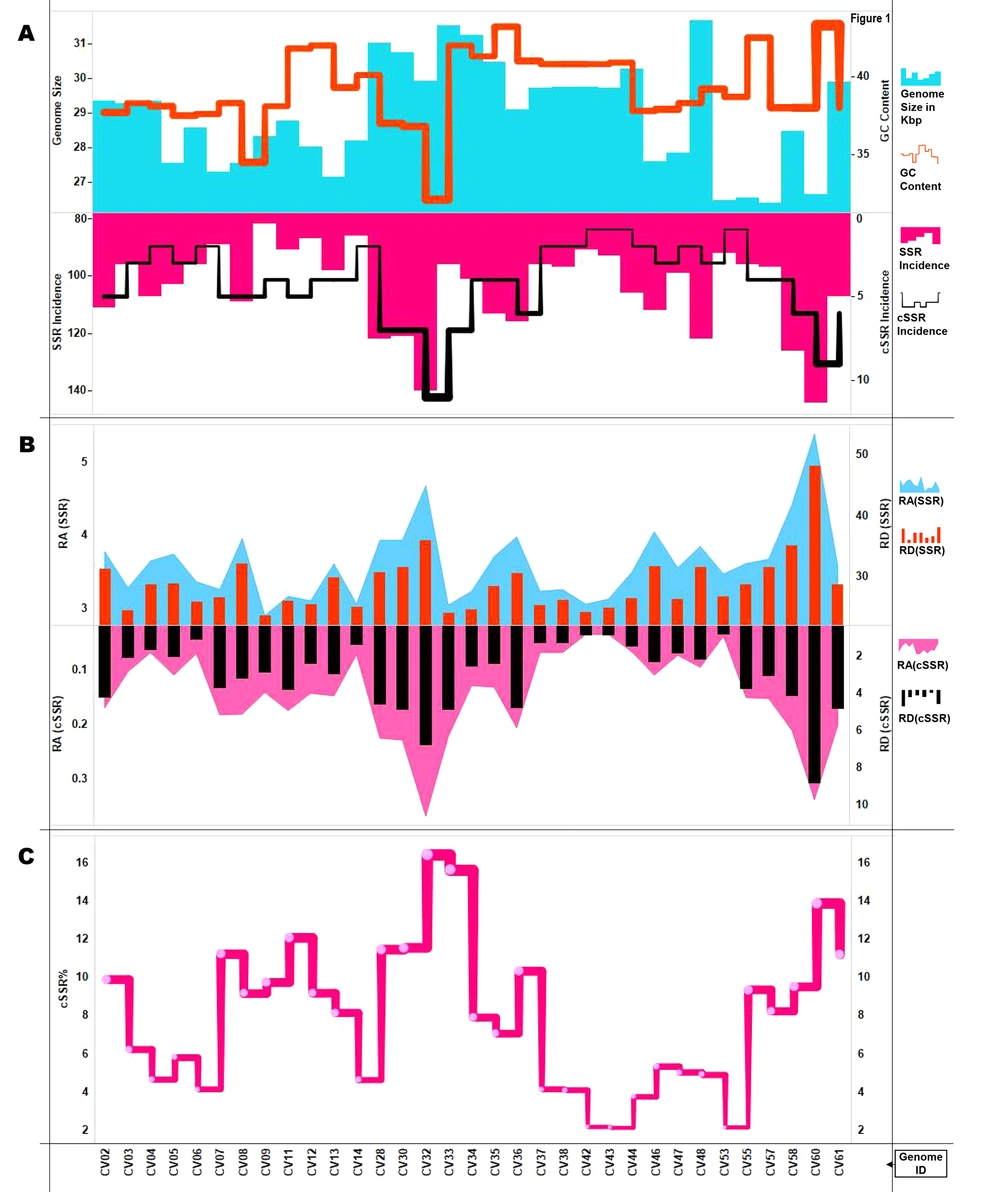
The genome size ranged from around 26,396 bases (CV57) to 31,686 bases (CV48), with an average genome size of 27.6 Kb. The GC% composition ranged from 32.1% (CV32) to 43.2% (CV35) with an average of 39% (Figure 1A). A total of seven species, including CV61 (SARS-CoV-2) have humans as reported hosts. The other hosts included cows, bats, rats, birds, dogs, cats, and fishes (Figure 1A, supplementary files 1 and 2).
Summary of SSR and cSSRs and cSSR% extracted in this study. A, Genome features (Genome size and GC content) and SSR/cSSR incidence across studied genomes. B, Relative abundance and relative density of SSRs and cSSRs. C, cSSR% (percentage of SSRs present as a part of cSSR) across genomes. The incidence and distribution of SSRs follows no pattern across genomes as indicated by the varying peaks of the graph.
4.2. Incidence of SSRs and cSSRs
A total of 3,442 SSRs and 136 complex sequence repeats (cSSRs) were extracted from the studied 33 genomes. CV61 (SARS-CoV-2) had 107 SSRs and six cSSRs. The SSR incidence ranged from 82 (CV09) to 144 (CV60) with corresponding tract sizes of 667 and 1,284 bases, respectively. Five species had an incidence of 96 SSRs (CV03, CV06, CV33, CV37, and CV55), and their tract size varied from 716, 738, 759, 754, and 762 bases, respectively (Figure 1B, supplementary files 1 and 2).
The cSSR incidence ranged from 1 (CV42, CV43, CV53) to 11 (CV32). The species with a single cSSR had very similar SSR incidence and 91, 93, and 92, respectively (Figure 1A). This gives an initial impression that SSRs clustering happens only after a certain level of incidence has been achieved. However, a closer inspection of the data reveals contrasting facts. CV07, CV09, CV11, and CV12 with 89, 82, 91, and 87 SSRs have 5, 4, 5, and 4 cSSRs, respectively. On the other hand, CV05, CV46, and CV48 with 103, 112, and 122 SSRs have just three cSSRs, respectively (Figure 1A, supplementary files 1 and 3).
In order to understand how the clustering of SSRs behaves in the overall genome, we extracted cSSRs by increasing dMAX to 20, 30, 40, and 50. The limit of 50 was used as its maximum allowed value of dMAX in IMEx and also because beyond that the cSSRs as an entity loses its relevance (Supplementary file 3). The cSSR incidence expectedly increased with increasing dMAX, but the enhancement again failed to entice a pattern reaffirming the uniqueness of SSR genome signature.
4.3. Relative Abundance, Relative Density and cSSR%
Relative abundance (RA) is the number of microsatellites present per Kb of the genome and is a measure of SSR distribution. It was calculated as RA = Incidence of SSRs/Size of genome (Kb). It ranged from 3.04 (CV09:82 SSRs) to 5.4 (CV60:144 SSRs). The average was 3.61, and CV61 (SARS-CoV-2) was pretty close at 3.57 (Figure 1B, supplementary file 1). Relative density (RD) is the sequence composed of SSRs per Kb of the genome and was calculated as RD = Total length covered by SSRs (bp)/Size of genome in Kb. RD for SSRs ranged from 23.5 (CV09) to 48.16 (CV60), with an average of 28.8. RD for SSRs in CV61 (SARS-CoV-2) was 28.7 (Figure 1B, supplementary files 1 and 2). Similarly, the values for RA and RD for cSSR were calculated. The minimum and maximum RA values of cSSR were 0.033 (CV42, CV43) to 0.37 (CV32). The corresponding range for RD for cSSR was 0.79 (CV53) to 8.85 (CV60). The cSSR RA and RD values for CV61 (SARS-CoV-2) were 0.2 and 4.8, respectively (Figure 1B, supplementary files 1 and 3).
Another aspect of SSR and cSSR interrelation is cSSR%. This was calculated as a percentage of SSRs being a part of cSSR. It is summarized in Figure 1C. Overall, 281 SSRs (8.2%) were present as a part of cSSRs. The cSSR% ranged from 2.15 (CV43) to 16.4 (CV32) and an average of 7.9. If all the genomes followed a universal rule, then a higher cSSR incidence would be accompanied by higher cSSR%. In other words, the more the cSSRs, the greater the chance for SSRs coming together as cSSR. This does happen, but not in a linear manner. For instance, CV28 (122 SSRs), CV30 (121 SSRs). and CV33 (96 SSRs) have seven cSSRs each, but their corresponding cSSR% is 11.5, 11.6, and 15.6, respectively. Thus, a lower SSR incidence can also lead to higher cSSR% with the same cSSR incidence (Figure 1C, supplementary files 1 and 3). This assumes significance as higher SSR density will enhance the polymorphic nature of the genome, thereby fastening evolution (12-14). Hence, some genomes are primed to evolve faster than others.
4.4. Repeat Motif Prevalence as per Size and Their Composition
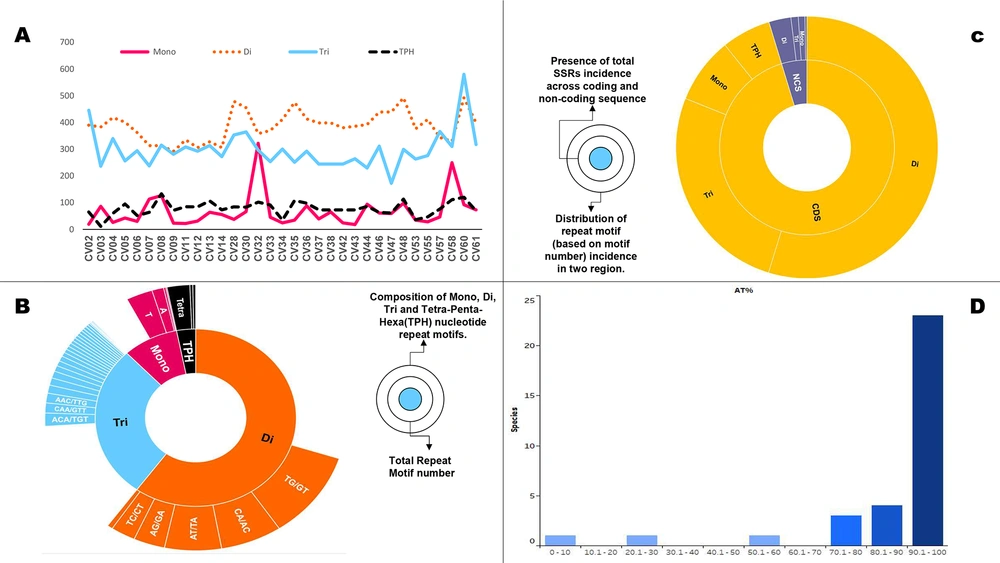
Subsequently, we assessed the prevalence of SSRs, according to their repeat motif size. Mono- to tri-nucleotide repeat motifs accounted for over 98% (3383) of the extracted SSRs; hence we focused on these primarily. The individual contribution of mono-, di-, and tri-nucleotide motifs was 311, 2086, and 986 SSRs, respectively. This pattern was preserved across genomes, with di-nucleotide motifs being the most prevalent, followed by tri- and mono-nucleotide motifs (Supplementary file 1).
We thereon plotted the cumulative SSR contribution of each motif size across genomes wherein, again the trend is followed albeit with a few exceptions. First, CV02, CV08, and CV60 contribute more to the genome SSR composition through tri-nucleotide motifs in spite of higher incidence of di-nucleotide motifs. Secondly, CV32 is the only genome with a higher contribution of SSRs tract size from mono-nucleotide repeat motif than tri-nucleotide motif (Figure 2A). These variations constitute the essence of genome SSR signature.
However, the contribution of repeat motifs to genome function and evolution is dependent on not only its repeat motif size but also composition (30-33). We also looked at the motif composition of extracted SSRs. In the di-nucleotide repeats, TG/GT was most represented with an average of 19 per genome. This was followed by CA/AC with an average incidence of 17 (Figure 2B, supplementary files 1 and 2). In tri-nucleotide SSRs, ACA/TGT was the most represented motif, followed by CAA/GTT, whereas in mono-nucleotide SSRs, T was the most observed nucleotide, followed by A (Figure 2B, supplementary files 1 and 2). This can partly be attributed to the fact that C/G mono-nucleotide repeats are more unstable that A/T repeats (34). Furthermore, their association with transcriptional slippage, codon bias and various diseases in other genomes makes it interesting for viruses as well (35-37).
Nucleotide composition of the incident SSRs. A, SSRs (Mono- to Tri-nucleotide repeat) coverage in genomes. Note the maximum contribution by di-nucleotide motifs across genomes with few exceptions (CV02, CV08, CV60). B, Prevalent motif constituents across mono-, di- and tri-nucleotide motifs. C, SSRs distribution across coding and non-coding regions. D, Distribution of genomes on the basis of mono-nucleotide contribution from A/T region (here shown as AT%). The highest incidence of di-nucleotide repeats makes genome susceptible to variations while motif composition is inclined towards A/T irrespective of size probably due to genome composition.
4.5. Microsatellites in Coding Region
A total of 3,236 SSRs (94%) were localized to the coding region of which 1,806 were present in the polyprotein that encodes for RNA dependent RNA polymerase (RDRP), which was distantly followed by spike protein/glycoprotein with 174/159 SSRs (Figure 2C, supplementary file 1). In order to differentiate between genes of the studied genomes in terms of SSR incidence, we looked into the SSR density (number of SSRs per kb) of individual genes for the genomes. The highest and lowest SSR density in a gene-specific manner has been shown for all these studied genomes in Table 1. The details are represented in supplementary file 4. Non-structural protein has the highest SSR density in all viral genomes with bird as hosts. For those viruses which had humans as hosts, no such pattern was observed. However, spike or surface glycoprotein pivotal for entry into the host cell had the least SSR densities for the incident genomes.
| S N | Genome ID | Gene with Highest SSR Density | SSR Density | Gene with Lowest SSR Density | SSR Density |
|---|---|---|---|---|---|
| 1 | CV32 | Small membrane protein | 12.04819 | Nucleocapsid phosphoprotein | 1.508296 |
| 2 | CV28 | ORF1ab polyprotein | 4.134367 | ||
| 3 | CV30 | Hemagglutinin-esterase | 6.27451 | Membrane protein | 1.443001 |
| 4 | CV36 | Hypothetical protein | 6.582885 | Spike glycoprotein | 2.875817 |
| 5 | CV02 | Non-structural protein 3a | 12.65823 | Membrane protein | 2.487562 |
| 6 | CV08 | Membrane protein | 4.405286 | Protein 3 | 1.474926 |
| 7 | CV04 | Putative 3a protein | 13.88889 | Matrix protein | 2.534854 |
| 8 | CV61 | Orf10 | 17.09402 | Membrane protein (M) | 1.494768 |
| 9 | CV44 | Small membrane protein | 12.04819 | Membrane glycoprotein | 1.515152 |
| 10 | CV05 | Non-structural protein 7 | 8.438819 | Spike protein | 2.180431 |
| 11 | CV13 | Hypothetical protein | 17.3913 | Spike glycoprotein | 3.542958 |
| 12 | CV57 | Nonstructural protein | 14.49275 | Membrane protein | 1.529052 |
| 13 | CV03 | N protein | 5.30504 | Membrane protein (M) | 1.262626 |
| 14 | CV06 | Non-structural protein 3a | 13.88889 | Non-structural protein 3b | 2.721088 |
| 15 | CV33 | Envelop protein (E) | 3.745318 | Membrane protein (M) | 1.455604 |
| 16 | CV55 | Nonstructural protein | 6.116208 | Nucleocapsid phosphoprotein | 1.888574 |
| 17 | CV53 | Nonstructural protein | 20.83333 | Nucleocapsid phosphoprotein | 0.952381 |
| 18 | CV11 | Envelope protein | 8.888889 | Nucleocapsid protein | 0.788022 |
| 19 | CV07 | Envelope protein | 12.82051 | Surface glycoprotein | 1.703578 |
| 20 | CV14 | Envelope protein | 4.329004 | Putative ORF3 | 1.481481 |
| 21 | CV09 | Spike protein | 3.149225 | Nucleocapsid protein | 0.854701 |
| 22 | CV58 | Hemagglutinin esterase | 5.555556 | Nucleocapsid phosphoprotein | 3.968254 |
| 23 | CV60 | Putative nucleocapsid protein | 8.230453 | Putative membrane protein | 1.461988 |
| 24 | CV48 | Orf 9 | 8.714597 | ORF 5c | 1.893939 |
| 25 | CV46 | 5b protein | 12.04819 | Membrane protein | 2.949853 |
| 26 | CV12 | Nucleocapsid protein | 5.279035 | Spike protein | 2.16763 |
| 27 | CV35 | Small membrane protein | 20.08032 | Membrane glycoprotein | 1.508296 |
| 28 | CV34 | Membrane protein | 5.822416 | Hemagglutinin-esterase | 0.757576 |
| 29 | CV47 | ORF 5b | 8.032129 | N protein | 2.439024 |
| 30 | CV38 | Protein (E) | 8.658009 | Orf1ab polyprotein (Pp1ab) | 2.827388 |
| 31 | CV37 | E protein | 8.658009 | Nonstructural polyprotein Pp1ab | 2.827388 |
4.6. Mono-nucleotide Repeat Motif Exclusivity for Hosts
CV61 (SARS-CoV-2) had identical SSR incidence of 107 with CV04 (Feline coronavirus type II). Also, there was no consensus if we compared the SSR incidence for viruses with humans as hosts. Of the six studied species with humans as hosts, three had a higher SSR incidence (CV08:109, CV30:121, CV32:140), while three had lower incidence (CV07:89, CV37:96, CV42:91). Thus, we can say that SSR incidence is not directly associated with host per se. Similarly, the corresponding cSSR incidence, which is representative of SSR clustering also did not reveal any pattern in the six species and was highly divergent from 1 to 11. CV61 (SARS-CoV-2) had six cSSRs (Supplementary file 1).
4.7. Phylogenetic and Similarity Analysis
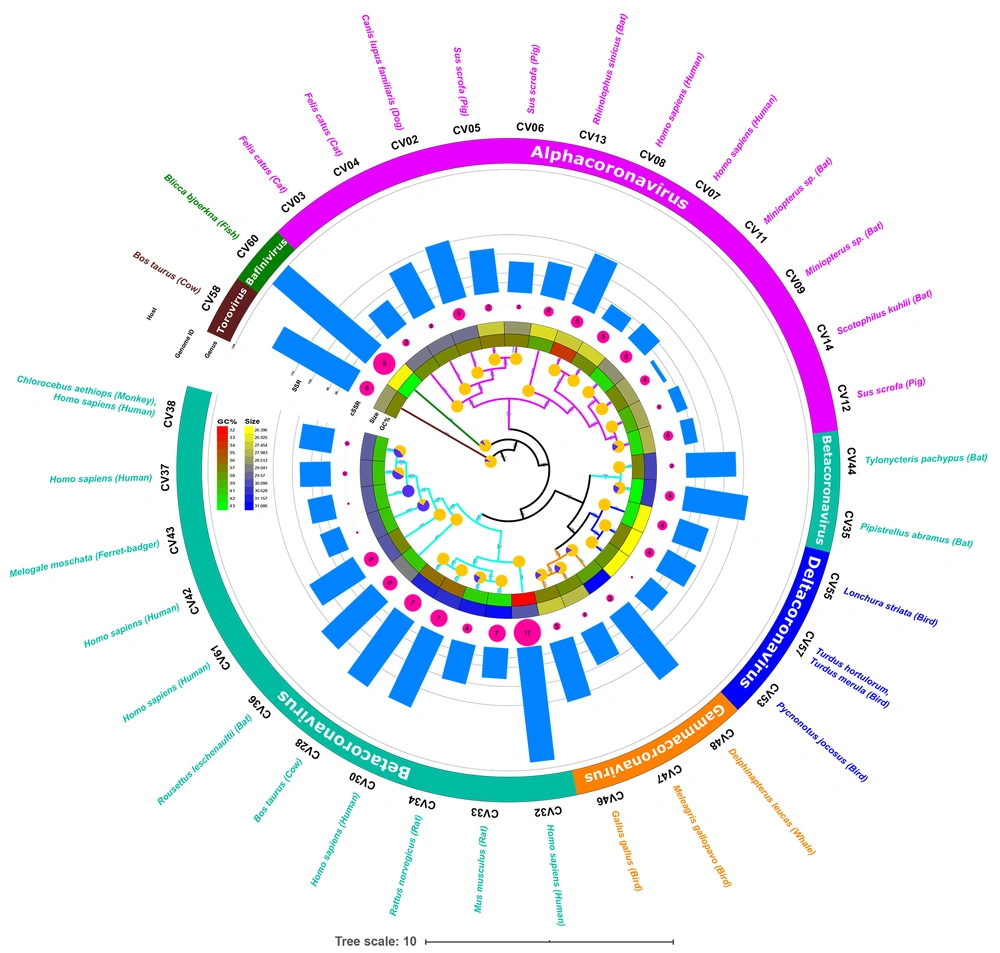
The phylogenetic analysis of the genomes was subsequently performed to understand the evolutionary aspects. The phylogenetic tree has been represented along with genome features and extracted SSR data in Figure 3. The phylogenetic path in the innermost layer is marked by blue/yellow circular representation of mono-nucleotide distribution. Complete yellow circles represent all mono-nucleotide repeats in the A/T region. The species which had mono-nucleotide repeats in G/C region are represented by blue color in the circles. Such genomes are present in different genera but clustered to each other. A similar distribution is observed for the species with known human hosts.
Whether or not the phylogenetic tree is a true representation of sequence similarity was accessed through constructing heat map, as shown in Figure 4. Sequences together in the phylogenetic tree do reflect a higher degree of similarity in the heat map. For instance, CV37, CV38, CV42, and CV43 of Betacoronavirus exhibit similarity and are placed adjacently in the heat map. Other sequences also follow the same pattern reaffirming the evolution path of the phylogenetic tree.
5. Discussion
The difference in SSR incidence can be attributed to two aspects. First, variation in copy number of repeat motifs because of more copies of a motif that is present at site in one genome compared to another. Secondly, the size of repeat motifs since if one genome has more tri-nucleotide motifs compared to other di-nucleotide motifs, the former will have a higher tract size for the same number of SSRs. Further, the failure of cSSRs incidence to conform to a rule is a pattern in itself for viral genomes and has been reported earlier as well (16, 17, 19, 38). Thus, each genome carries a unique SSR signature which assumes significance owing to its influence on gene function and genome evolution. If we can understand the underlying message for this SSR signature, predicting and understanding viruses will be easier.
Generally speaking, a higher value of RA will be accompanied by an increase in RD as is clearly observed in Figure 1B. These figures are an average representation of the SSRs of individual genomes. Though their values are in tandem with each other for a genome, they do not necessarily corroborate with SSR/cSSR incidence values. A case in point, CV32, has the highest RA value of cSSR of 0.37 with 11cSSRs, whereas CV60 has maximum RD of 8.85 with just nine cSSRs (Supplementary file 1). This can be explained by two aspects. First, CV32 has a larger genome size of 29,926 bases compared to 26,660 bases of CV60, thus the higher incidence and RA value. Secondly, CV60 has larger cSSR tract size of 236 bases (Nine cSSRs) in contrast to 203 bases (11 cSSRs) for CV32. This, when aided by a smaller genome size, gives CV60 a higher RD value. We thereon ascertained as to how CV60 encompasses more genome as cSSR with lesser incidence. Interestingly, the cSSR composition of the two genomes had one unique difference. Although CV60 cSSRs had multiple tetra- and penta-nucleotide SSR motifs, CV32 had primarily di- and tri-nucleotide SSR motifs as part of cSSR (Supplementary file 3). Thus, CV60 had a higher cSSR tract size with lesser incidence. The variations in RA and RD values indicate that genome SSR signature is unique in its incidence and distribution its composition. The highest incidence of di-nucleotide motifs makes these genomes hot spots for recombination, while tri-nucleotide motifs make them prone to protein dynamics. In the mono-nucleotide repeats, a higher prevalence of A/T repeats can be attributed to two aspects. First, a higher genome content (Average GC% being 39%), and secondly, owing to the instability of G/C repeats, there is negative selection against them. Another study has reported the incidence of AT-rich repeats in Coronavirus genomes and suggested the presence of genic SSRs in the mutation-rich regions of the genome (39). However, when only SARS-CoV-2 genomes were studied, the SSRs were found to be more or less conserved, indicating their role in genome stability (40).
The distribution of SSRs across coding and non-coding regions often exhibits a bias toward the coding region (16, 17, 19, 41). This is primarily because the genome of viruses is predominantly coding. However, the analysis is always required to give an insight into which part of the coding genome is more prone to mutation, selection, and eventually evolution. This may be accompanied by enhanced pathogenesis and virulence. The fact that two most densely populated genes in terms of SSRs (RDRP and Spike protein) are quintessential for virus infection affirms the ongoing viral evolution aided by SSRs. Also, spike protein having fewer SSRs suggests a restrictive measure on host evolution. Further, the lack of any pattern in gene SSR density conforms to unique genome SSR signature.
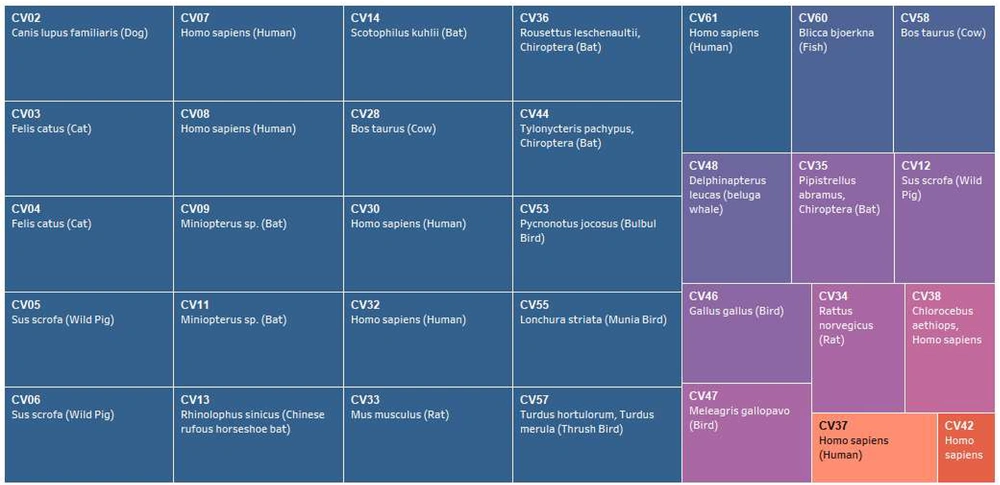
Previously, we have reported a prevalence of G/C mono-nucleotide repeat motifs (90%) in Mycobacteriophages with broad host range (16). However, the trend reverses when we analyze viruses with humans as hosts. Herein, an exclusive contribution of mono-nucleotide repeats from the A/T region has been observed in human or related species as hosts in Polyomaviruses (18). The distribution of mono-nucleotide repeats across A/T and G/C regions of the genomes studied revealed interesting results. Twenty species, including CV61 (SARS-CoV-2) exhibit mono-nucleotide repeats exclusively in the A/T region (Figure 2D, supplementary file 1). This means even a single mono-nucleotide repeat is not localized in these genomes in the G/C region of the genome. Four out of the six species with known human hosts CV07, CV08, CV30, and CV32 also follow the pattern. The two deviations to this in the study (CV37, CV42) are suggestive of multiple players in host determination, which is understandable (Figure 5). The presence of these A/T repeats in Coronavirus genomes should not be confused with poly A tailing associated with these viruses. This is because poly A addition is characterized by the presence of hexamer sequence in the genome (42). Therefore, we hypothesize that this bias in the incidence of mono-nucleotide repeats can serve as a marker for predicting the course of viral host divergence. The present study comprehensively analyzed the diversity of microsatellites across Coronavirus genomes with the perspective of SARS-CoV-2 and constant monitoring of how the accruing mutations in SARS-CoV-2 impact the SSR profile will help us evaluate the contribution of microsatellites in viral evolution.
Correlation between mono-nucleotide A/T repeat incidence and host. Studied species of Coronaviridae arranged in decreasing order of mono-nucleotide repeats (left to right, Blue representing 100% or mono-SSRs exclusive to the A/T region). The corresponding hosts are also mentioned. Since a direct relation does not exist, multiple factors deciding viral host is expected.
5.1. Conclusions
Each genome has its SSR signature, which attributes variation or stability in terms of evolution. The observed results in Coronaviruses suggest similarity as well as differences with other viruses. While no pattern of incidence and localization of SSRs in the coding region have been predominantly observed in other viral genera, the observations were deviant from others when it came to correlation with host divergence. Thus, the unique microsatellite signature of viral genomes can be a predictive and understanding tool for viral hosts’ divergence and evolution.

