

1. Background
2. Methods
2.1. Purification of Recombinant PAD4
2.2. Formulation of PLGA Nanoparticles/Microparticles
| Variants | PLGA 1 | PLGA 2 |
|---|---|---|
| Composition | 50:50 (52:48) | 85:15 |
| Molecular weight | 40000 - 75000 | 50000 - 75000 |
| Inherent viscosity, dL/g | 0.55 - 0.75 (0.61) | 0.55 - 0.75 (0.65) |
| Ester-terminated | Yes | Yes |
| Form | Amorphous | Amorphous |
| Transition temperature, °C | 45 - 50 | 45 - 50 |
2.3. Characterization of Particle Morphology
2.4. Determination of Particle Size
2.5. Determination of Antigen Content
2.6. Ethical Considerations
2.7. Evaluation of IgG Response
2.8. Statistical Analysis
3. Results
3.1. Sodium Chloride in the External Aqueous Phase Was Required to Achieve Nonporous and Spherical Microparticles
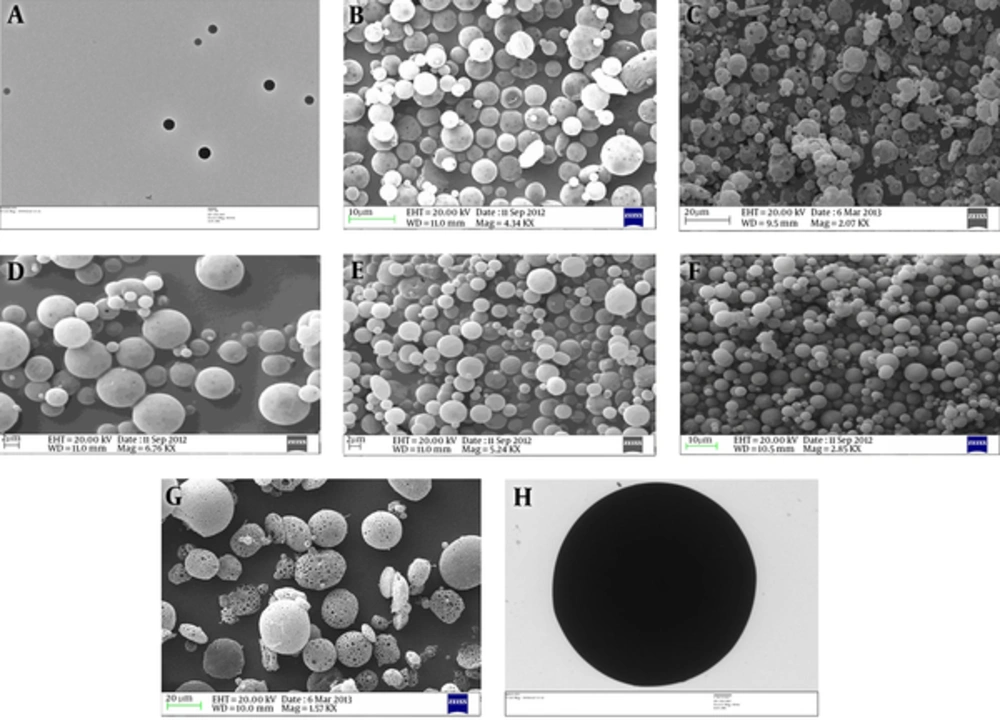
A, Transmission electron micrograph of PAD4-NP2. This figure shows that PAD4-NP2s are in the nanometer size range and spherical with a smooth surface. B, Scanning electron micrograph of PAD4-MP1. This figure shows that PAD4-MP1s are in a micrometer size range and have a porous morphology. C, Scanning electron micrograph of PAD4-MP2. This figure shows that PAD4-MP2s are in a micrometer size range and have a porous morphology. D, Scanning electron micrograph of PAD4-MP1. PAD4-MP1 was prepared using 1% NaCl in the external aqueous phase. This figure shows reduction in the porosity of PAD4-MP1. E, Scanning electron micrograph of PAD4-MP1. PAD4-MP1 was prepared using 2% NaCl in the external aqueous phase. This figure shows reduction in PAD4-MP1 porosity. F, Scanning electron micrograph of PAD4-MP1. PAD4-MP1 was prepared using 3% NaCl in the external aqueous phase. This figure shows that PAD4-MP1s are in the micrometer size range and spherical, with a smooth surface. G, Scanning electron micrograph of PAD4-MP3. This figure shows that PAD4-MP3s are in a micrometer size range and have a porous morphology. H, Transmission electron micrograph of PAD4-MP3. PAD4-MP3 was prepared using 1% NaCl in the external aqueous phase. This figure shows that PAD4-MP3 is in a micrometer size range and spherical with a smooth surface.
3.2. The Explored Methods for the Preparation of PLGA Particulates Produced Particles of Single-Peak Population with a Nanometer or Micrometer Size Range

The graph was drawn by LS 13320 software (Beckman Coulter, Inc). This figure shows that particle populations, formulated by methods 1 and 2, do not overlap. The particle populations, formulated by methods 1 and 3, also do not overlap. Particle populations, formulated by methods 2 and 3, overlap, although it is less than 20%.
| PLGA Particulate systems | Arithmetic Mean Diameter (Mean ± SD of 3 Independent Measurements), µm |
|---|---|
| PAD4NP1 (50:50) | 0.230 ± 0.084 |
| PAD4NP2 (85:15) | 0.193 ± 0.068 |
| PAD4MP1 (50:50) | 3.66 ± 1.45 |
| PAD4MP2 (85:15) | 2.96 ± 1.43 |
| PAD4MP3 (50:50) | 7.21 ± 3.16 |
| PAD4MP4 (85:15) | 6.86 ± 5.49 |
3.3. Antigen Content in PLGA Particulates Varied with PLGA Composition and Applied Methods
| PLGA Particulate Systems | Encapsulated Antigen per 10 mg of Lyophilized PLGA Particulates, µg |
|---|---|
| PAD4-NP1 (50:50) | 50 ± 0.68 |
| PAD4-NP2 (85:15) | 38.22 ± 0.7 |
| PAD4-MP1 (50:50) | 37.18 ± 0.65 |
| PAD4-MP2 (85:15) | 58.31 ± 0.86 |
| PAD4-MP3 (50:50) | 33.87 ± 0.96 |
| PAD4-MP4 (85:15) | 30.68 ± 0.76 |
3.4. PAD4-MP2 Elicited the Highest anti-PAD4 IgG Titer Among the Evaluated PLGA Particulates

The sera from immunized mice (n = 5) were collected on days 14 and 28 post-immunization. PAD4-MP2 elicited the highest level of IgG titer among the evaluated PLGA particulates. Antibody titers (Y-axis) are presented on a linear scale. Error bars indicate ± standard error (SE) of 3 experiments. ***denotes a statistically significant change (P < 0.001), as evaluated by one-way ANOVA and Tukey’s multiple-comparison test.
