


1. Background
Retinopathy of prematurity (ROP), as a vasoproliferative eye disorder, is a severe and common eye complication. ROP develops in about 64% of preterm newborns with birth weight < 1501 grams. It is the leading cause of a range of problems from visual impairment in childhood and permanent blindness (1, 2). Based on the results of a meta-analysis study that systematically reviewed 42 articles including 18,000 premature infants, the prevalence of ROP was reported to be 23.5% (95% CI: 20.4 - 26.8) in Iran. The prevalence of ROP stages 1, 2, 3, 4 and 5 was 7.9% (95% CI: 5.3 - 11.5), 9.7% (95% CI: 6.1 - 15.3), 2.8% (95% CI: 1.6 - 4.9), 2.9% (95% CI: 1.9 -4.5) and 3.6% (95% CI: 2.4 - 5.2), respectively (3).
The cause of ROP correlates to the use of supplemental oxygen therapy in preterm neonates suffering from respiratory distress. Although un-monitored treatment with 100% oxygen given in the hopes of improving the survival of neonate, it may cause more mature newborns with severe retinopathy (4). Oxygen toxicity affects the undeveloped retina and immature retinal vessels resultingin hypoxia-induced retina ischemia and detachment (5). The most typical risk factors include hyperoxemia, low birth weight in relation to weeks of pregnancy, low levels of insulin-like growth factor 1, neonatal co-morbidities like Intraventricular hemorrhage, sepsis, respiratory and heart diseases, necrotizing enterocolitis, blood infusion, lack of vitamin E, maternal complications and smoking (6, 7).
Nowadays with advanced improvement in NICUs and standards of health care systems, more extreme preterm infants are surviving with more risks related to ROP. To reduce unfavorable outcomes associated ROP, diagnosis of treatment-requiring cases in the premature newborns is of importance. Several screening strategies for ROP are published. An effective screening program is recommended by the American Academy of Pediatrics. It is stated that all neonates with birth weight ≤ 1500 g, or gestational age < 30 weeks, infants with birth weight 1500 - 2000 g and gestational age of > 30 weeks with other ROP risk factors or newborns receiving oxygen therapy for more than several days or un-monitored oxygenation, should be screened for ROP (8). The British Pediatrics and Child Health Guidelines also recommends a screening schedule for ROP in premature infants with gestational age < 32 weeks or birth weight ≤ 1501 g (9). A guideline by The Canadian Pediatric Society recommends ROP screening in preterm infants younger than 30 weeks or with a birth weight below 1500 g (10).
Different screening guidelines from different countries show some existing controversies related to gestational age or birth weight. Other investigations have also supported the necessity of some changes in present guidelines related priority of some risk factors and criteria. Moreover, because of numerous variations in regional ROP epidemiology, availability of appropriate equipment, infrastructures and skilled specialists, screening protocols need some reconsideration (10, 11).
Recently, data mining methods as valuable techniques are implemented in the health care system to include massive retrospective data, accommodate a great number of new variables and encompass a wide variety of analytical methods. Data mining techniques have been deployed to discover the implicit meaningful patterns and knowledge, use the extracted patterns for determination of disease diagnosis, prognosis, prediction algorithms models, treatment, and share the results (12, 13).
Several investigations have indicated the importance of epidemiologic factors in the prevalence of ROP (14, 15). Considering epidemiologic factors may influence the implementation of different prevention and treatment protocols in different countries.
2. Objectives
The aim of the present study was to collect ROP risk factors and predicting treatment-requiring ROP using four data mining techniques including multi-layer perceptron (MLP), Random Forest, Naive Bayes, and Decision Tree (J48). Moreover, the performance of the data mining models was compared based on different performance metrics. With the best model, early screening examinations and treatment for ROP could be implemented to avoid severe complications like permanent blindness in Iranian premature neonates.
3. Methods
A cross-sectional study was carried out in Yas Women Hospital affiliated with Tehran University of Medical Sciences, Tehran-Iran. The population study consisted of 76 hospitalized preterm neonates with ROP diagnosis from April 2014 to October 2018 and all of them are included in this study; therefore, there is no bias in sampling
Firstly risk factors related to retinopathy of prematurity requiring medical intervention were determined (16) and recorded in a checklist. The explored risk factors were as follows; gestational age, birth weight, sex, type of delivery, cord blood pH, first and 5th minute Apgar scores, hemoglobin, and C-reactive protein (CRP) levels, hyperglycemic status, history of sepsis and positive blood culture, history of blood transfusion (packed cell) or intra-lipid infusion, history of intrauterine growth restriction (IUGR), history of disseminated intravascular coagulation (DIC), abnormal brain ultrasound findings, intubation and oxygenation period, maternal age, history of maternal hypertension, eclampsia, controlled and uncontrolled diabetes. All participants' medical records were assessed. The pre-set checklist was used as a data extraction form to extract the risk factors leading to treatment-requiring retinopathy from neonates' medical records. Then, six records with more than 70% missing data, were excluded from analysis. There were 17 unregistered data elements that were replaced using mean and median for continuous and discrete attributes, respectively.
A high sensitive software model was designed to predict the need for medical intervention for retinopathy of prematurity. The final output was defined as "treatment-requiring" by positive or negative options. First, data preprocessing was done. Then, 4 data mining techniques including multi-layer perceptron (MLP), random forest, naive bayes and decision tree (J48) implemented in Weka were applied. To compare the performances of each data mining method, several performance metrics such as the accuracy, precision, sensitivity, specificity, and F-measure have been used whereas all of them were calculated based on confusion matrix (Table 1). Moreover, the 10-fold cross validation was implemented to evaluate the performance of each model. By this technique, unreliable and biased results were identified and avoided.
| Performance Metrics | Definitions |
|---|---|
| Precision | TP/ (TP + FP) |
| Specificity or true negative rate | TN/N = TN/ (TN + FP) |
| Sensitivity or true positive rate (TPR) or recall | TP/P = TP/ (TP + FN) |
| Accuracy | (TP + TN)/ (TP + TN + FP + FN) |
| F-measure | 2 (precision × recall)/ (precision + recall) |
Abbreviations: TP, true positive; FP, false positive; FN, false negative; TN, true negative.
3.1. Primary Outcomes
Our primary objective was to suggest some criteria for predicting treatment-requiring retinopathy of prematurity in neonates.
3.2. Ethical Considerations
The present study was taken from a medical student thesis with ID 9311165008. Our study was approved by the institutional review board of Tehran University of Medical Sciences (No: IR.TUMS.MEDICINE.REC.1397.547) according to the Helsinki declaration. All gathered data were considered confidential and no extra cost was imposed on our participants.
4. Results
Seventy neonates (40 males) with ROP entered the study. Retinopathy in 35 cases was treated and the others had not received any treatment associated with their retinopathy. The mean gestational age in treated and untreated groups was 29.34 ± 2.460 and 31.714 ± 2.77 weeks respectively. The mean birth weight of the treated group was also lower than that of the other group (1187.61 gr vs 1568.14 gr). Other risk factors were assessed between groups. Descriptive quantitative and qualitative data related to 23 input variables (risk factors) are presented in Tables 2 and 3. With positive and negative values, the status of treatment-requiring as the output was determined.
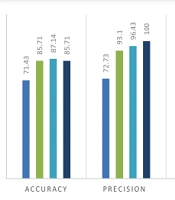
The accuracy, precision, sensitivity, specificity and F-measure for different predicting models were calculated and compared. Results associated to 10-fold cross validation are presented in percents in Table 4 and Figure 1.
| Variables | Positive group (with treatment), N = 35 | Negative Group (without Treatment), N = 35 |
|---|---|---|
| Gestational age (weeks) | 29.34 ± 2.460 | 31.714 ± 2.77 |
| Weight (gr) | 1187.61 ± 414.15 | 1568.14 ± 694.63 |
| Mother's age (y) | 29 ± 4.78 | 29.10 ± 4.12 |
| First minute apgar score | 6.62 ± 1.90 | 7.90 ± 1.13 |
| 5th Minute Apgar Score | 8.42 ± 0.83 | 8.91 ± 0.27 |
| Cord blood pH | 7.26 ± 0.08 | 7.24 ± 0.08 |
| Hb (mg/dL) | 14.55 ± 1.89 | 16.54 ± 1.04 |
| Blood infusion (units of packed cell) | 6.41 ± 4.83 | 2.41 ± 1.77 |
| Intubation period (days) | 14.49 ± 12.68 | 3.50 ± 3.09 |
| Oxygenation period (days) | 24.68 ± 16.74 | 7.97 ± 3.85 |
aValues are expressed as Mean ± SD.
| Variables | Positive Group (with Treatment), N = 35 | Negative Group (without Treatment), N = 35 |
|---|---|---|
| Sex | ||
| Male | 20 | 20 |
| Female | 15 | 15 |
| Intrauterine growth restriction | ||
| Yes | 8 | 11 |
| No | 27 | 24 |
| C-reactive protein | ||
| Positive | 13 | 5 |
| Negative | 22 | 30 |
| Hypertension | ||
| Yes | 5 | 12 |
| No | 30 | 23 |
| Eclampsia | ||
| Yes | 9 | 9 |
| No | 26 | 26 |
| Controlled diabetes | ||
| Yes | 4 | 9 |
| No | 31 | 26 |
| Uncontrolled diabetes | ||
| Yes | 0 | 1 |
| No | 35 | 34 |
| Type of delivery | ||
| C/S | 31 | 26 |
| NVD | 4 | 9 |
| Intralipid infusion | ||
| Yes | 35 | 34 |
| No | 0 | 1 |
| Hyperglycemic status | ||
| Yes | 6 | 0 |
| No | 29 | 35 |
| Sepsis | ||
| Yes | 17 | 11 |
| No | 18 | 24 |
| Disseminated intravascular coagulation | ||
| Yes | 24 | 23 |
| No | 11 | 12 |
| Brain ultrasound finding | ||
| Normal | 26 | 30 |
| Abnormal | 9 | 5 |
| Predicting Models | Accuracy | Precision | Specificity | Sensitivity | F-Measure |
|---|---|---|---|---|---|
| MLP | 71.43 | 72.73 | 74.29 | 68.57 | 70.59 |
| Random forest | 85.71 | 93.10 | 94.29 | 77.14 | 84.38 |
| Naive bayes | 87.14 | 96.43 | 97.14 | 77.14 | 85.71 |
| Decision tree | 85.71 | 100 | 100 | 71.43 | 83.33 |

Comparison of performance metrics in four data mining thecniques using 10-fold cross validation
Comparing the performance of data mining methods in predicting treatment-requiring, several performance metrics (accuracy, precision, sensitivity, specificity, and F-measure) have been used. Since the aim of this study was to design a screening model, the best models were selected based on their sensitivity. In a model with high sensitivity, treatment-requiring could be recognized well. Results showed that the sensitivities correlated with Random Forestand Naive Bayes models were higher in comparison with other techniques. However, among 4 models, Naive Bayes had the best performance with the highest accuracy (87.14), precision (96.43), sensitivity (77.14) and F-measure (85.71). Confusion matrix for Naive Bayes classifier showed that 27 cases in the positive group were diagnosed correctly while 8 cases were classified in the false-negative group (positive predictive value; 0.7714). On the other hand, only one negative case was classified in the false-positive group (negative predictive value; 0.9714). Overall 87.14% of all data were correctly classified (Table 5).
| Model Output | ||
|---|---|---|
| No treatment requiring | Treatment requiring | |
| Number of patients in each group based on medical records | ||
| Treatment requiring | 8 | 27 |
| No treatment requiring | 34 | 1 |
Of all data mining techniques, Decision Tree model could indicate understandable findings (Figure 2).

Decision tree based on input data
This model showed: If oxygen therapy continues more than 16 days then patients need treatment; If blood infusion is > 6 units of packed cells in cases with oxygen therapy period less than 16 days then patients need treatment; If oxygen therapy continues < 16 days oxygen therapy and blood infusion is < 6 units, then cases need no treatment.
5. Discussion
Many studies have indicated that ROP is associated with low gestational age and birth weight; however, different criteria cut-offs were produced in screening schedules (12-18). Variation in guidelines for ROP screening and implementing referral criteria maybe related to other factors including the availability of human and material resources, the health infrastructures, care programs associated with antenatal, obstetric and neonatal periods, as well as physician’s knowledge about ROP (19).
In accordance with other investigations, we found that the mean gestational age and birth weight in the ROP treated group was lower than that in the untreated group. The mean gestational age and birth weight in the treatment-requiring group was 29.34 ± 2.460 weeks and 1187.61 g. Another study from Iran by Karkhaneh et al. have demonstrated that the mean gestational age and birth weight in 953 premature infants with severe ROP was 28.8 ± 2.4 weeks and 1256 ± 389 g (20). Ahmadpour-Kacho et al. have also indicated that the mean gestational age and birth weight in 256 Iranian neonates with ROP diagnosis was 30.54 ± 2.28 weeks and 1403.47 ± 333.44 g, respectively. They have shown that the occurrence of ROP could be predicted in premature newborns by clinical risk index for babies (CRIB) as a scoring system; however, this index could not be a reliable predicting index for ROP severity or prognosis (21). Vyas et al. assessed the survival rates and rates of > stage 3 ROP in different populations. Survival rates in infants with gestational age < 26, birth weight < 751 and with CRIB > 10 were 47.5%, 41.2% and 25.2%, respectively. The rate of severe ROP was also 48.4%. They have shown that ROP group had higher mean birth weight (1403 g) and gestational age (30.54 weeks) but lower CRIB scores (22).
Pediatric screening guidelines were implemented to prevent the virulent form of ROP and childhood blindness based on Retinopathy of Prematurity Plus (23). On the other hand, Chiang et al. showed a fair diagnostic agreement of plus disease diagnosis among 22 ROP experts. Their results showed that all participants were agreeing on the same diagnosis related only 4 of 34 wide-angle retinal photographs (24). Other investigations also confirmed such findings by the mean weighted kappa statistic from 0.21 - 0.40 as fair to 0.41 - 0.60 as moderate values in diagnostic agreement of ROP treatment-requiring in plus disease (24-30).
Fortes et al. assessed the value of SNAPPE-II (score for neonatal acute physiology and perinatal extension) in predicting ROP but they could not find a significant association between the SNAPPE-II scores and the risk of ROP development (31). Fleck et al. found a correlation between international differences in ROP treatment rates within BOOST (benefits of oxygen saturation targeting) and international variation in ROP grading. They proposed strong needs for enhancement in the standardization of the diagnosis of ROP treatment-requiring, training in the grading of ROP, implementation of international approach, and ROP image analysis software (26).
The results of present study have demonstrated that designing data mining techniques to suggest a ROP treatment-requiring model could improve clinical outcomes. Both proposed diagnostic models including Random Forestand Naive Bayes models had high sensitivity by 77.14%. Regarding specificity, the Naive Bayes model with 94.29% was the best among the four techniques. Therefore Bayes' model with high sensitivity and specificity may be suggested as a screening treatment-requiring model. Previous studies have also shown that naïve Bayes is suitable for a small dataset with high correlation between the task and other non-task attribute variables (32). Moreover, of all data mining techniques, the Decision Tree model with reasonable sensitivity and specificity (71.43 & 100 %) using two variables composed of oxygen therapy duration and units of blood infusion could assess the trend of the screening process. Furthermore, the decision tree technique had the manual capability and there was no computer systems requirement. Consistent with our findings, Ray et al implemented machine learning to predict the incidence of ROP. Three class problems including No ROP, Regressed ROP and Progressed ROP were entered the study. Their results have indicated the Decision Tree model with the highest accuracy (83.26%) and the least false negative values could be used as a preferable screening ROP model (33). Other systems using the machine learning model could diagnose pre-plus and plus diseases based on ROP Imaging and Informatics data (34-37); however, with regard to ROP treatment-requiring, no significant correlation was observed. It is supposed that our designed models would be preferentially applied because of considering multiple risk factors affecting the development of ROP, as well as higher sensitivity and specificity rates.
Our study had some limitations. Machine learning algorithms require a huge number of samples for training (38, 39). However, collecting large number of samples is not always feasible. This is especially true in the medical field, when we are dealing with data on a rare disease or when, for whatever reason, limited samples are available (40, 41), besides, in this study, it was not possible to select a larger sample size due to the low prevalence of ROP in Iran.
Elimination of a few medical records that had missing data related risk factors and ROP prognosis, variance in diagnostic methods, and a single population were other limitations of the present study. These limitations could affect the accuracy of software algorithms and prediction ability. Further studies with larger sample size are strongly suggested.
5.1. Conclusion
The results of the present study have demonstrated that data mining techniques could be effectively implemented in ROP screening programs. Among the four techniques, the performance of the Naive Bayes model was the best regarding its sensitivity and specificity.
