1. Background
Hand-foot-and-mouth disease (HFMD) is an infectious disease in children that can be transmitted through contact, respiratory, and digestive tracts (1). It is mainly caused by enterovirus 71 and coxsackie A16 (2). Most patients with HFMD have mild symptoms and typically recover within 14 days without a secondary cutaneous infection (3). However, a few patients will have severe manifestations such as acute flaccid paralysis, aseptic meningitis, neurogenic pulmonary edema, and circulatory system failure, with poor prognosis (4, 5). The incidence of HFMD in China ranges from 37.01/100,000 to 205.06/100,000, and the mortality rate ranges from 6.46/100,000 to 51.00/100,000 (6). Children with severe or critical HFMD usually have no typical clinical manifestations in the early stages and can rapidly develop into severe or fatal disease in the short term. Therefore, identifying patients who are at high risk of developing severe and frequent disease is a key goal to the management of this disease.
According to the clinical test results, it was found that fever temperature, fever duration, age, blood glucose concentration, neutrophil count, and white blood cell count were related to the deterioration of HFMD patients (7-10). In addition, some researchers found that some cytokines were related to the severity of HFMD (11, 12), and some gene polymorphisms were related to the susceptibility and progression of severe HFMD (13, 14). Some prediction models related to the severity of HFMD had also been established through the machine learning algorithm (15), nomogram (16), and mortality risk score (17).
Although many studies have been conducted on HFMD patients with different degrees of illness, there are still scare studies on finding suitable risk factors and establishing prediction models.
2. Objectives
In this study, a retrospective case-control study was used to comprehensively analyze various blood test indicators of HFMD patients during admission, find risk factors for severe and critical HFMD patients, and establish an appropriate prediction model to guide clinical treatment, carry out early interventions, and improve the prognosis of patients.
3. Methods
3.1. Patients
In this study, patients with HFMD admitted to Jiangxi Children's Hospital from December 2015 to January 2020 were selected as the research subjects. The defined diagnosis of HFMD was based on the guidelines for the diagnosis and treatment of HFMD (version 2018) (6). A total of 3,204 patients were enrolled in this study, including 2,131 mild patients (mild), 962 severe patients (severe), and 111 critical patients (critical). All the data in this study are the original medical records of the subjects when they were admitted to the hospital. The test indices and grouping information of subjects were taken as independent variables and dependent variables, respectively. The basic information of the subjects and the results of various blood test indicators are shown in Table 1 and Appendix 1. This study was approved by the Ethics Committee of Jiangxi Children's Hospital (approval number: JXSETYY-YXKY-20200011).
| Factors | Mild | Severe | Critical |
|---|---|---|---|
| Number | 2131 | 962 | 111 |
| Male | 1359 | 639 | 82 |
| Female | 772 | 323 | 29 |
| Age (y) | 1.79 ± 0.03 | 1.81 ± 0.03 | 1.89 ± 0.08 |
| < 1.0 | 533 | 122 | 11 |
| 1.0 - 5.0 | 1540 | 830 | 100 |
| > 5.0 | 58 | 10 | 0 |
To ensure the integrity of data and the reliability of analysis results, the missing values of samples and variables included in this study were not more than 10%. In addition, the processing method for missing values in the data was as follows: A mode was used for interpolation for categorical variables, and a mean was used for interpolation for continuous variables.
3.2. Multivariate Statistical Analysis Based on SIMCA-P
All the data were imported into SIMCA-P (version 13, Umetrics, Umea, Sweden), and pre-treated by scaling with UV (Unit Variance Scaling) for multivariate statistical analysis. Non-supervisory principal component analysis (PCA) was used to preliminarily observe the distribution and clustering of data of each group and further detect and exclude abnormal samples (18). Suitable partial least Discrimination analysis (PLS-DA) and orthogonal least squares analysis (OPLS-DA) model were established to differentiate the data of each group (19, 20), and the S-plot score graph was used to screen the indicators that were most important to the differential diagnosis between the groups (21).
3.3. Univariate Analysis and Logistic Regression Analysis
To screen the variables with significant differences in each group, an independent t test or a nonparametric test (Mann-Whitney U test) was used where appropriate. A two-sided P < 0.05 was considered to be statistically significant. The receiver operating characteristic (ROC) was used to evaluate the differential diagnosis performance of variables with significant differences, and the potential risk factors were screened out by calculating the odds ratio (OR). To further establish an appropriate prediction model, the variables with statistical differences were subsequently analyzed by binary logistic regression analysis with the forward Wald method. The inclusion criterion of the selected variables was P < 0.05, and variables with P > 0.10 were eliminated. Before multivariate logistic regression analysis, we performed a normal distribution test on all continuous variables, performed logarithmic conversion for data that did not conform to normal distribution, and eliminated the data that still did not conform to the normal distribution after conversion.
All analyses were performed using SIMCA-P (version 12, Umetrics, Umea, Sweden) and SPSS23.0 (SPSS Inc., Chicago, IL, US). The heatmap was made using MetaboAnalyst 4.0, and the Venn diagram was made using Microsoft Excel 2016.
4. Results
4.1. Investigation of Overall Data Distribution (Multivariate Statistical Analysis)
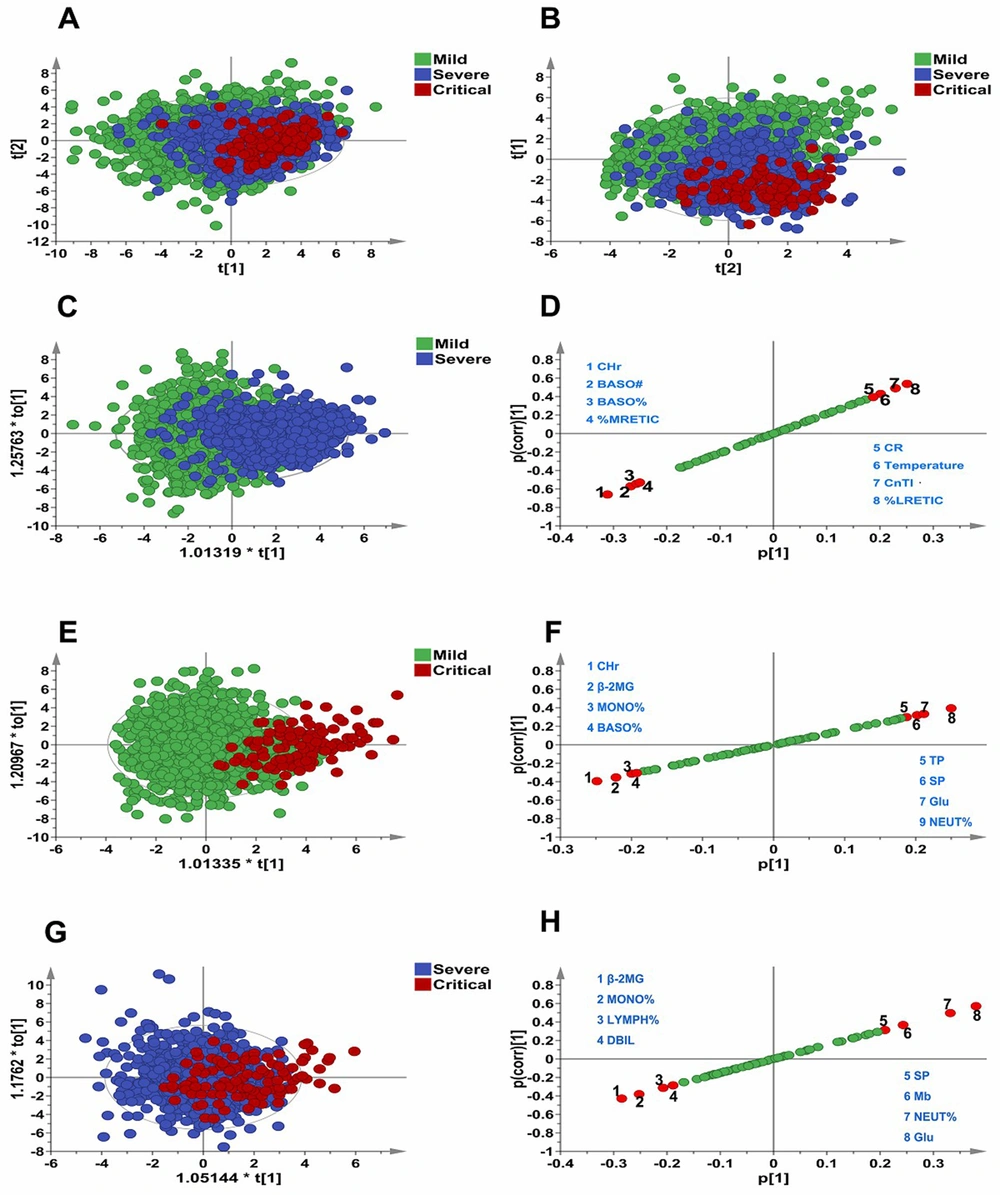
The PCA score graph (Figure 1A) showed that the data of Mild, Severe, and Critical had obvious clustering. The PLD-DA score graph (Figure 1B) showed that the above three groups could be distinguished to a certain extent by the PLS-DA model, and the dataset represented by the more severe HFMD patients was also shifting to the lower right corner of the graph; that is, the overall change of data of each group could be better reflected by the score graph. The OPLS-DA model and S-plot score graphs were further used to conduct discriminative analysis on the data of each group, and the indicators with better discriminatory performance were selected, as shown in Figure 1C - H. As indicated, BASO#, BASO%, %MRETIC, CR, Temperature, CnTI, and %LRETIC had important contributions to distinguishing between mild and severe, and β-2MG, MONO%, LYMPH%, DBIL, SP, Mb, NEUT%, and Glu had important contributions to distinguishing between severe and critical.
Analysis of overall data distribution of Mild, Severe, and Critical. A, PCA score graph; B, PLD-DA score graph; C, OPLS-DA; and D, S-plot score graph for mild and severe cases; E, OPLS-DA; and F, S-plot score graph for mild and critical cases; G, OPLS-DA; and H, S-plot score graph for severe and critical cases.
4.2. Univariate Statistical Analysis
In terms of clinical manifestations, mild HFMD patients are generally in good condition, with only skin rash. Severe HFMD patients have nervous system damage, convulsions, headache, vomiting, and poor mental health. Critical HFMD patients have impaired cardiopulmonary function, increased heart rate and respiration, or brain failure and usually need ventilator-assisted breathing.
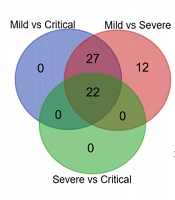
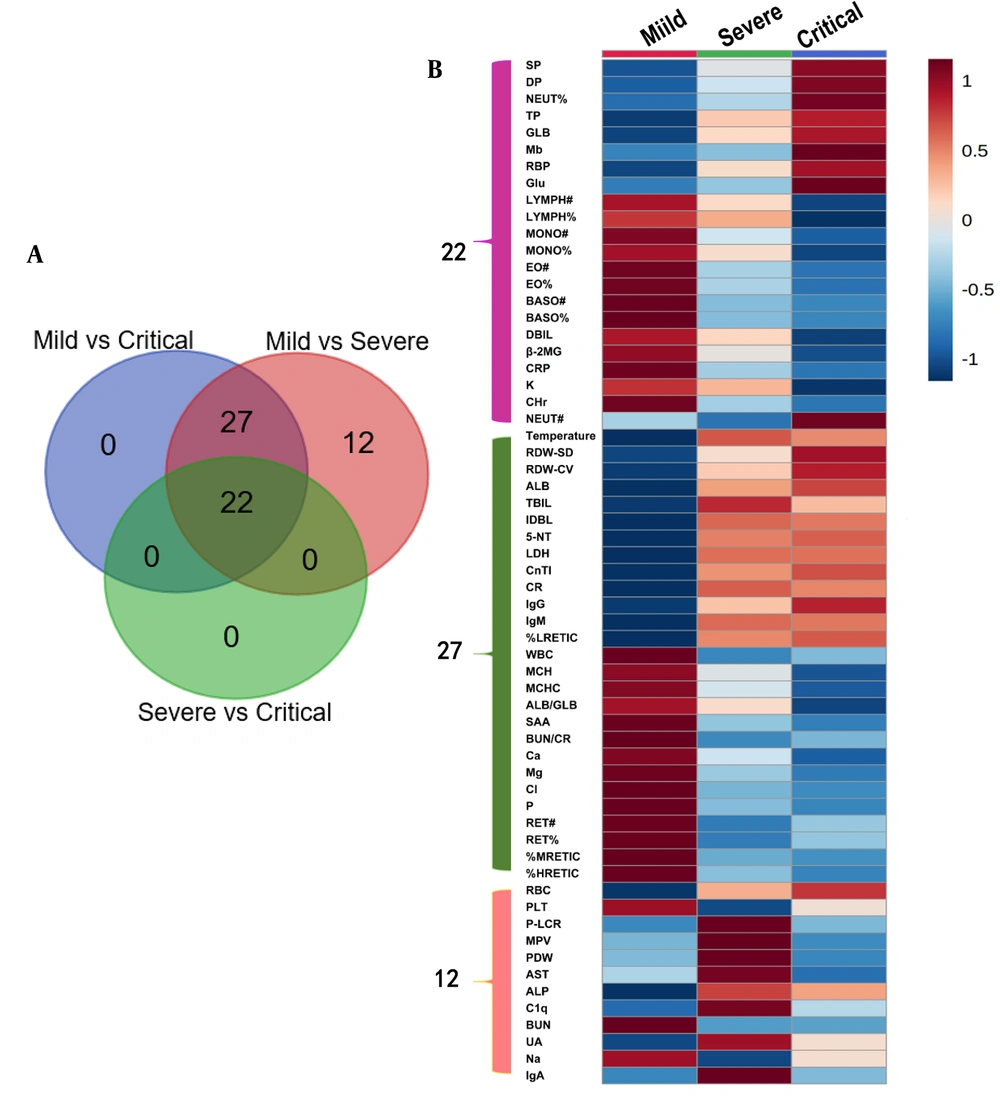
Univariate statistical analysis was carried out on each variable, and detailed results are shown in Appendices 2, 3, and 4. We found that there were 61, 49, and 22 variables with significant differences among the mild/severe, mild/critical, and severe/critical groups, respectively. Among them, 22 variables showed significant differences (Figure 2A). In addition, HFMD patients with more severe disease presented a regular increasing trend in SP, DP, NEUT%, TP, GLB, Mb, RBP, and Glu, while LYMPH#, LYMPH%, MONO#, MONO%, EO#, EO%, BASO#, BASO%, DBIL, β-2MG, CRP, K, and CHr showed a regular decreasing trend (Figure 2B), and NEUT# presented an irregular change trend.
In addition, compared with mild, 27 variables showed significant differences in both severe and critical but did not show significant differences between the two groups. It suggested that these substances might play a role in the progression of mild patients to severe patients, but they did not change significantly with the aggravation of severe patients' conditions. Compared with mild, the contents of temperature, RDW-SD, RDW-CV, ALB, TBIL, IDBL, 5-NT, LDH, CnTI, CR, IgG, IgM, and %LRETIC were higher in severe and critical, while the contents of WBC, MCH, MCHC, ALB/GLB, SAA, BUN/CR, Ca, Mg, Cl, P, RET#, RET%, %MRETIC, and %HRETIC were lower in severe and critical.
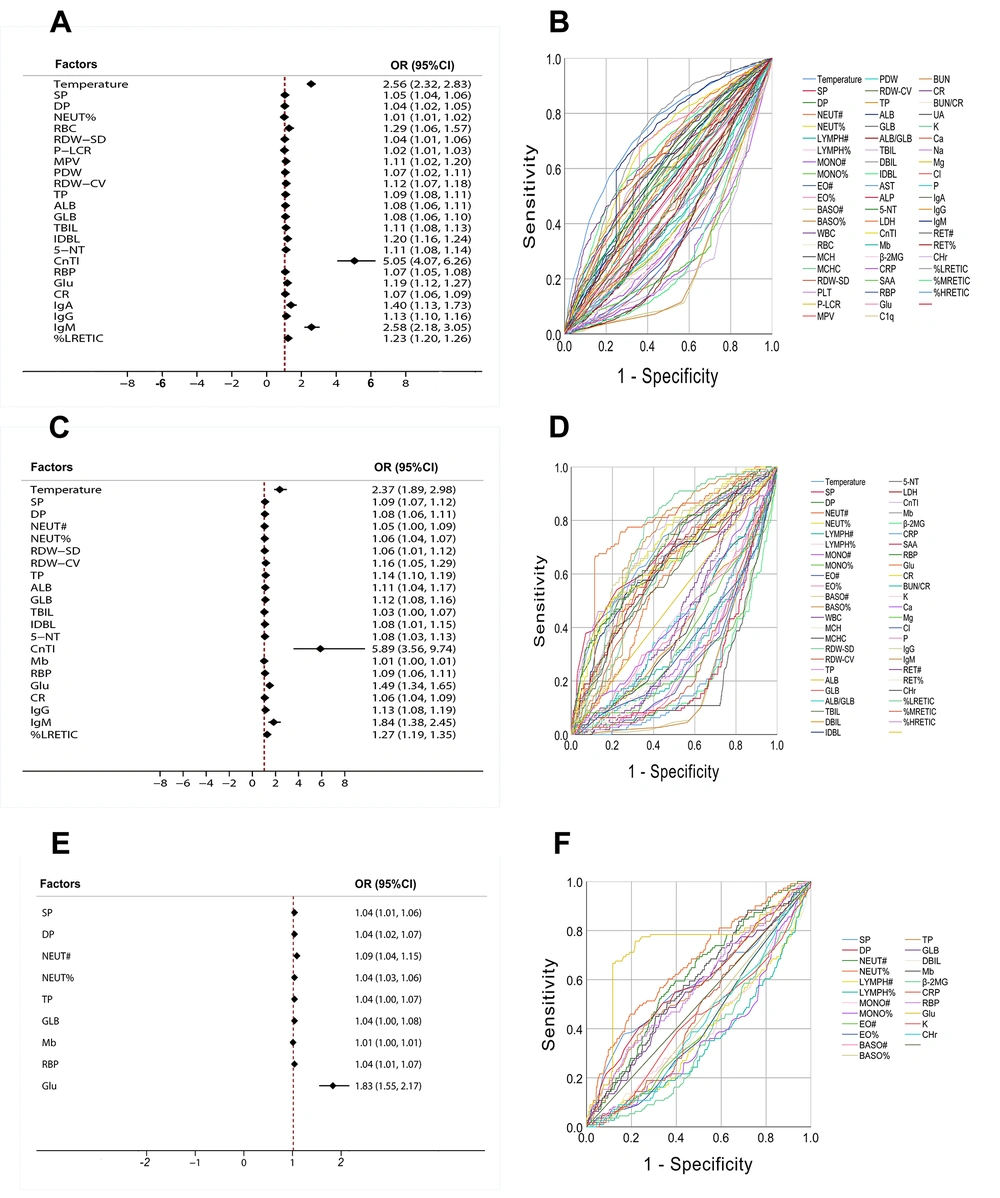
Multivariate logistic regression analysis was performed with the variables with statistical significance in univariate statistical analysis, and the OR value of each variable was calculated (OR > 1.0 was identified as the risk factor). The results showed that temperature, SP, DP, NEUT%, RBC, RDW-SD, P-LCR, MPV, PDW, RDW-CV, TP, ALB, GLB, TBIL, IDBL, 5-NT, CnTI, RBP, Glu, Cr, IgA, IgG, IgM, and %LRETIC were independent risk factors for the progression of Mild to Severe (Figure 3A). Temperature, SP, DP, NEUT#, NEUT%, RDW-SD, RDW-CV, TP, ALB, GLB, TBIL, IDBL, 5-NT, CnTI, RBP, Glu, CR, IgG, IgM, %LRETIC, and Mb were independent risk factors for the progression of Mild to Critical (Figure 3C). Besides, SP, DP, NEUT#, NEUT%, TP, GLB, RBP, Glu, and Mb were independent risk factors for the progression of Severe to Critical (Figure 3E).
Compared with Mild, the OR values of SP, DP, NEUT%, RDW-SD, RDW-CV, TP, ALB, GLB, CnTI, RBP, Glu, and %LRETIC of the 12 variables in severe and critical showed an increasing trend. In other words, with the aggravation of the disease, the risk warning abilities of the above indicators for the development of severe and critical patients were also increased. Further analyzing the changes of OR value and content of each variable, we found that with the aggravation of HFMD patients, compared with Mild, the content and risk warning ability of the seven variables of SP, DP, NEUT%, TP, GLB, RBP, and Glu in severe and critical were significantly increased.
To investigate the differential diagnosis performance of each variable between the groups, the ROC curve analysis was used to evaluate the variables with significant differences between the groups, as shown in Figure 3B, D and F. Temperature, BASO#, BASO%, CRP, SAA, CHr, %LRETIC, and %MRETIC had certain effects on distinguishing Mild from Sever (AUROC > 0.7). Temperature, NEUT%, MONO#, MONO%, EO#, EO%, BASO#, BASO%, CnTI, β-2MG, CRP, SAA, Glu, CHr, Glu, %LRETIC, and %MRETIC had certain effects on distinguishing mild from critical (AUROC > 0.7). Only Glu showed some effects for distinguishing severe from critical (AUROC > 0.7). On the whole, it was difficult to differentiate mild, severe, and critical by relying on a single index (AUROC < 0.80).
4.3. Establishment of Logistic Regression Prediction Model
To improve the ability of differential diagnosis and risk warning of HFMD patients in each group, binary logistic regression analysis was conducted in this study with statistically significant indicators in the univariate analysis as parameters, and an appropriate prediction model was established.
For mild/severe, the prediction equation was P = 1 / [1 + e (-18.876 + 0.971X1 - 24.528X2 - 0.005X3 - 0.155X4 - 0.084X5)] where X1, X2, X3, X4, and X5 were temperature, BASO#, SAA, Cl, and CHr, respectively, and P > 0.5 was identified as severe patients. Finally, the average predictive accuracy of the model for mild/severe was 82.89%, the false-positive rate was 9.43% (201/2131), the AUROC was 0.8722 (95%CI, 0.8583-0.8861), and the sensitivity and specificity were 73.70 and 85.83%, respectively (Figure 4A). Using the P value calculated by the model equation as the parameter to calculate the OR value, it was found that the OR value was 402.7963 (95% CI, 269.8202 - 601.3073). The above results indicated that the model could be used to distinguish mild from severe, and the above five variables were risk factors for Mild to progress to Severe, with a good early warning effect.
For mild/critical, the prediction equation was P = 1 / [1 + e (-49.429 + 1.356X1 - 1.438X2 + 0.465X3 - 0.066X4 - 0.183X5)], where X1, X2, X3, X4, and X5 were Temperature, β-2MG, Glu, CRP, and CHr, respectively, and P > 0.5 was identified as critical patients. Finally, the average predictive accuracy of the model for mild/critical was 96.16%, the false-positive rate was 0.75% (16/2131), the AUROC was 0.9499 (95% CI, 0.9339 - 0.9659), and the sensitivity and specificity were 93.69 and 83.25%, respectively (Figure 4B). Using the P value calculated by the model equation as the parameter to calculate the OR value, it was found that the OR value was 402.7963 (95% CI, 269.8202 - 601.3073). The above results indicated that the model could be used to distinguish mild from critical, and the above five variables were risk factors for mild to progress to critical, with a good early warning effect.
For severe/critical, the prediction equation was P = 1 / [1 + e (-8.903 + 0.037X1 + 0.037X2 + 0.044X3 + 0.541X4 - 0.080X5)], where X1, X2, X3, X4, and X5 were DP, NEUT%, RBP, Glu, and CHr, respectively, and P > 0.5 was identified as critical patients. Finally, the average predictive accuracy of the model for Severe/Critical was 89.37%, the false-positive rate was 1.14% (11/962), the AUROC was 0.7913 (95% CI, 0.7471 - 0.8356), and the sensitivity and specificity were 81.08 and 65.28%, respectively (Figure 4C). Using the P value calculated by the model equation as the parameter to calculate the OR value, it was found that the OR value was 929.4721 (95% CI, 210.7578 - 4099.1052). The above results indicated that the model could be used to distinguish severe from critical, and the above five variables were risk factors for severe to progress to critical, with a good early warning effect.
5. Discussion
As the disease progresses rapidly and the boundaries of disease stages are blurred, severe HFMD patients are often faced with the risk of poor nursing quality and poor prognosis (22). Therefore, it is particularly important to identify severe HFMD in the early stage to provide effective intervention measures. In this study, we analyzed the clinical blood test indicators of HFMD patients for the first time through multivariate statistical analysis based on SIMCA-P and compared the results with univariate statistical analysis. The results showed that the AUROC of the variables selected by the OPLS-DA model was significantly better than other variables with a low contribution to univariate statistical analysis.
Compared with traditional univariate statistical analysis, multivariate statistical analysis based on SIMCA-P has the following advantages: (1) PCA, PLS-DA, and OPLS-DA models have been widely applied in statistical analysis of various clinical data (23-25). The models are stable and have a good fitting degree and prediction accuracy for the original data; (2) simple operation and a high degree of visualization, which can not only accurately reflect the integrity of data but also screen out single variables with good discrimination effect; (3) with good data inclusion, it is not necessary to eliminate the variables with no statistical difference, and the analysis is not affected by the multiple correlations between variables, which is more conducive to the construction of network relationships between variables.
Comprehensive analysis of the changes of the content and OR value of each indicator showed that the more severe the HFMD patients were, the higher the content and risk warning ability of seven indicators, including SP, DP, NEUT%, TP, GLB, RBP, and Glu, were in their blood. Peng et al. found that in patients with severe HFMD, hyperglycemia, hypertension, and tachycardia were the risk factors of neurogenic pulmonary edema (26). As known, HFMD is an infectious disease. With the aggravation of the patient's condition, NEUT%, TP, GLB, RBP, and other indicators related to disease infection might rise. Fang et al. also found that an increased neutrophil count and EV71 infection were the risk factors of severe HFMD (27). Therefore, we could ensure that SP, DP, NEUT%, TP, GLB, RBP, and GLU could be used as risk factors for severe and critical HFMD, and played an important role in suggesting the disease changes in patients with HFMD.
In addition, this study found for the first time that CHr, %MRETIC, %HRETIC, etc., were different in HFMD patients of different disease degrees. Moreover, the more severe the HFMD patients were, the lower the levels of CHr, %MRETIC, and %HRETIC were in their blood. Therefore, we speculated that HFMD might affect the hematopoietic function of bone marrow in patients, but the specific mechanism still needs further studies.
5.1. Limitations
Although this study had done some work to explore the risk factors and prediction model of HFMD, there were still many limitations. First, our study was a retrospective cohort study, and the lack of data on the type of virus that caused HFMD might lead to bias and limited clinical practice. Second, this was a single-center study conducted in Jiangxi, China, and we were not sure whether our results would be well replicated in other regions and populations. Finally, some indicators not commonly used in clinical tests (such as CHr, %MRETIC, etc.) were included in the model establishment of this study, so the established model might have some difficulties in clinical application.


