1. Background
Kawasaki disease (KD) is an acute multisystem vasculitis, preferentially affecting coronary arteries that mainly occurs in infants and young children (1). In asset-rich countries, it is the leading cause of pediatric acquired heart disease (2). The Japanese pediatrician Tomisaku Kawasaki first described KD in 1967; however, both the cause and pathogenesis of which remain unclear (3). Intravenous immunoglobulin (IVIG) is used to treat a wide variety of rheumatologic and other autoimmune disorders, including KD; however, the mechanism of action is not fully understood (4). Although timely treatment with high-dose IVIG for patients with acute stage KD shortens the duration of fever and reduces the incidence of coronary artery lesions, approximately 10% of the patients fail to respond to IVIG treatment (5, 6). The self-limited nature is unique in KD, and the most patients recover well (7). However, KD carries significant clinical importance and needs special attention because it can lead to serious cardiovascular complications.
Advance development in the investigation on KD includes searching for genetic susceptibility correlated with KD and a study on immunopathogenesis based on the review, in which it was reported that innate immunity performs a more prominent role than the acquired immunity. With the advent of genome-wide association studies (GWAS), a number of genes, including ITPKC, CASP3, BLK, CD40, and HLA were identified as candidates of KD-susceptibility genes (7). With emerging of various high-throughput technologies, a huge amount of RNA-seq data have been available, and numerous genes have been identified to be associated with KD. The comprehensive analysis of multiple gene expression profile data from different platforms will help to explore the pathogenesis of KD with a larger sample size more accurately than a single gene expression profile.
In the attempt to provide a more comprehensive analysis, we performed an integrated analysis based on multiple microarray datasets of KD collected from the Gene Expression Omnibus (GEO) database. The differentially expressed genes (DEGs) in KD were acquired. In addition, functional annotation of DEGs was conducted. Our study is expected to represent a new avenue to explore the specific mechanism for KD.
2. Methods
2.1. Datasets Collection
The mRNA expression profiles of KD were acquired from the GEO database. From 2016 to 2018, datasets meeting the following criteria were included in our study: (1) selected datasets should be whole-genome mRNA expression profile by array; (2) data derived from blood samples of patients with KD and normal controls; and (3) normalized or original datasets. After filtering, three datasets, including GSE73464, GSE109351, and GSE68004, were included in this study (Appendix 1).
2.2. Screening of DEGs Between Patients with KD and Normal Controls and Functional Annotation
MetaMA was utilized to acquire the DEGs. The threshold for the significance of DEGs was the false discovery rate (FDR) < 0.01 and |Combined.ES| > 1. Hierarchical clustering was visualized using the R package “pheatmap”. CPDB (http://cpdb.molgen.mpg.de/CPDB) was used to perform gene ontology (GO) classification and Kyoto Encyclopedia of Genes and Genomes (KEGG) pathway enrichment analysis. The threshold was set as FDR < 0.01.
2.3. Quantitative Real-time Polymerase Chain Reaction (qRT-PCR) Validation
Twelve blood samples were collected from five healthy individuals and seven patients with KD (Table 1). All patients were first diagnosed with KD and during the acute phase. Patients with infection of Epstein-Barr virus or other detectable pathogens and organ dysfunction caused by other reasons were excluded. The healthy control group underwent regular health examinations, had no fever, and no immune-related diseases, two weeks before and after sampling. Children with immunosuppressive therapy or fever in the past two weeks were excluded. All participants or their legally authorized representatives provided written informed consent to participate in the study, and the ethics committee of our hospital approved this study protocol.
| Sex | Age (mo) | WBC (109/L) | Neutrophils (%) | Platelets (109/L) | CRP (mg/L) | Duration of Fever (days) | |
|---|---|---|---|---|---|---|---|
| Case 1 | Female | 26 | 12.86 | 70.3 | 220 | 44.3 | 7 |
| Case 2 | Male | 25 | 21.74 | 72.3 | 408 | 52.4 | 7 |
| Case 3 | Male | 7 | 12.79 | 56.6 | 198 | 53.8 | 7 |
| Case 4 | Male | 8 | 17.88 | 86.3 | 433 | 61.9 | 6 |
| Case 5 | Male | 6 | 13.63 | 59.2 | 435 | 142.9 | 7 |
| Case 6 | Male | 16 | 18.64 | 81.7 | 301 | 45.6 | 5 |
| Case 7 | Female | 73 | 24.82 | 95.9 | 177 | 157.9 | 10 |
| Control 1 | Male | 15 | |||||
| Control 2 | Male | 16 | |||||
| Control 3 | Female | 60 | |||||
| Control 4 | Female | 24 | |||||
| Control 5 | Male | 10 |
Abbreviations: KD, Kawasaki disease; WBC, white blood cells; CRP, C-reactive protein.
Total RNA was extracted with the Trizol reagent (Invitrogen, USA). The qRT-PCR was performed on SuperReal PreMix Plus (Invitrogen, USA) in ABI 7500 real-time PCR detection system. Using the 2-ΔΔCt method, relative gene expression was determined. The human ACTB was served as a control in analysis. The PCR primers are shown in Appendix 2.
2.4. Receiver Operating Characteristic Analysis
Receiver operating characteristic (ROC) analysis is an effective method to evaluate the performance of diagnostic tests, which was used to study the diagnostic capacity of DEGs. The area under the curve (AUC) was further calculated.
2.5. Validation in GEO Database
GSE18606, consisting of 48 whole blood samples from nine healthy age-appropriate controls, eight IVIG non-responding, and 12 IVIG-responding patients at acute and convalescent stages, and GSE63881, consisting of the acute and convalescent whole blood samples from 171 KD subjects, were downloaded from the GEO database. We used GSE18606 in two steps: in the first step to validate the expression of DEGs regarding eight IVIG non-responding and 12 IVIG-responding patients at acute and convalescent stages as 20 KD patients, and in the second step, to explore the association between the expression of DEGs and the stage of KD.
3. Results
3.1. Identification of DEGs in KD
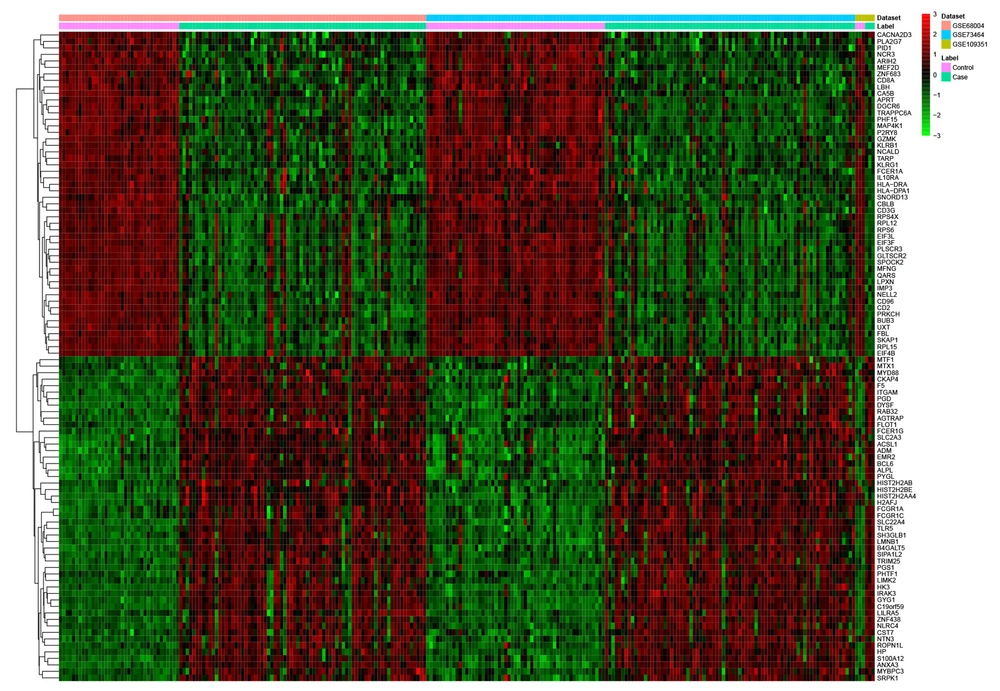
Compared with normal controls, a total of 2923 DEGs (1239 up- and 1684 down-regulated genes) were detected in KD, of which H2AFJ and KLRG1 were the most up- and down-regulated genes, respectively (Table 2). Hierarchical clustering analysis of the DEGs is shown in Figure 1.
| ID | Symbol | Combined.ES | P-Value | FDR | Regulation |
|---|---|---|---|---|---|
| 55766 | H2AFJ | 3.700016 | 0 | 0 | up |
| 199675 | C19orf59 | 3.68442 | 0 | 0 | up |
| 306 | ANXA3 | 3.611346 | 0 | 0 | up |
| 723790 | HIST2H2AA4 | 3.588033 | 0 | 0 | up |
| 6583 | SLC22A4 | 3.391514 | 0 | 0 | up |
| 7100 | TLR5 | 3.389525 | 0 | 0 | up |
| 8291 | DYSF | 3.346031 | 0 | 0 | up |
| 133 | ADM | 3.324556 | 0 | 0 | up |
| 249 | ALPL | 3.280282 | 0 | 0 | up |
| 4001 | LMNB1 | 3.219879 | 0 | 0 | up |
| 5836 | PYGL | 3.204071 | 0 | 0 | up |
| 6283 | S100A12 | 3.202836 | 0 | 0 | up |
| 8349 | HIST2H2BE | 3.183245 | 0 | 0 | up |
| 11213 | IRAK3 | 3.179503 | 0 | 0 | up |
| 9334 | B4GALT5 | 3.160613 | 0 | 0 | up |
| 2992 | GYG1 | 3.0806 | 0 | 0 | up |
| 100132417 | FCGR1C | 3.067235 | 0 | 0 | up |
| 220929 | ZNF438 | 3.063547 | 0 | 0 | up |
| 3101 | HK3 | 3.053121 | 0 | 0 | up |
| 604 | BCL6 | 3.035207 | 0 | 0 | up |
| 10219 | KLRG1 | -2.64137 | 0 | 0 | down |
| 3003 | GZMK | -2.55861 | 0 | 0 | down |
| 10425 | ARIH2 | -2.53112 | 0 | 0 | down |
| 2205 | FCER1A | -2.50717 | 0 | 0 | down |
| 3122 | HLA-DRA | -2.50395 | 0 | 0 | down |
| 9404 | LPXN | -2.44838 | 0 | 0 | down |
| 257101 | ZNF683 | -2.42422 | 0 | 0 | down |
| 83988 | NCALD | -2.41102 | 0 | 0 | down |
| 4242 | MFNG | -2.4045 | 0 | 0 | down |
| 914 | CD2 | -2.34531 | 0 | 0 | down |
| 445347 | TARP | -2.34518 | 0 | 0 | down |
| 6136 | RPL12 | -2.34263 | 0 | 0 | down |
| 3113 | HLA-DPA1 | -2.30342 | 0 | 0 | down |
| 353 | APRT | -2.29538 | 0 | 0 | down |
| 3587 | IL10RA | -2.29158 | 0 | 0 | down |
| 9806 | SPOCK2 | -2.28379 | 0 | 0 | down |
| 917 | CD3G | -2.26746 | 0 | 0 | down |
| 6138 | RPL15 | -2.26284 | 0 | 0 | down |
| 11184 | MAP4K1 | -2.25901 | 0 | 0 | down |
| 925 | CD8A | -2.24418 | 0 | 0 | down |
Abbreviations: DEGs, differentially expressed genes; KD, Kawasaki disease; ES, effect size; FDR, false discovery rate.
3.2. Functional Annotation of DEGs
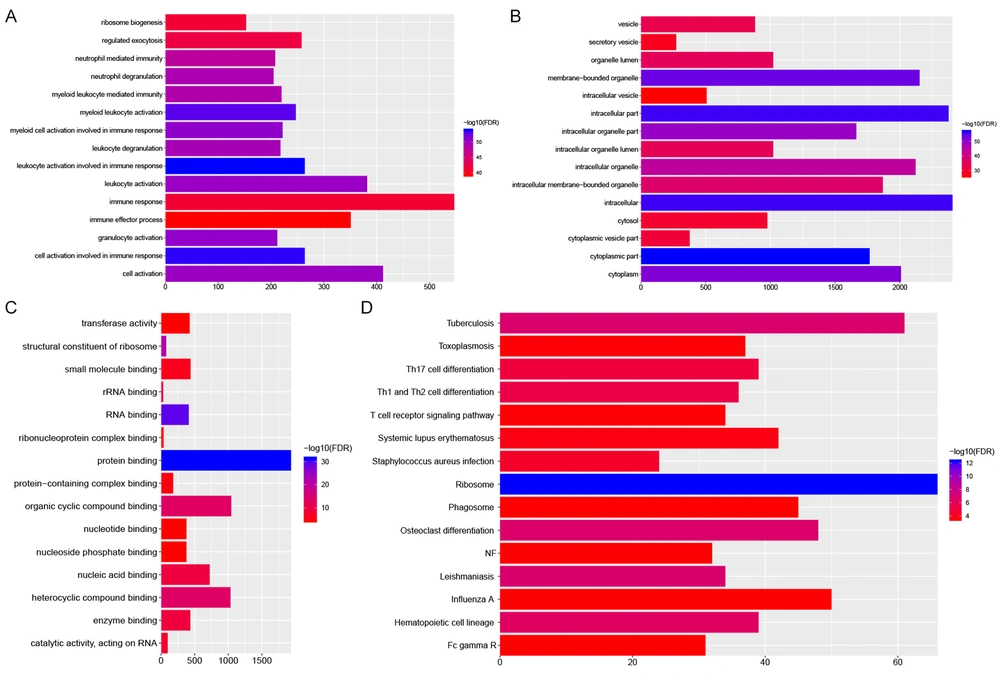
GO analysis indicated that these DEGs were mainly associated with leukocyte activation (FDR = 1.03E-54) and cell activation (FDR = 1.91E-54) involved in immune response, cytoplasmic part (FDR = 8.78E-58), and protein binding (FDR = 3.52E-32) (Figure 2A-C). The most significantly enriched KEGG pathway were ribosome (FDR = 4.62E-13), leishmaniasis (FDR = 1.44E-07) and tuberculosis (FDR = 1.83E-07) (Figure 2D).
3.3. QRT-PCR Validation
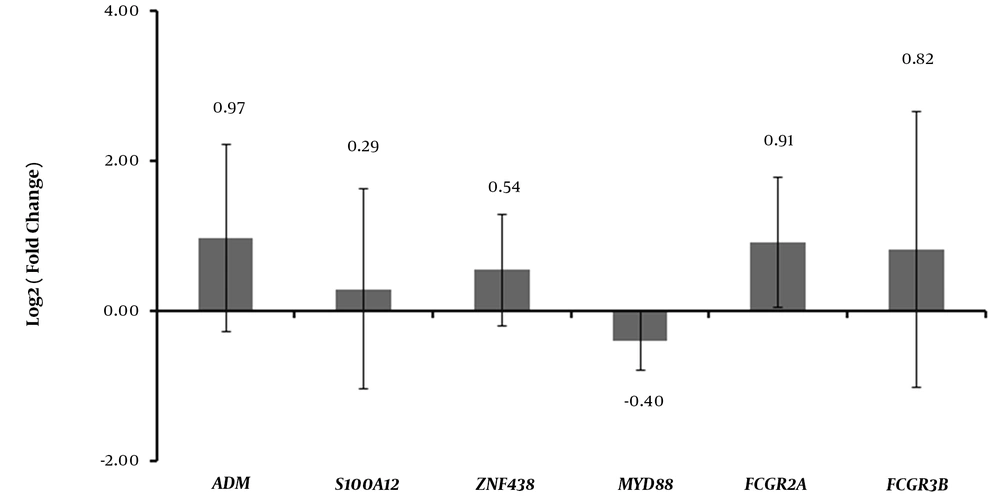
The expression levels of six DEGs, including ADM, S100A12, ZNF438, MYD88, FCGR2A, and FCGR3B, were determined by qRT-PCR. In this analysis, all these six DEGs were up-regulated in KD. The expression levels of these six DEGs in GEO are displayed in Appendix 3. As shown in Figure 3, the qRT-PCR results for all the DEGs except for MYD88 were generally consistent with that in our integrated analysis (Figure 3).
3.4. ROC Analysis
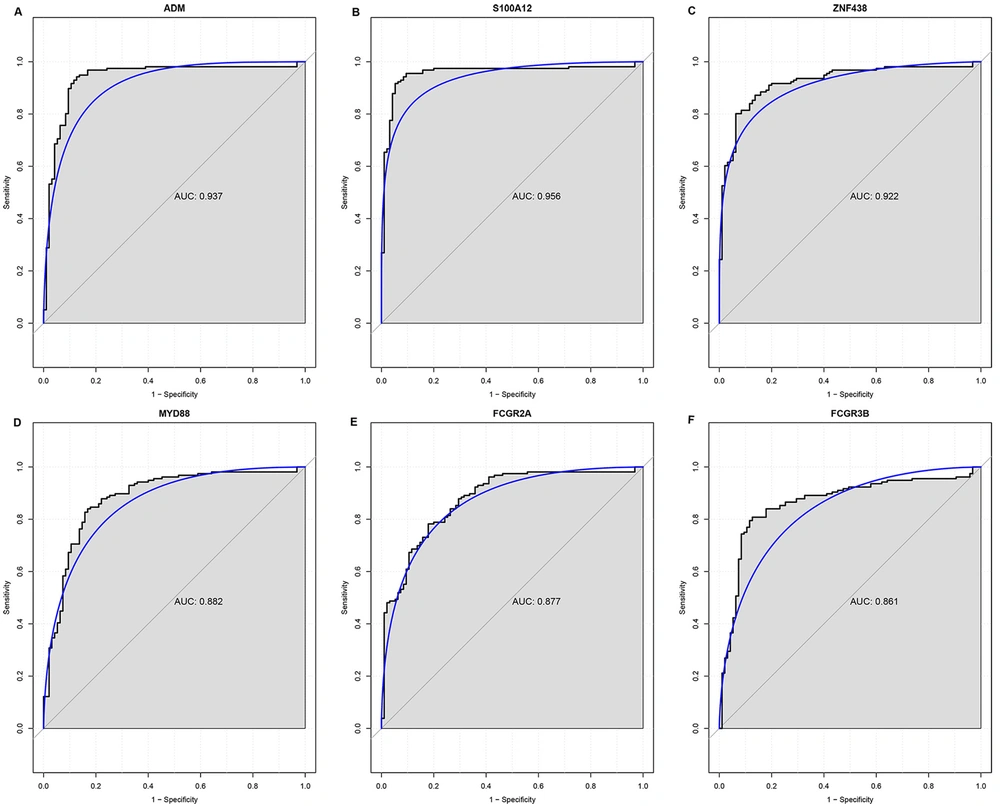
The AUC of these six DEGs, including ADM (0.937), S100A12 (0.956), ZNF438 (0.922), MYD88 (0.882), FCGR2A (0.877), and FCGR3B (0.861), was more than 0.85, indicating that these six DEGs may be potential diagnostic biomarkers for KD (Figure 4).
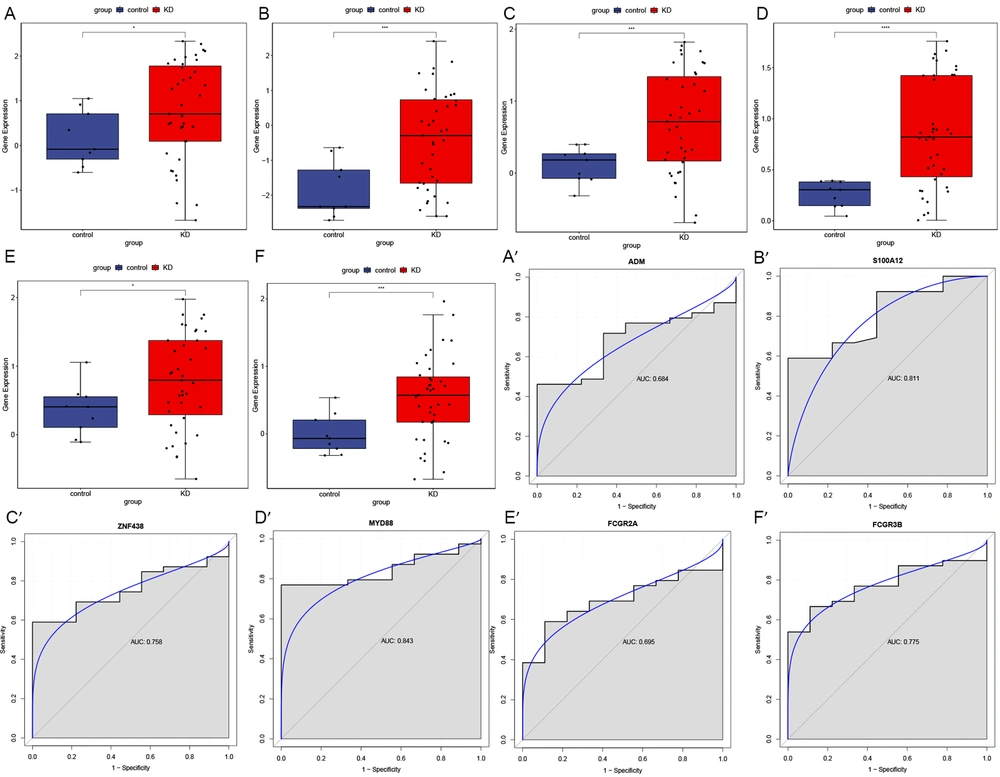
3.5. Validation in GEO Database
The expression levels of six DEGs, including ADM, S100A12, ZNF438, MYD88, FCGR2A, and FCGR3B, were verified using the GSE18606 dataset. As shown in Figure 5, these six DEGs exhibited the same patterns with our integrated analysis, and except ADM (0.684) and FCGR2A (0.695), the AUC of these DEGs, including S100A12 (0.811), ZNF438 (0.758), MYD88 (0.843), and FCGR3B (0.775) was more than 0.7. The expression levels of these six DEGs in different stages of KD based on GSE18606 and GSE63881 are displayed in Appendix 4. The expression levels of these DEGs exhibited a significant increase in the acute phase compared to healthy controls in GSE18606 and exhibited a significant decrease in the convalescent phase compared to the acute phase in GSE18606 and GSE63881. In other words, the expression levels of these DEGs decreased with the remission of KD symptoms.
4. Discussion
KD is a systemic vasculitis syndrome of unclear etiology. Although the clinical features, diagnosis, and treatment of KD are well determined, its pathogenesis remains unclear (8). In this study, a series of bioinformatics analyses were performed to investigate crucial genes correlated with KD.
Adrenomedullin (ADM) is a potent vasodilator peptide and is involved in the dilation of coronary arteries in acute KD (9, 10). It has been reported that ADM can significantly reduce cardiac contractility and induce the expression of adhesion molecules on human vascular endothelial cells and during endothelial cell proliferation, which may be one of the causes of acute KD-induced vascular inflammation (11-13). In an immunoradiometric assay, remarkably higher plasma ADM levels were detected in acute KD (14). Based on oligonucleotide microarray, RT-PCR, and ELISA, Nomura et al. indicated an increase in ADM levels in acute KD, as well (10). In addition, down-regulated ADM was observed in KD patients after intravenous infusion of high-dose IVIG therapy (15). In agreement with previous studies, ADM was significantly up-regulated in our analysis, which confirmed the critical role of ADM in KD.
S100 calcium-binding protein A12 (S100A12), a calcium-binding protein with proinflammatory properties, directly activates endothelial cells, macrophages, and lymphocytes by interacting with the multiligand receptor for advanced glycation end products (RAGE) (16). Many studies have demonstrated that S100A12 is closely related to KD. S100A12 was reported to function as a mediator in murine inflammatory disorders (17). Foell et al. observed that the serum concentrations of S100A12 increased in the acute phase of KD and subsequently decreased in response to high-dose IVIG therapy, indicating that S100A12 could be used as an additional serum marker for KD (18). The significantly up-regulated S100A12 in peripheral blood mononuclear cells (PBMCs) was observed at the acute phase of KD (19). Consistent with previous reports, significantly up-regulated S100A12 was detected in the current analysis, which indicated the important role of S100A12 in the development of KD.
To the best of our knowledge, there were no previous studies linking ZNF438 to KD. ZNF438 is a C2H2 type zinc finger gene situated on human chromosome 10p11.2. It is widely expressed in all human adult tissues and reported to possess transcription inhibition activity and may function as a transcription factor (20). ZNF438 showed an increasing trend in KD in our study, which may suggest that elevated ZNF438 may play an important role in KD.
MYD88 encodes a cytosolic adapter protein that exerts a critical role in the innate and adaptive immune response, which serves as an essential signal transducer for inflammatory signaling pathways, downstream of members of the Toll-like receptor and interleukin-1 receptor families. It was reported that MYD88 contributed to the activation of proinflammatory innate immune mechanisms in the mouse model of coronary arteritis (21). MYD88 was elevated in the PBMCs of untreated KD patients at the acute phase and significantly decreased after IVIG therapy (22). In this integrated analysis, MYD88 was up-regulated in patients with KD, while it was down-regulated in our qRT-PCR results. Hence, more studies are required to investigate the precise roles of MYD88 in KD.
The binding of Fc gamma receptors (FCGRs) to the Fc region of IgG is an important immune response mechanism, and then, this process may induce biological responses, such as phagocytosis and immune complexes (ICs) processing (23). There are five low-affinity genes encoding FCGRs in humans, including FCGR2A, FCGR2B, FCGR2C, FCGR3A, and FCGR3B (24). FCGR2A is usually expressed on immune-responsive cells, such as macrophages, monocytes, neutrophils, and dendritic cells to promote phagocytosis and the production of inflammatory mediators (25, 26). A meta-analysis on the Asians linked the H131R polymorphism in the FCGR2A gene to KD susceptibility (27). A genome-wide association study (GWAS) detected FCGR2A as a susceptibility locus for KD (28). Besides, FCGR3B has been associated with non-response to IVIG and risk of coronary artery aneurysms (CAA) (29). Both FCGR2A and FCGR3B were identified as significantly up-regulated DEGs in this study, which may indicate that these two genes play momentous roles in the pathophysiology of KD.
In addition, the expression levels of these six DEGs in GSE18606 and GSE63881 revealed that elevated levels of ADM, S100A12, ZNF438, MYD88, FCGR2A, and FCGR3B in the acute phase of KD significantly decreased in the convalescent phase. This may further indicate the important roles of these DEGs in KD, which can be served as potential therapeutic targets of KD. One of the limitations of the present study was the small sample size for validation. Hence, further experimental studies on a larger sample size are needed to confirm these results.
4.1. Conclusions
In conclusion, 2923 DEGs (1239 up- and 1684 down-regulated genes) were detected in KD, and the importance and diagnostic value of several DEGs, which may implicate in KD were highlighted. This study is expected to provide clues toward understanding the pathophysiology of KD inflammation. In addition, the closed relationship between the expressions of key DEGs and the stage of KD needs to be further explored in a large sample containing different stages, including follow-up studies. Also, it would be interesting to investigate the effect of some factors, such as gender, age, ethnicity, and outcome, on the DEGs in the future.

