1. Background
Sepsis is a clinical syndrome that complicates severe infection. It is characterized by systemic inflammatory response syndrome (SIRS), immunological dysregulation, microcirculatory abnormalities, and end-organ dysfunction. The burden of sepsis among children hospitalized at the pediatric intensive care unit (PICU) is still high (1). Clinical presentations progress in severity from sepsis to severe sepsis, septic shock, and negative effects on several organs (2). Several diagnostic and biological markers have been studied to monitor the unfavorable evolution of sepsis in critically ill patients, but they are not established in developing countries (3-5). In pediatric sepsis, myocardial dysfunction may aggravate clinical deterioration, resulting in systolic or diastolic ventricular dysfunctions, leading to either shock or death (6, 7). Sepsis-induced myocardial dysfunction (SIMD) has been defined as a reversible decline in ejection fraction (EF) of ventricles, dilatation of ventricles, and less response to fluid resuscitation and vasopressors (8). Nevertheless, the left ventricular ejection fraction (LVEF) is an index that depends on the load and represents the afterload and contractility of the left ventricular rather than the intrinsic contractile myocardial features. In septic shock, while the left ventricular intrinsic contractility is highly reduced, LVEF can be in the normal range if the afterload is seriously depressed (9).
Ferritin is a commonly distributed protein for iron storage that plays a role in the acute-phase response of infection. Ferritin causes an iron-deficient state by reducing the iron available in the serum, and this was thought of as a defensive mechanism for reducing the iron available to invading species (10). Systemic inflammatory response syndrome is triggered in critical diseases due to sepsis, and elevated levels of pro-inflammatory cytokines are present in early disease phases. The pro-inflammatory cytokines promote the synthesis of ferritin and increase the serum ferritin levels (11).
Many biomarkers have been described for diagnosing sepsis, but currently, procalcitonin and C-reactive protein (CRP) are the only ones in routine clinical use (12). Inflammatory biomarkers, such as CRP, are helpful for the identification of considerable bacterial infections in children. Besides, CRP is one of the groups of IL-6-regulated acute-phase reactant proteins and shows potential for determining the seriousness and prognosis of sepsis. A rapid decline in CRP rates in septic patients is associated with an appropriate response to primary antimicrobial treatment (13). Using echocardiography as a noninvasive tool is important for evaluating cardiac function in critically ill children and pediatric patients with sepsis (14, 15). The true clinical significance of cardiac dysfunction caused by sepsis and acute-phase reactants as ferritin and CRP and their relation to patients' outcomes are still uncertain.
2. Objectives
This study evaluated the LVEF as a measurement for cardiac dysfunction, serum ferritin, and CRP as acute-phase reactants and assessed their values as early prognostic markers for outcomes of pediatric sepsis in the PICU.
3. Methods
It is a cross-sectional study conducted in the PICU of the Department of Pediatrics, Minia Maternity and Children University Hospital, Egypt, from September 2019 to September 2020. After obtaining clearance from the Minia University Ethics Committee, Faculty of Medicine, written informed consent was signed by the parents or guardians of the children. The study included 80 cases diagnosed with sepsis who fulfilled the sepsis criteria (2). We considered SIRS in the presence of clinical or laboratory findings of infection. Hypothermia or hyperthermia, altered mental status, and abnormal capillary refill (either "flash" or > 2 seconds) were noted to identify children with septic shock. Other manifestations of organ dysfunction, including hypoxia and laboratory abnormalities, also often accompany the clinical signs of sepsis (2). According to the definition and clinical criteria of sepsis as life-threatening organ dysfunction caused by a dysregulated host response to infection and clinical operationalization, organ dysfunction can be represented by an increase in the sequential (sepsis-related) organ failure assessment (SOFA) score of two points or more. Our patients had a clinical diagnosis of sepsis, made by the presence of at least two of the following indicators: (1) tachycardia, (2) tachypnea, (3) temperature change, (4) leukocytosis, and (5) leukopenia for age in cases with confirmed or suspected infection, based on The Third International Consensus definitions for sepsis and septic shock (sepsis-3) (16). We recruited all cases diagnosed with sepsis, including those who were receiving ventilation for 48 h and/or vasoactive medicines. On the other hand, patients with congenital heart disease, confirmed or suspected endocrine disorder, congenital or acquired immunosuppression, and severe liver dysfunction were excluded from the study.
All the enrolled children underwent detailed history-taking and clinical examination. The patients' data, including age, gender, anthropometry, and admission disease category (respiratory, cardiovascular, gastrointestinal, neurological, and others) were recorded. Laboratory investigations included complete blood count (CBC), ESR, renal and liver function tests, serum glucose and electrolytes such as sodium (Na), potassium (K), calcium (Ca), albumin, arterial blood gases, and blood culture and sensitivity. Serum ferritin and CRP levels were evaluated as acute-phase reactants. Other relevant investigations were required for selected cases, such as CSF examination, brain imaging as CT or MRI, and ECG. The pediatric risk of mortality score (PRISM) was calculated on admission to the PICU. The PRISM is a physiologically based scoring system used to quantify physiologic status, and when combined with other independent variables, it can compute the expected mortality risk and expected morbidity risk. These include changing the outcome to hospital survival/death for the first PICU admission only (17).
All patients received treatment according to the PICU protocol. Enrollment in the study did not change the normal treatment procedures. We followed participants until discharge or death. The patient prognosis was measured by the length of PICU stay, the need for and duration of mechanical ventilation support, and outcome at the end of the hospital stay.
The cardiac disorder evaluation was performed by transthoracic echocardiography to measure LVEF on the first and third days of hospitalization using the Logic v2 GE echo machine with 3 and 6 MHz transducers. All echocardiography exams were conducted blindly by an equivalent pediatric cardiologist in our pediatric cardiology unit using the same device. Measurements were done from both long-axis and short-axis views, and the means calculated by the machine were recorded to avoid observer errors.
3.1. Intervention
The left ventricular end-diastolic dimension (LVEDD) was appraised at the maximum T-wave and the R-wave of the cardiac cycle. Hence, the left ventricular end-systolic dimension (LVESD) was calculated as FS (%) = LVEDD – LVESD / LVEDD × 100. The EF may be described as the percentage of blood the ventricle pumps out with each contraction, estimated as follows: EF (%) = LVEDV – LVESV / LVEDV × 100 (18).
Laboratory measurements: For this purpose, 4 mL of blood was drawn from each patient under complete aseptic conditions, 2 mL of which was added to a plain tube and incubated for 20 min at 37°C. The tube was then centrifuged for 10 min at 3,000 rpm to separate the serum and stored at -20°C till the day of analysis of ferritin and CRP on admission (D1) and 72 h after admission (D3).
3.2. Serum Ferritin
In our clinical laboratory, the standard range for the ferritin level is 10 - 250 ng/mL, with variations based on age and sex. This number is given for orientation only; every laboratory should have its reference range. The quantitative test kit for ferritin uses a solid-phase enzyme combined with an immune sorbent assay. The assay uses one anti-ferritin antibody in the antibody-enzyme conjugate solution for solid phase (microtiter wells) immobilization, along with another mouse monoclonal anti-ferritin antibody. Then, CRP is estimated using the latex agglutination assay with the AVITEX CRP kit. The CRP latex test is a rapid agglutination procedure for direct detection and semi quantization of CRP on a slide. The principle of the test involves an immunological reaction between CRP (as an antigen), and the corresponding antibody fixed to the surface of latex particles. Thus, CRP in the sample reacts with IgG-coated polystyrene latex particles in the reagent, forming visible agglutination. The normal range for CRP levels in children in our clinical laboratory is up to 6 mg/L (19).
Statistical analysis: Data were analyzed using SPSS version 20.0 and MedCalc version 12.2.1. Data were described using median and interquartile range (IQR) for quantitative values. For categorical data, numbers and percentages were used. The Kolmogorov-Smirnov test was used to evaluate the normality of data, while the Mann-Whitney test was applied to compare independent groups, and the Wilcoxon test was used to compare dependent groups if data were non-parametric. The chi-square test or Fisher's exact test was applied for the comparison of categorical data. We also calculated the receiver operating characteristic (ROC) curve. Hence, the area under the curve was considered to assess the capability of both serum ferritin and ejection fraction to estimate the death rate. The ideal threshold was considered the value that was associated with the maximum area of the ROC curve. In addition, we applied the Spearman correlation to explain the relationship between the two parameters. Multiple binary logistic regressions were used to create a predictive model. A P value < 0.05 was considered significant.
4. Results
Our study included 80 critically ill children with a diagnosis of sepsis. They were 32 (40.0%) males, and 48 (60.0%) females, and their ages ranged from one month to six years. The PRISM score on admission ranged from 5 to 25 with a mean ± SD of 15.35 ± 7.9. Patients' demographic, clinical, and laboratory data are shown in Table 1.
Table 1.
Socio-Demographic Characteristics and Laboratory Data of 80 Patients Studied on Admission a
| Variables | Total (n = 80) |
|---|---|
| Age (y) | |
| 1 month to 2 | 68 (85) |
| 2 to 6 | 12 (15) |
| Sex | |
| Male | 32 (40.0) |
| Female | 48 (60.0) |
| Residence | |
| Rural | 52 (65) |
| Urban | 28 (35) |
| Weight (kg) | 9.1 ± 4.4 (3.5 - 23) |
| Length/height (cm) | 75.9 ± 17.7 (55 - 120) |
| Consanguinity | |
| + ve | 24 (30) |
| - ve | 56 (70) |
| Family history of similar condition | |
| + ve | 18 (22.5) |
| - ve | 62 (77.5) |
| CBC | |
| Hemoglobin (g/dL) | 9 ± 1.5 (8 - 10) |
| TLC (× 109/L) | 16.8 ± 9.3 (9.5 - 23.5) |
| Platelets (× 109/L) | 222.6 ± 174.9 (82.5 - 310) |
| Liver enzymes | |
| ALT | 86.8 ± 96.8 (10 - 485) |
| AST | 60.2 ± 64.3 (11 - 354) |
| Kidney function tests | |
| Urea (mg/dL) | 42.4 ± 26.8 (11 - 120) |
| Creatinine (mg/dL) | 0.7 ± 0.4 (0.3 - 2) |
| Prothrombin time (sec) | 16.8 ± 3.7 (11 - 25) |
| Albumin (g/dL) | 3.6 ± 0.6 (2.5 - 5.5) |
| Electrolytes | |
| Sodium (mmol/L) | 142.7 ± 10.9 (125 - 168) |
| Potassium (mmol/L) | 4.1 ± 0.9 (2.5 - 6.5) |
| Calcium (mg/dL) | 8 ± 1.8 (5 - 10) |
| CRP (mg/dL) | 61.6 ± 40.4 (24 - 104) |
| Ferritin (ng/mL) | 535 ± 183.3 (240 - 1150) |
Abbreviations: SD, standard deviation; CRP, C-reactive protein; CBC, complete blood count; TLC, total leucocyte count; AST, aspartate transaminase; ALT, alanine transaminase.
a Values are expressed as No. (%) or mean ± SD (range).
According to the findings of our study of 80 participants, Klebsiella was the most common Gram-negative organism isolated from blood culture causing sepsis (18.75%), followed by S. haemolyticus (16.25%). No culture growth was observed for 11 out of 80 children (13.75%) (Appendix 1). The diagnoses among the study patients showed that 38 patients had pneumonia (47.5%), 11 (13.75%) had viral encephalitis, nine (11.25%) had bacterial meningitis, 18 (20.0%) had gastro-enteritis, and four (5.0%) had sepsis with no specific focus of infection (Appendix 2).
In our study, we found that 38 out of 80 (47.5%) patients had cardiac dysfunction (EF < 55%) and
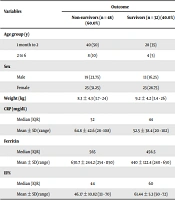
most participants showed high levels of ferritin and CRP, with a mean of 535 ng/mL and 61.6 mg/dL, respectively. In addition, as shown in Table 2, we found a considerable decline in serum ferritin and CRP on the third day of hospitalization (P < 0.001). Also, we found a significant rise on the third day of hospitalization concerning EF (P = 0.001). Regarding the outcome, 48 (60%) patients were non-survivors while 32 (40%) were survivors. Besides, EF% was significantly lower in those who died than in those who survived (P < 0.001). In addition, the serum level of ferritin was significantly higher in those who died than in those who survived (P = 0.021), but there was no significant difference in the outcome regarding CRP (Table 3). We found a significantly higher level of serum ferritin in cases suffering from cardiac dysfunction (EF < 55%) than their healthy counterparts (EF ≥ 55%), with a mean ± SD of 625.6 ± 214.3 and 490 ± 216.2, respectively, and a P-value of 0.029 (Appendix 3).
Table 2.
Serum Ferritin Level, CRP, and Ejection Fraction (EF) Among Study Cases on the Day of Admission (D1) and Day 3 (D3)
| Values | D1 | D3 | Wilcoxon Test | P-Value a |
|---|---|---|---|---|
| Ferritin (ng/mL) | -3.677 | < 0.001* | ||
| Median (IQR) | 522 | 400 | ||
| Mean ± SD (range) | 535 ± 183.3 (240 - 1150) | 447.8 ± 183.8 (335.5 - 562) | ||
| CRP (mg/dL) | -3.648 | < 0.001* | ||
| Median (IQR) | 48 | 24 | ||
| Mean ± SD (range) | 61.6 ± 40.4 (24 - 104) | 37.6 ± 34 (12 - 48) | ||
| EF% | -3.417 | 0.001* | ||
| Median (IQR) | 55 | 60 | ||
| Mean ± SD (range) | 52.28 ± 11.2 (41.5 - 60) | 59.65 ± 9.64 (55 - 68.5) |
Abbreviations: SD, standard deviation; CR, C-reactive protein.
a P < 0.05 is significant and P < 0.001 is highly significant.
Table 3.
Outcome of Study Cases Regarding Ferritin Level and Ejection Fraction (EF) % a
| Variables | Outcome | ZMWU | P-Value b | |
|---|---|---|---|---|
| Non-survivors (n = 48) (60.0%) | Survivors (n = 32) (40.0%) | |||
| Age group (y) | -3.207 | 0.032 | ||
| 1 month to 2 | 40 (50) | 28 (35) | ||
| 2 to 6 | 8 (10) | 4 (5) | ||
| Sex | -4.205 | 0.168 | ||
| Male | 19 (23.75) | 13 (16.25) | ||
| Female | 25 (31.25) | 23 (28.75) | ||
| Weight (kg) | 8.3 ± 4.3 (3.7 - 24) | 9.2 ± 4.2 (3.4 - 26) | -2.608 | 0.358 |
| CRP (mg/dL) | -3.401 | 0.188 | ||
| Median (IQR) | 52 | 44 | ||
| Mean ± SD (range) | 64.8 ± 42.6 (28 - 108) | 52.5 ± 38.4 (20 - 102) | ||
| Ferritin | -2.30 | 0.021* | ||
| Median (IQR) | 565 | 456.5 | ||
| Mean ± SD (range) | 630.7 ± 244.2 (254 - 1150) | 440 ± 122.4 (240 - 650) | ||
| EF% | -4.106 | < 0.001* | ||
| Median (IQR) | 44 | 60 | ||
| Mean ± SD (range) | 46.17 ± 10.82 (33 - 70) | 61.44 ± 5.3 (50 - 72) | ||
Abbreviations: SD, standard deviation; ZMWU test, Z value of Mann-Whitney U test.
a Values are expressed as No. (%) unless otherwise indicated.
b P < 0.05 is significant and P < 0.001 is highly significant.
As shown in Table 4, the level of ferritin had a sensitivity and specificity of 62.5 and 81.2%, respectively, concerning the estimation of death rate (P = 0.002) with a threshold of > 550 ng/mL, while for EF, these values respectively were 83.3 and 87.5% (P < 0.001) with a threshold of ≤ 56%.
Table 4.
Serum Ferritin and Ejection Fraction (EF) % as Predictors of Death
| Variables | Cut-off | AUC | P value a | Sensitivity (%) | Specificity (%) | PPV (%) | NPV (%) |
|---|---|---|---|---|---|---|---|
| Ferritin | > 550 | 0.741 | 0.002* | 62.5 | 81.2 | 83.3 | 59.1 |
| EF% | ≤ 56 | 0.887 | < 0.001* | 83.3 | 87.5 | 90.9 | 77.8 |
Abbreviations: AUC, area under the curve; PPV, positive predictive value; NPV, negative predictive value.
a P < 0.05 is significant and P < 0.001 is highly significant.
In our study, there was a significant difference concerning the duration of mechanical ventilation (h) (P = 0.002), duration of inotropes (h) (P = 0.008), and the highest inotropic value (P = 0.004). Univariate and multivariable binary logistic regression models to predict the death rate are shown in (Table 5), which included parameters with a significant association with death rate. According to the findings, two predictors of death included cardiac dysfunction and ferritin. Patients suffering from cardiac dysfunction were at a higher risk of death than their healthy counterparts (P = 0.035). A rise in ferritin by 10 units was correlated with a 10% rise in the odd of infant death (AOR = 1.01, 95% CI = 1.0 - 1.02).
Table 5.
Univariate and Multivariable Binary Logistic Regression to Predict the Death Rate
| Predictors | Mortality | |||
|---|---|---|---|---|
| Crude OR (95% CI) | P-Value a | Adjusted OR (95% CI) | P-Value a | |
| EF | ||||
| No cardiac dysfunction | 1.00 (Reference) | 1.00 (Reference) | ||
| Cardiac dysfunction | 45 (4.86 - 416.5) | 0.001 | 63.22 (1.35 - 2963) | 0.035* |
| Serum ferritin | 1.01 (1.00 - 1.02) | 0.005 | 1.01 (1.00 - 1.02) | 0.038* |
| CRP | 1.01 (0.99 - 1.02) | 0.344 | - | - |
| PRISM score | 2.14 (0.20 - 22.7) | 0.526 | - | - |
| Duration of MV (h) | 1.03 (1.01 - 1.04) | 0.002 | 1.00 (0.96 - 1.04) | 0.874 |
| Duration of inotropes (h) | 1.03 (1.01 - 1.05) | 0.008 | 0.99 (0.95 - 1.03) | 0.538 |
| Max. inotropic score | 1.03 (1.01 - 1.06) | 0.004 | 1.00 (0.95 - 1.05) | 0.924 |
Abbreviations: MV, mechanical ventilator.
a P < 0.05 is significant and P < 0.001 is highly significant.
5. Discussion
Pediatric sepsis remains an important cause of PICU admission and mortality. Our research intended to evaluate the association between cardiac dysfunction, serum ferritin levels, and CRP as early prognostic markers of outcome in children with sepsis. We studied 80 infants and children diagnosed with sepsis caused by various factors hospitalized at the PICU. Pneumonia was the cause of sepsis in the majority of our patients (47.5%), which is consistent with previous studies that mentioned the respiratory system with pneumonia (43%) as a major infection site and concluded that chest infection was the most common clinical source of sepsis (20, 21).
Cardiac dysfunction is a major cause of clinical deterioration among children (7). In severe sepsis or septic shock, decreased LVEF is prevalent. Clinicians now have a better understanding of cardiac dysfunction caused by sepsis attributable to the use of bedside echocardiography in the ICU (22). The echocardiogram is used to manage those suffering from septic shock during volumetric resuscitation and is the ideal method of vasoactive drug evaluation (23, 24). Our results showed that 47.5% of the participants had cardiac dysfunction (EF < 55%), which is higher than the values reported by previous similar studies, including 37% (6), 27% (25), and 33% (26). The difference in age and race may explain these discrepancies.
In our study, the mortality rate of severe sepsis was 60.0%. We found that the median EF% was considerably lower in non-survivors (44%) than in survivors (60%) (P < 0.001). Another consecutive study investigated around 50 infants hospitalized at the PICU due to septic shock and reported a more declined EF% in those who did not survive than in those who survived (27).
Although clinicians have a widely known understanding of sepsis-induced myocardial dysfunction, the association between left ventricular systolic dysfunction (LVSD) and the prognosis is still controversial (26, 28). It has been reported that LVSD is associated with septic shock mortality in adults (29, 30). Conversely, a meta-analysis showed that LVSD, defined as LVEF < 50%, was not correlated with the prognosis of severe sepsis or septic shock in adults (31). Contrary to our results, other researchers concluded that myocardial dysfunction is highly prevalent in pediatric septic shock and is not associated with mortality, but it is associated with higher severity of illness and the use of vasoactive drugs (32).
Most participants showed enhanced levels of ferritin and CRP that declined on the third day of hospitalization, so that we found a significant difference between the first day of admission (median 522 ng/mL) and the third day (median 400 ng/ml) (P < 0.001). Also, we found that the median ferritin level was significantly higher in those who died of sepsis (565 ng/mL) than in those who survived (456.5 ng/mL) (P = 0.021). This comes in harmony with other researchers who concluded that ferritin was raised in children with sepsis and septic shock, and a higher ferritin level was associated with a poorer outcome in pediatric critical care patients (33-35). The median value of C-reactive protein was higher on the first day of hospitalization (48 mg/L) than two days later (D3) (24 mg/L), and the difference was statistically significant (P < 0.001), but there was no significant difference in the outcome regarding CRP. That comes in harmony with a similar study, which concluded that CRP alone or in combination with procalcitonin were not independent predictors of 28-day mortality in septic shock cases (36). On the other hand, in contrast to our findings, a previous study reported that the CRP level > 100 mg/L on admission was associated with an increased risk of mortality and prolonged length of stay (LOS) in survivors, and CRP may be a simple, early marker for prognosis in ICU admissions for sepsis (37). However, this study was a multicenter study with a large sample size conducted on 851 Swedish adult patients.
Based on our findings, the median value of serum ferritin level was considerably higher in those who were suffering from cardiac dysfunction (EF < 55%) than their healthy counterparts (EF ≥ 55%) with a mean ± SD of 625.6 ± 214.3 and 490 ± 216.2, respectively (P = 0.029). Also, this is consistent with the study performed by Tonial et al., who reported that the mean serum ferritin level was considerably higher in those suffering from cardiac dysfunction than their healthy counterparts (38).
The ROC-AUC value of the ferritin level of > 550 ng/mL as the threshold was 0.741, and it showed a sensitivity and specificity of 62.5 and 81.2%, respectively. The parameters significantly correlated with death were cardiac dysfunction and serum ferritin. Those with cardiac dysfunction were at a higher risk of death than their healthy counterparts (P = 0.035), and a 10-unit increase in serum ferritin was correlated with a 10% increase in the odds of death (AOR = 1.01, 95% CI = 1.0 - 1.02), which is consistent with the study by Garcia et al. (33) who reported that a ferritin level of > 500 ng/ml was correlated with an increased death rate.
5.1. Limitations
Some limitations of this study should be indicated. The first limitation is related to EF% measurement by echocardiography, which is an operator-dependent assessment. Despite its limitation, this method was chosen because it is available in most PICU services in the Minia University Hospital. However, echocardiography was carried out by an expert, highly qualified pediatric cardiologist. The second limitation is the limited number of patients included in this study. Therefore, we recommend further studies on larger sample size.
5.2. Conclusions
Cardiac dysfunction estimated by an echocardiogram (EF < 55%) and serum ferritin values (≥ 500 ng/mL) on the day of admission were significantly associated with unfavorable outcomes. Moreover, cardiac dysfunction can be applied as an early prognostic marker in pediatric cases with sepsis hospitalized at the PICU.