


1. Background
According to the World Health Organization (WHO) definition, overweight and obesity are defined as abnormal or excessive fat accumulation (1). Studies show that one-third of obese children and 80% of obese adolescents are obese when they reach adulthood. In the last decade, a significant increase has been detected in the prevalence of cardiovascular diseases among children, with family history, obesity, high blood pressure, smoking, high-density lipoprotein (HDL), and low-density lipoprotein (LDL) cholesterol levels as essential role players (2). Chronic inflammatory conditions are known to play a role in correlating obesity and atherosclerosis/cardiovascular disease (CVD). Autopsy studies have presented that coronary atherosclerosis starts in childhood (2). The presence of hyperinsulinemia and insulin resistance in obese patients increases the risk of type 2 diabetes mellitus (DM), CVD, hyperlipidemia, and hypertension at later ages (3).
In studies with adults, obesity with or without DM and metabolic syndrome is associated with an increased risk of CVD and cardiovascular and non-cardiovascular death. However, a few studies have shown an increased risk of sudden cardiac death, and some indicate that these patients have repolarization abnormalities (4). On the other hand, this has not been clearly indicated in childhood.
It is known that prolonged cardiac repolarization may cause sudden cardiac death by increasing cardiovascular susceptibility to ventricular arrhythmias. Today, different methods are used to predetermine ventricular arrhythmias linked to repolarization irregularity. In recent clinical studies, QT, QT corrected for heart rate (QTc), QT dispersion, P wave dispersion, Tp-e/QT, and Tp-e/QTc myocardium are emphasized for reflecting the susceptibility to arrhythmias and the risk of sudden cardiac death (4). Previous studies have shown that the Tp-e interval can be used as a marker of ventricular repolarization.
2. Objectives
This study aimed to investigate the effect of obesity on cardiac electrical activity in children by comparing Tp-e intervals in obese and healthy children and evaluating the correlation between Tp-e intervals and insulin resistance in obese children.
3. Methods
Patients undergoing a follow-up due to obesity in the Pediatric Endocrine Department of our hospital were included in the study as the patient group. The control group comprised individuals without the chronic disease who applied to the Pediatric Cardiology Outpatient Department. The patients' demographic data were obtained from the patients’ medical files and the hospital information management system. Previous blood tests, electrocardiogram (ECG), and echocardiography (ECHO) of the patients were evaluated.
The same physician conducted the ECG evaluations. The ECGs were performed with 25 mm/s velocities and 10 mm/mV amplitude with 12 derivations and interpreted. The ventricular rate of three consecutive beats in the DII derivation was calculated and averaged, and the average heart rate of each patient was determined. The QT interval, QTc, Tp-e, and Tp-e/QT calculations were also made. Measurements were carried out manually with a ruler and a magnifying glass. The same pediatric cardiologist conducted echocardiography examinations with a two-dimensional and color Doppler echocardiography device (GE Vivid S5®). Our hospital's Clinical Research Ethics Committee approved the study with a decision dated 21.06.2017 and numbered 523.
Patients aged 12 - 18 who were obese adolescents (Body Mass Index, BMI > 95p) in puberty stage, with at least Tanner stage 2, without another chronic disease (hypertension, etc.), with exogenous obesity, complete biochemical tests, ECG, and ECHO evaluations at the time of diagnosis were included in the study. For the control group, non-obese patients having the same characteristics were enrolled. Patients who did not meet the inclusion criteria, in the prepubertal period, with chronic diseases and incomplete tests were excluded from the case group. People with a family history of sudden death under the age of 40 were excluded from the control group.
3.1. Statistical Analysis
The obtained data were analyzed by SPSS 17.0 software. Showing showing absolute numbers and percentages were prepared, and arithmetic averages were calculated when necessary. The chi-square test and, where necessary, the independent sample t test or its nonparametric equivalent, the Mann Whitney U test, and Pearson correlation analysis were used for statistical analysis. The P < 0.05 was considered statistically significant.
4. Results
The study recruited 100 cases, including 50 patients and 50 controls. No statistically significant difference was found between the two groups regarding gender (P = 0.316). The average age of the patient group was 14.3 ± 1.9 years, and that of the control group was 14.0 ± 2.2 years. There was no statistically significant difference between the groups regarding average age (P = 0.412).
The height, weight, and BMI of the patient and control groups are shown in Table 1. The height, weight, and BMI were higher in the patient group than in the control group (P = 0.041, P = 0.002, and P = 0.001, respectively).
| Variables | Patient Group | Control Group | P |
|---|---|---|---|
| Height (cm) | 162.4 ± 9.6 | 154.3 ± 4.5 | 0.041 |
| Weight (kg) | 84.2 ± 12.7 | 52.3 ± 2.4 | 0.002 |
| BMI | 31.9 ± 3.7 | 22.1 ± 1.9 | 0.001 |
a Values are expressed as mean ± SD.
No difference was detected between the patient and control groups in the puberty stage (P = 0.305). The number of patients with acanthosis nigricans was 22 (44%) in the patient group.
The average, standard deviation (SD), minimum, and maximum values of the laboratory parameters in the patient group are presented in Table 2.
| Variables | Mean ± SD | Median | Minimum - Maximum |
|---|---|---|---|
| Fasting Blood Glucose (mg/dL) | 93.5 ± 11.5 | 92 | 73.0 - 155.0 |
| Fasting insulin (μIU/mL) | 17.2 ± 12.6 | 13.1 | 5.3 - 71.8 |
| Total cholesterol (mg/dL) | 170.7 ± 29.7 | 170.5 | 122.0 - 270.0 |
| HDL-cholesterol (mg/dL) | 41.6 ± 8.5 | 40.5 | 25.0 - 68.0 |
| LDL-cholesterol (mg/dL) | 106.8 ± 26.0 | 100.5 | 60.0 - 188.0 |
| Triglyceride (mg/dL) | 116.0 ± 49.0 | 112.5 | 48.0 - 256.0 |
| Creatinine (mg/dL) | 0.7 ± 0.3 | 0.6 | 0.30 - 1.2 |
| TSH (mU/L) | 8.6 ± 9.3 | 2.3 | 0.8 - 30.2 |
| Free T4 (pg/mL) | 2.8 ± 5.3 | 0.91 | 0.7 - 8.2 |
| Sodium (mEq/L) | 139.4 ± 2.1 | 139.0 | 135.0 - 145.0 |
| Potassium (mEq/L) | 4.2 ± .0.4 | 4.1 | 3.6 - 5.3 |
| Calcium (mg/dL) | 9.7 ± 0.6 | 9.8 | 8.4 - 11.0 |
The HOMA-IR calculations of the patient group (n = 50) are presented in Table 3.
| Examination | Values | Median | Minimum - Maximum |
|---|---|---|---|
| HOMA-IR | 3.9 ± 2.6 | 2.9 | 1.1 - 14.0 |
| Threshold value for HOMA-IR 3.4 | |||
| Below | 28 (56) | ||
| Above | 22 (44) |
a Values are expressed as mean ± SD or No. (%).
In the patient group, HOMO-IR > 3.4 was found in 18 out of 22 patients with acanthosis nigricans (44%). Although heart rate and QTc were higher in the patient group than in the control group, this difference was not statistically significant (P = 0.071 and P = 0.156, respectively). There were no cases with a QTc value > 440 msec in both patient and control groups. However, the Tp-e interval was statistically significantly higher in the patient group than in the control group (P = 0.001) (Table 4).
| Variables | Patient group | Control group | P |
|---|---|---|---|
| Heart Rate (/min) | 84 ± 16 | 78 ± 16 | 0.071 |
| QTc (msec) | 388 ± 19 | 382 ± 27 | 0.156 |
| Tp-e interval (msec) | 85 ± 8 | 77 ± 6 | 0.001 |
a Values are expressed as mean ± SD.
To evaluate the impact of insulin resistance on the parameters, we compared the ECG parameters in the patient group by the presence of acanthosis nigricans, HOMA-IR above the threshold value of 3.4, and the presence of both acanthosis nigricans and HOMA-IR above the threshold value. No statistically significant difference was determined between these groups (P > 0.05). When patients with acanthosis nigricans, HOMA-IR value > 3.4, and both acanthosis nigricans and HOMA-IR value > 3.4 were compared with the control group separately in terms of the ECG parameters, only the Tp-e values were statistically significantly higher in all three groups than in the control group. At the same time, there was no difference in other parameters (Table 5).
| Parameters and Groups | n | Mean ± SD | P |
|---|---|---|---|
| Heart rate | 0.122 | ||
| With acanthosis nigricans | 22 | 84 ± 13 | |
| Control | 50 | 78 ± 16 | |
| QTc | 0.397 | ||
| With acanthosis nigricans | 22 | 388 ± 21 | |
| Control | 50 | 382 ± 27 | |
| Tp-e | 0.001 | ||
| With acanthosis nigricans | 22 | 84 ± 8 | |
| Control | 50 | 77 ± 6 | |
| Heart rate | 0.129 | ||
| HOMA-IR > 3.4 | 22 | 84 ± 13 | |
| Control | 50 | 78 ± 16 | |
| QTc | 0.606 | ||
| HOMA-IR > 3.4 | 22 | 385 ± 22 | |
| Control | 50 | 382 ± 27 | |
| Tp-e | 0.001 | ||
| HOMA-IR > 3.4 | 22 | 86 ± 8 | |
| Control | 50 | 77 ± 6 | |
| Heart rate | 0.163 | ||
| Acanthosis nigricans +HOMA- IR > 3.4 | 18 | 84 ± 13 | |
| Control | 50 | 78 ± 16 | |
| QTc | 0.415 | ||
| Acanthosis nigricans +HOMA- IR > 3.4 | 18 | 388 ± 22 | |
| Control | 50 | 382 ± 27 | |
| Tp-e | 0.001 | ||
| Acanthosis nigricans +HOMA- IR > 3.4 | 18 | 84 ± 8 | |
| Control | 50 | 77 ± 6 |
When the patient and control groups were considered together and compared according to gender in terms of ECG parameters, no significant difference was found in heart rate, QTc, and Tp-e between males and females (P > 0.05). On the other hand, when only the patient group was evaluated, there were no statistically significant differences in heart rate and QTc between females and males (P > 0.05), but Tp-e was statistically significantly higher in males than in females.
The obese group with insulin resistance (n = 18), the obese group without insulin resistance (n = 32), and the control group (n = 50) were compared in terms of heart rate, QTc, and Tp-e firstly as a group of three and then as groups of two using the Bonferroni correction test. While no difference was detected in the group of three and among the groups of two in terms of QTc and heart rate (P = 0.360 and P = 0.198), there was a difference within the group of three in terms of Tp-e (P = 0.001). When the groups were compared in terms of Tp-e two by two with the Bonferroni correction test, a difference was found between the control group and both of the obese groups, but there was no significant difference between the group with insulin resistance and the group without insulin resistance.
In addition, when the obese group with insulin resistance (n = 18), the obese group without insulin resistance (n = 32), and the control group (n = 50) were compared separately as groups of two in terms of heart rate, QTc, and Tp-e values, while no statistical difference was determined for other parameters in the paired comparisons of the groups (P > 0.05), a statistically significant difference was found between the obese group with insulin resistance and the control group and between the obese group without insulin resistance and the control group in terms of Tp-e (P = 0.001 for all).
5. Discussion
In the last report of the WHO, it has been stated that the number of obese people has doubled since 1980. Besides, 42 million children under the age of five were overweight or obese in 2013, more than 1.9 billion adults were overweight in 2014, and 600 million of them were obese (5). Also, obesity is an increasing problem in adulthood and childhood in Turkey (6). It is known that individuals with childhood obesity are also at risk of obesity in adulthood. Studies have shown that one-third of obese children and 80% of obese adolescents are obese when they reach adulthood (7, 8). Childhood obesity paves the way for several chronic diseases. Hypertension, coronary heart disease, stroke, and sudden cardiac death appear to increase the risk of obesity-related mortality (9, 10). Therefore, the prevention and treatment of obesity and its complications are essential.
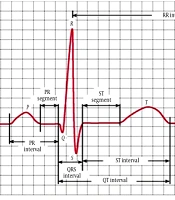
Many ECG parameters provide preliminary information regarding current or future obvious clinical conditions. The QT interval and T wave are essential as they show cardiac repolarization. The interval between the point where the T wave reaches its maximum amplitude and the end of the T wave (Tp-e interval) corresponds to the ventricular repolarization dispersion (11). The peak of the T wave (the point where it reaches maximum amplitude) is regarded as Tp. The point where the tangent of the descending limb of the T wave shows when approaching the isoelectric line crosses the isoelectric line is called Te. The Tp-e interval, on the other hand, is the interval between Tp and Te (Figure 1).

Waves and intervals making up electrocardiography
The increased prevalence of obesity in children coincides with the increased risk of cardiovascular diseases (12). However, most studies have been conducted on adults, reporting sudden cardiac death in adult obese patients without any cardiac abnormalities (13). According to a study, the sudden cardiac death risk of those with metabolic syndrome was 1.7 times more than that of a normal population. There are a few studies evaluating obesity and obesity-related sudden cardiac death risk. A 21-year prospective follow-up study found that sudden cardiac death risk increased by 68% with metabolic syndrome (14). Studies of obesity, metabolic syndrome, insulin resistance, and sudden cardiac death in adults emphasize that the risk of sudden cardiac death is associated with cardiac repolarization abnormalities (10). However, this has not been clearly demonstrated in childhood due to the limited number of studies.
There is a correlation between the increased risk of some adverse cardiac consequences and ECG changes. Some of them include increased heart rate, prolonged PR interval, the presence of abnormal deviation in QRS duration, QT interval, and the presence of abnormal deviation in the electrocardiographic axis. A prospective study found a correlation between resting heart rate and cardiovascular mortality (15). In our study, obese and control groups were compared in terms of resting heart rates. Although the heart rate of the obese patient group was higher, this was not statistically significant. Studies show that the increased heart rate is not limited to obese people, but similar changes also appear in metabolic syndrome, type 2 DM, and insulin resistance. However, in our study, no statistically significant difference was found between patients with insulin resistance and without insulin resistance within the obese group in terms of resting heart rate.
Increased free fatty acid-related endothelial dysfunction and fibrous plaque formation in obese children are the main initiation mechanisms of heart problems (9). Many studies show that early cardiac repolarization abnormalities occur as a result of these conditions. The T wave is the best ECG wave to indicate cardiac repolarization, and studies present the Tp-e interval, QTc, or Tp-e/QT associated with impaired repolarization abnormalities and increased sudden cardiac death (10). A study evaluated heart repolarization by magnetocardiography and found early myocardial repolarization heterogeneity in obese patients with type 2 DM (8).
A study of 60 obese children (30 with metabolic syndrome) and 23 control patients found that QTc increased significantly in the obese patient group compared to the control group and was even higher in the obese children with metabolic syndrome (9). Also, a correlation exists between carotid intima-media thickness and cardiac repolarization abnormalities, and the increased carotid intima-media thickness is correlated with increased QTc (9, 16, 17). A study has reported that acute prolonged repolarization of the ventricles and high QTc values were found in cases with physiological hyperinsulinemia, regardless of insulin sensitivity (18). In our study, the QTc interval was another indicator of cardiac repolarization, but no significant difference was observed between the obese and healthy control groups and between those with and without insulin resistance within the obese group. An increase in ventricular repolarization dispersion is a significant risk factor for ventricular arrhythmias. Therefore, the Tp-e interval is a non-invasive screening method for arrhythmogenesis. The Tp-e interval and, more precisely, the Tp-e/QT ratio can be considered essential indices for indicating sudden cardiac death risk. In adult studies, obesity with or without DM and metabolic syndrome was associated with an increased risk of cardiovascular disease and cardiovascular and non-cardiovascular death. Studies show that such patients have repolarization abnormalities (10). To the best of our knowledge, there are no studies evaluating the Tp-e interval for indicating cardiac mortality risk factors in obese patients in childhood. Since it is a rarely studied ECG parameter, its age-based normal values in childhood are not clearly known. In our study, the Tp-e interval was higher in the obese patient group than in the control group, which may be a risk factor for cardiac pathologies and mortality. No statistical difference was detected between those with and without insulin resistance within the obese patient group regarding the Tp-e interval.
Many studies report a correlation between BMI and prolonged QTc interval (19, 20). However, a study of healthy volunteers aged 22-25 detected no significant correlation between BMI and QTc (21). Similarly, there are contrasting results for the correlation between BMI and QTc in children (9, 22), but studies with broad participation do not support the ECG and obesity correlation in childhood to enable straightforward interpretation. In our study, on the other hand, no correlation was found between BMI, HOMA-IR values, and QTc. Likewise, there was no correlation between Tp-e, another ECG parameter reflecting cardiac repolarization, and BMI and HOMA-IR values.
The study has limitations. First, the patient group consisted of those referred to a tertiary healthcare institution, and the sample size was small. Therefore, the data obtained should be verified in a broader-based study. On the other hand, our study is important as a processor for these observations. This is not a long-term prospective study. Therefore, it arouses suspicion about the future meaning of the obtained ECG changes. Besides, although the ECG changes in the study were different between the normal population and the patient population, the long-term meaning and significance of the values of both groups remaining within the normal range cannot be understood by this study.
5.1. Conclusion
In conclusion, this study provides significant findings for detecting early symptoms of future cardiovascular events in childhood obesity cases. The repolarization differences obtained, when compared to the normal population, may reflect obesity-related early subclinical symptoms. However, there is a need for prospective studies with larger samples to capture these early changes and their future meaning.
