


1. Background
Acute lymphoblastic leukemia (ALL), a heterogeneous hematological malignancy, is characterized by the proliferation of immature lymphoid blood cells in bone marrow (BM), peripheral blood (PB), and other organs. In the United States, the incidence rate of ALL is estimated 1.38 per 100,000 people per year (1). Regarding the incidence rate, about 5,930 new cases of ALL and 1,500 deaths from ALL were reported in 2019 (2). The median age of ALL diagnoses is 15 years (3); but in 55.4%, 28%, and 12.3% of patients, the diagnosis age is under 20 years, 45 years or older, and 65 years or older, respectively (4). ALL is the most common hematological malignancy in the pediatric population, as it accounts for 75 - 80% of acute leukemia cases in this population. Among adults, ALL makes up to 20% of acute leukemia cases (5, 6).
In recent decades, the cure rate and survival outcomes have significantly improved in patients with ALL, specifically in children (7). Based on SEER database analysis, the five-year overall survival rate in pediatrics was reported 89% (7, 8). Remissions generally owe to better understanding of molecular genetics and pathogenesis of the disease, combination of treatment and risk (risk-adapted), emergence of new target factors, and use of allogeneic hematopoietic stem cell transplantation (Allo-HSCT).
Among children, B-cell lineage ALL is the most common form, accounting for 80% of cases (9). Certain factors concerning the patient and the malignancy could affect the prognosis of patients with ALL. Some of these factors include the patient’s age, WBC count, genetic\cytogenetic\immunophenotypic subgroup, and CNS involvement, which are of great importance in investigating the risk and prognosis of ALL in children. In 1993, the children's oncology group (COG) and the children's cancer group (CCG) identified a set of risk criteria classified as high and standard risk (10). In children with precursor B-cell ALL, almost every clinical trial considers age and leukocyte count for risk stratification. Different cooperative groups have been associated with a combination of clinical, biological, and outcome variables to classify patients with precursor B-cell ALL in risk groups (11, 12).
2. Objectives
The present study aimed to evaluate the survival rate of children with precursor B-cell ALL and investigate the prognosis factors affecting their survival rate. Due to the limitations in genetic and cytogenetic data registry, we classified the risks of childhood precursor B-cell ALL using demographic characteristics, laboratory characteristics, and extramedullary diseases, and having considered the best competing risks model (13). Because of high treatment and medical equipment costs, this risk evaluation method could potentially be beneficial in developing and underprivileged countries.
3. Methods
In this retrospective cohort study, patients younger than 15 years old with ALL who received treatment from 2007 to 2016 in the Sheikh Hospital of Mashhad, Iran, were included. During this period, a total of 600 patients were evaluated originally at the start of the study. Patients with T-cell ALL and duplicate or incomplete clinical data were excluded from the study. Finally, 393 patients with precursor B-cell ALL were included in the analysis.
Initially, childhood ALL was diagnosed by direct smear sampling of BM stained with Giemsa that confirmed the presence of at least 20% of lymphoblasts. Using flow cytometry, the B-cell lineage ALL (with CD19, CD20, CD10, and CD22 cell surface markers) could be differentiated. Complete remission was defined as the disappearance of blasts in the CSF, BM lymphoblasts of under 5%, and complete absence of clinical symptoms. In this center, the treatment protocol for patients with ALL was based on Berlin-Frankfurt-Münster 2009 (14) therapy and could be modified according to the patients’ physical conditions and response to the treatment protocol. Patients’ demographics, laboratory results, and treatment procedure information were collected from clinical documents. We reported other information in another study (15). Patients’ clinical manifestations were considered as prognostic variables. The cut-off point for platelet count was identified corresponding to a study by Daly (16).
Patients’ baseline characteristics were reported descriptively. The end points of study were overall survival (OS), event-free survival (EFS), first relapse, and non-relapse mortality (NRM). OS and first-relapse were defined as the time of treatment until death from any cause and relapse, respectively. EFS duration was calculated as the interval from the date of treatment to the date of the last follow-up or of the first event. NRM included all deaths without relapse.
Kaplan-Meier method was used to estimate EFS and OS probabilities. NRM was a competing risk for the first relapse. Univariate and multiple analyses were performed using the Cox proportional hazards model for OS and EFS and the classical fully specified sub-distribution model (13) for first-relapse and NRM. Multiple model selection in Cox proportional hazards model was done with a backward method for selecting the features with the highest prognostic value.
Prognostic factors, including age, gender, WBC count, hemoglobin, platelet, extramedullary diseases such as CNS involvement, hemorrhage, mediastinal mass, rheumatoid symptoms, hepatosplenomegaly, and lymphadenopathy were assessed in ALL children.
The assessment of PH assumption was performed using score process plot and Kolmogorov-type supremum test in cox PH model (significant level = 0.05). ALL patients in precursor B-cell subtype were considered. Computations were performed using SAS (version 9.4; SAS Institute Inc., Cary, NC, USA). The significant levels for univariate and multiple analyses were considered as 0.20 (17-19) and 0.05, respectively.
4. Results
4.1. Patient Characteristics
A total of 393 children diagnosed with precursor B-cell ALL were included in this study. The demographic and prognostic factors of patients are shown in Table 1. The median age of patients was four years. Among the study population, 8.7%, 76.8%, and 14.5% were under one year old, 1 - 10 years, and older than 10 years, respectively. Also, 227 (57.8%) and 166 (42.2%) patients were males and females, respectively. Also, 11 (2.8%) patients had CNS involvement and 382 (97.2%) were without CNS involvement. WBC levels were below 50000 in 341 (86.8%) and above 50000 in 51 (13%) patients.
| Characteristics | Values a |
|---|---|
| Age (y) | |
| Below 1 | 34 (8.7) |
| Between 1 - 10 | 302 (76.8) |
| Above 10 | 57 (14.5) |
| Missing | 0 (0) |
| Gender | |
| Male | 227 (57.8) |
| Female | 166 (42.2) |
| Missing | 0 (0) |
| WBC count | |
| Below 50000 | 341 (86.8) |
| Above 50000 | 51 (13) |
| Missing | 1 (0.3) |
| Hemoglobin | 7.96 ± 2.53 |
| Missing | 0 (0) |
| Platelet count | |
| Below 150000 | 315 (80.2) |
| Between 150000 - 400000 | 63 (16) |
| Above 400000 | 15 (3.8) |
| Missing | 0 (0) |
| CNS involvement | |
| Positive | 11 (2.8) |
| Negative | 382 (97.2) |
| Missing | 0 (0) |
| Hemorrhagic | |
| Yes | 57 (14.5) |
| No | 336 (85.5) |
| Missing | 0 (0) |
| Mediastinal mass | |
| Yes | 1 (0.3) |
| No | 392 (99.7) |
| Missing | 0 (0) |
| Rheumatoid signs | |
| Yes | 126 (32.1) |
| No | 267 (76.9) |
| Missing | 0 (0) |
| Tumor lysis syndrome | |
| Yes | 17 (4.3) |
| No | 376 (95.7) |
| Missing | 0 (0) |
| Hepatosplenomegaly | |
| Yes | 167 (42.5) |
| No | 226 (57.5) |
| Missing | 0 (0) |
| Lymphadenopathy | |
| Yes | 76 (19.3) |
| No | 317 (80.7) |
| Missing | 0 (0) |
Descriptive Analysis of Prognostic Factors in Precursor B-cell ALL Patients (N = 393)
4.2. Overall and Event Free Survivals
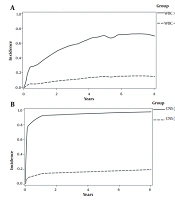
The mean of follow-up time was 71 months. The five-year estimates for OS (CI) and EFS (CI) were 75% (95% CI: 69 - 79%) and 71% (95% CI: 66 - 75%), respectively (Figure 1A and B). Eighty- nine patients had died. Non-relapse mortality and first-relapse outcomes were reported in 67 and 40 patients, respectively.
 curves and cumulative incidence curves for end points of the study")
Standard Kaplan-Meier (KM) curves and cumulative incidence curves for end points of the study
4.3. Incidence of NRM and First-Relapse
The five-year incidence rate of the first-relapse and the NRM in children were 11.4% (95% CI: 8.32 - 15.16%) and 17.6% (95% CI: 13.98 - 21.67%), respectively (Figure 1C).
4.4. Univariate Analysis of Cox Proportional Hazards Model in B-Cell Patients
Children older than ten years had a significantly higher mortality rate (2.80 times) compared to children aged 1 - 10 years (HR = 2.86; 80% CI: 2.05 - 3.83; P-value ≤ 0.0001). Children with hemoglobin ≥ 8 had 40% lower mortality than those with hemoglobin < 8, which was statistically significant (HR = 0.60; 80% CI: 0.45 - 0.79; P-value = 0.01). The mortality rate in children with CNS involvement was significantly higher (2.60 times) than those without CNS involvement (HR = 2.60; 80% CI: 1.44 - 4.69; P-value = 0.03). Children with tumor lysis syndrome had considerably lower OS than those without tumor lysis syndrome (HR = 5.70; 80% CI: 3.75 - 8.65; P-value ≤ 0.0001). The age of the children was significantly associated with EFS (P-value = 0.004). The first-relapse or mortality in children aged ten years was significantly higher (2.14 times) than those aged 1 - 10 years old (HR = 2.14; 80% CI: 1.58 - 2.90; P-value = 0.001). Patients with a WBC count of ≥ 50000 had 48% higher first-relapse or mortality compared to patients with a WBC count of < 50000 (HR = 1.48; 80% CI: 1.06 - 2.06; P-value = 0.12). Hemoglobin ≥ 8 significantly improved EFS (HR = 0.68; 80% CI: 0.53 - 0.87; P-value = 0.04). CNS involvement significantly reduced EFS in children (HR = 2.19; 80% CI: 1.21 - 3.94; P-value = 0.08). Children with hemorrhage had a 38% higher first-relapse or mortality than those without hemorrhage, which was significant (HR = 1.38; 80% CI: 1.008 - 1.90; P-value = 0.18). Tumor lysis syndrome significantly increased first-relapse or mortality rate in children (HR = 4.25; 80% CI: 2.82 - 6.40; P-value ≤ 0.0001) (Table 2).
| Variables | Overall Survival | Event Free Survival | ||||||
|---|---|---|---|---|---|---|---|---|
| HR (80%CI) a | P-Value a | AHR b (95%CI) c | P-Value c | HR (80%CI) a | P-Value a | AHR b (95%CI) c | P-Value c | |
| Age (y) | 0.0001 d | 0.01 e | 0.004 d | NS | ||||
| 1 - 10 | - | - | - | - | - | - | ||
| ≤ 1 | 1.43 (0.90 - 2.67) | 0.31 | 0.86 (0.39 - 1.89) | 0.71 | 1.36 (0.90 - 2.06) | 0.33 | ||
| > 10 | 2.80 (2.05 - 3.83) | < 0.0001 | 2.08 (1.22 - 3.54) | 0.007 | 2.14 (1.58 - 2.90) | 0.001 | ||
| Gender | 0.24 | 0.32 | ||||||
| Male | - | - | - | - | ||||
| Female | 0.77 (0.58 - 1.02) | 0.24 | 0.82 (0.63 - 1.05) | 0.32 | ||||
| WBC count | 0.29 | 0.12 d | NS | |||||
| < 50000 | - | - | - | - | ||||
| ≥ 50000 | 1.36 (0.93 - 1.97) | 0.29 | 1.48 (1.06 - 2.06) | 0.12 d | ||||
| Hemoglobin | 0.01 d | 0.005 e | 0.04 d | NS | ||||
| < 8 | - | - | - | - | - | - | ||
| ≥ 8 | 0.60 (0.45 - 0.79) | 0.01 | 0.53 (0.34 - 0.83) | 0.005 e | 0.68 (0.53 - 0.87) | 0.04 d | ||
| Platelet count | 0.57 | 0.93 | ||||||
| 150000 - 400000 | - | - | - | - | ||||
| < 150000 | 1.18 (0.80 - 1.74) | 0.56 | 1.08 (0.76 - 1.51) | 0.77 | ||||
| ≥ 400000 | 0.61 (0.23 - 1.64) | 0.52 | 0.94 (0.46 - 1.93) | 0.92 | ||||
| CNS involvement | 0.03 d | 0.04 e | 0.08 d | NS | ||||
| No | - | - | - | - | - | - | ||
| Yes | 2.60 (1.44 - 4.69) | 0.03 | 2.83 (1.02 - 7.84) | 0.04 | 2.19 (1.21 - 3.94) | 0.08 | ||
| Hemorrhagic | 0.21 | 0.18 d | NS | |||||
| No | - | - | - | - | ||||
| Yes | 1.39 (0.98 - 1.97) | 0.21 | 1.38 (1.008 - 1.90) | 0.18 | ||||
| Mediastinal mass | 0.98 | 0.97 | ||||||
| No | - | - | - | - | ||||
| Yes | 0 (0 - INF) | 0.98 | 0 (0 - INF) | 0.97 | ||||
| Rheumatoid signs | 0.23 | 0.52 | ||||||
| No | - | - | - | - | ||||
| Yes | 0.75 (0.55 - 1.02) | 0.23 | 0.87 (0.66 - 1.14) | 0.52 | ||||
| Tumor lysis syndrome | < 0.0001 d | 0.001 e | < 0.0001 d | 0.01 e | ||||
| No | - | - | - | - | - | - | - | - |
| Yes | 5.70 (3.75 - 8.65) | < 0.0001 | 3.73 (1.70 - 8.19) | 0.001 | 4.25 (2.82 - 6.40) | < 0.0001 | 2.73 (1.26 - 5.89) | 0.01 |
| Hepatosplenomegaly | 0.72 | 0.94 | ||||||
| No | - | - | - | - | ||||
| Yes | 0.92 (0.70 - 1.22) | 0.72 | 0.98 (0.76 - 1.26) | 0.94 | ||||
| Lymphadenopathy | 0.45 | 0.77 | ||||||
| No | - | - | - | - | ||||
| Yes | 1.21 (0.87 - 1.67) | 0.45 | 1.07 (0.78 - 1.45) | 0.77 | ||||
Univariate and Multiple Cox Proportional Hazards Models for OS and EFS in Precursor B-Cell ALL Patients
4.5. Multiple Analysis of Cox Proportional Hazards Model in B-Cell Patients
Patient's age, CNS involvement, tumor lysis syndrome for OS, and tumor lysis syndrome for EFS were included in the final cox proportional hazard model (Table 2). The proportional hazards assumption based on score process plot and Kolmogorov-type supremum test for prognostic factors were established, and these models were validated. After controlling for the effect of other variables, children aged over ten years had significantly lower OS than children aged 1 - 10 years old (AHR = 2.08; 95% CI = 1.22 - 3.54; P-value = 0.007) (Figure 2A). Hemoglobin ≥ 8 reduced mortality rate by 47% and increased OS (AHR = 0.53; 95% CI = 0.34 - 0.83; P-value = 0.005) (Figure 2B). Children with CNS involvement and tumor lysis syndrome had lower survival; these patients had 2.83 and 3.73 times higher mortality, respectively (AHRs = 2.83 and 3.73; 95% CIs = 1.02 - 7.84 and 1.70 - 8.19; P-values = 0.04 and 0.001) (Figure 2C and D). According to the multiple model for EFS, children with tumor lysis syndrome had 2.73 times higher mortality than those without tumor lysis syndrome (AHR=2.73; 95% CI = 1.26 - 5.89; P-value = 0.01) (Figure 2E).

Adjusted OS and FS curves based on multiple models
4.6. Univariate Analysis of FS Model in B-Cell Patients
In the presence of non-relapse mortality event, the hazard of incidence of first-relapse in children with a WBC count of ≥ 50000 was significantly higher (2.18 times) than that of children with a WBC count of < 50000 (SHR = 2.18; 80% CI: 1.34 - 3.54; P-value = 0.03). The hazard of the first-relapse in children with hemoglobin ≥ 8 was significantly lower (42%) compared to children with hemoglobin < 8 (SHR = 0.58; 80% CI: 0.39 - 0.89; P-value = 0.10). Tumor lysis syndrome significantly increased the hazard of first-relapse in children by 4.19 times (SHR = 4.19; 80% CI: 2.29 - 7.68; P-value = 0.002). In the presence of first-relapse event, the hazard of incidence of non-relapse mortality was 34% lower in females than males, which was statistically significant (SHR = 0.66; 80% CI: 0.47 - 0.92; P-value = 0.11). CNS involvement and tumor lysis syndrome significantly increased the hazard of non-relapse mortality by 3.28 and 5.33 times, respectively (SHRs = 3.28, 5.33, and 3.73; 80% CIs = 1.82 - 5.92 and 2.98 - 9.51; P-values = 0.01 and 0.000) (Table 3).
| Variables | Univariate Analysis | Multiple Analysis | ||
|---|---|---|---|---|
| SHR a (80% CI) | P-Value | ASHR b (95% CI) | P-Value | |
| Relapse | ||||
| Age (y) | 0.27 | |||
| 1 - 10 | - | - | ||
| ≤ 1 | 1.45 (0.84 - 2.95) | 0.34 | ||
| > 10 | 1.59 (0.96 - 2.60) | 0.23 | ||
| Gender | 0.38 | |||
| Male | - | - | ||
| Female | 1.32 (0.87 - 2.01) | 0.38 | ||
| WBC count | 0.03 c | 0.001 d | ||
| < 50000 | - | - | - | - |
| ≥ 50000 | 2.18 (1.34 - 3.54) | 0.03 | 2.94 (1.50 - 5.76) | 0.001 |
| Hemoglobin | 0.10 c | 0.01 d | ||
| < 8 | - | - | - | - |
| ≥ 8 | 0.58 (0.39 - 0.89) | 0.10 | 0.55 (0.36 - 0.85) | 0.01 |
| Platelet count | 0.47 | |||
| 150000 - 400000 | - | - | ||
| < 150000 | 0.64 (0.39 - 1.05) | 0.25 | ||
| ≥ 400000 | 1.51 (0.64 - 3.56) | 0.53 | ||
| CNS involvement | 0.51 | |||
| No | - | - | ||
| Yes | 0.40 (0.06 - 2.39) | 0.51 | ||
| Hemorrhagic | 0.34 | |||
| No | - | - | ||
| Yes | 1.45 (0.87 - 2.40) | 0.34 | ||
| Mediastinal mass | 0.91 | |||
| No | - | - | ||
| Yes | 0.72 (0.01-36.22) | 0.91 | ||
| Rheumatoid signs | 0.99 | |||
| No | - | - | ||
| Yes | 0.99 (0.64 - 1.53) | 0.99 | ||
| Tumor lysis syndrome | 0.002 c | 0.01 d | ||
| No | - | - | - | - |
| Yes | 4.19 (2.29 - 7.68) | 0.002 | 3.45 (1.31 - 9.02) | 0.01 |
| Hepatosplenomegaly | 0.51 | |||
| No | - | - | ||
| Yes | 0.81 (0.53 - 1.22) | 0.51 | ||
| Lymphadenopathy | 0.51 | |||
| No | - | - | ||
| Yes | 0.64 (0.26 - 1.54) | 0.51 | ||
| NRM | ||||
| Age (y) | 0.23 | |||
| 1 - 10 | - | - | ||
| ≤ 1 | 1.29 (0.73 - 2.95) | 0.55 | ||
| > 10 | 2.38 (0.66 - 3.40) | 0.47 | ||
| Gender | 0.11 c | 0.25 | ||
| Male | - | - | - | - |
| Female | 0.66 (0.47 - 0.92) | 0.11 | 0.74 (0.45 - 1.23) | 0.25 |
| WBC count | 0.49 | |||
| < 50000 | - | - | ||
| ≥ 50000 | 1.28 (0.80 - 2.03) | 0.49 | ||
| Hemoglobin | 0.62 | |||
| < 8 | - | - | ||
| ≥ 8 | 0.88 (0.64 - 1.21) | 0.62 | ||
| Platelet count | 0.29 | |||
| 150000 - 400000 | - | - | ||
| < 150000 | 1.45 (0.89 - 2.36) | 0.32 | ||
| ≥ 400000 | 0.54 (0.13 - 2.13) | 0.57 | ||
| CNS involvement | 0.01 c | 0.02 d | ||
| No | - | - | - | - |
| Yes | 3.28 (1.82 - 5.92) | 0.01 | 3.01 (1.18 - 7.63) | 0.02 |
| Hemorrhagic | 0.35 | |||
| No | - | - | ||
| Yes | 1.34 (0.89 - 2.02) | 0.35 | ||
| Mediastinal mass | 0.87 | |||
| No | - | - | ||
| Yes | 0.63 (0.01 - 25.34) | 0.87 | ||
| Rheumatoid signs | 0.47 | |||
| No | - | - | ||
| Yes | 0.82 (0.58 - 1.16) | 0.47 | ||
| Tumor Lysis Syndrome | 0.000 c | < 0.001 d | ||
| No | - | - | - | - |
| Yes | 5.33 (2.98 - 9.51) | 0.000 | 5.35 (2.19 - 13.05) | < 0.001 |
| Hepatosplenomegaly | 0.88 | |||
| No | - | - | ||
| Yes | 1.03 (0.75 - 1.42) | 0.88 | ||
| Lymphadenopathy | 0.59 | |||
| No | - | - | ||
| Yes | 1.17 (0.80 - 1.70) | 0.59 | ||
Univariate and Multiple FS Model for First-Relapse and NRM Simultaneously in Precursor B-Cell ALL Patients
4.7. Multiple Analysis of FS Model in B-Cell Patients
The effects of WBC, hemoglobin, and tumor lysis syndrome on the incidence of first-relapse were significant (Table 3). The results of the multiple model showed that the hazard of first-relapse in children with a WBC count of ≥ 50000 was 2.94 times higher than those with a WBC count of < 50000, while the effects of other variables were constant in the presence of non-relapse mortality event (ASHR = 2.94; 95% CI: 1.50 - 5.76; P-value = 0.001). Hemoglobin ≥ 8 reduced first-relapse incidence by 45% (ASHR = 0.55; 95% CI: 0.36 - 0.85; P-value = 0.01). The incidence of first-relapse in children with tumor lysis syndrome was 3.45 times higher than in patients without tumor lysis syndrome (ASHR = 3.45; 95% CI: 1.31 - 9.02; P-value = 0.01). The effects of CNS involvement and tumor lysis syndrome on the incidence of first-relapse were significant (Table 3). In the presence of non-relapse mortality event, while the effect of the other variable was held constant, the results showed that children with CNS involvement were three times more likely to have NRM than those without CNS involvement (ASHR = 3.01; 95% CI: 1.18 - 7.63; P-value = 0.02). Tumor lysis syndrome increased the hazard of NRM by 5.35 times (ASHR = 5.35; 95% CI: 2.19 - 13.05; P-value ≤ 0.001). In addition, in the presence of first-relapse in the multiple model, the relationship between gender and NRM outcome was not significant (P-value = 0.25) (Table 3). As can be seen in Figure 3A, children with WBC count of ≥ 50000, hemoglobin < 8, and tumor lysis syndrome had a five-year CIF higher than children without these features (71% vs. 15%) for the first-relapse outcome. These patients were considered as the high-risk group for the first-relapse outcome. Moreover, according to Figure 3B, children with CNS involvement and tumor lysis syndrome had much higher five-year CIF (95% vs. 17%) for the NRM outcome. These patients were considered as the high-risk group for NRM outcome.

Incidence of risk classification in precursor B-cell ALL patients based on competing outcomes; A, first-relapse outcome; B, NRM outcome.
5. Discussion
ALL is the most common pediatric malignancy accounting for 75 - 80% of acute leukemias in childhood. Although ALL is prevalent in different age groups of children with the incidence rate of 3-4 per 100,000 people, it is more common in children aged 2 - 5 years and slightly more frequent in males (20, 21). ALL is a heterogeneous disease associated with distinct subgroups. These subgroups are followed by various outcomes and have demonstrated substantial differences according to biological, cellular, and molecular characteristics, treatment response, and relapse risk. ALL is classified into different risk subgroups based on genetic, biological, and clinical features such as sex and age at diagnosis, immunophenotypic, cytogenetic, molecular, and early medullar response to induction therapy (22, 23).
ALL is likely to be associated with alterations in hematological disorders such as increased WBC count and decreased hemoglobin concentration, as well as serious clinical complications such as CNS involvement, tumor lysis syndrome, and hemorrhagic bleeding. The occurrence of any of these complications that might worsen the prognosis of patients and increase mortality rate in children clarifies the necessity of further treatments for managing the disease. In this regard, we investigated the patients using univariate and multiple statistical methods and examined the NRM and first-relapse outcomes to predict the risk of outcomes of patients and identify high-risk groups (20, 24).
Throughout the NRM analysis, it was found that patients with involvement of CNS and TLS could be classified as the high-risk group, as the estimated five-year NRM incidence in these patients was 95%. This finding indicates that in patients with simultaneous manifestations of CNS and TLS, the probability of death from any cause except relapse after five years would be about 95%. In patients with no involvement of CNS and TLS, however, the five-year NRM incidence probability was 17%. These patients, with a five-year death rate of 17% without evidence of relapse, could be classified as the low-risk group.
Moreover, the results of univariate analyses revealed a significant association between TLS/CNS involvement and OS and EFS rate, as these survival rates decreased in patients with CNS involvement and patients with TLS. The results of multiple analyses also showed a significant relationship between TLS/CNS involvement and OS rate, as well as a significant association between TLS and EFS.
The existence of risk factors at the time of ALL diagnosis, including T cell immunophenotype, hyperleukocytosis, high-risk cytogenetic abnormalities such as t (1; 19) and t (9; 22) translocations, and rearrangement of the mixed lineage leukemia (MLL, or KMT2A) gene, could be the predisposing factors for CNS involvement, which is accompanied by poor prognosis in patients. This clinical complication, thus, might raise heightened concerns over ALL prognosis, despite its good treatment response in 80 - 90% of cases (25-28).
TLS is another major clinical complication in patients with ALL, as this life-threatening oncological emergency is associated with a high mortality rate, kidney failure, seizure, and heart arrhythmia. These problems could explain the necessity of early diagnosis and management (24). Additionally, among numerous short- and long-term mortality predictors, acute kidney injury (AKI) is one of the most important clinical complications in patients with TLS. Due to the increased concentrations of uric acid, phosphate, potassium, and urea, homeostatic mechanisms might fail to remove these substances that cause clinical signs of TLS (29). Furthermore, the higher TLS incidence in highly proliferative and high tumor burden malignancies such as lymphoma and leukemia are probably contributed to the increased risk of worse outcomes. TLS prevention, therefore, contributes to the identification of high-risk patients who could probably benefit from close monitoring and initial prophylactic measures (30).
In this study, multiple analysis for the first-relapse showed that patients with a WBC count of ≥ 50000, hemoglobin concentration < 8, and TLS had a first-relapse probability of 71% after five years. This recurrence probability emphasized the importance of early diagnosis and treatment in patients included in the high-risk group due to presenting these symptoms at the same time. However, patients who did not show these parameters simultaneously were classified as the low-risk group with a first-relapse rate of 15% after five years.
Patients’ age and CNS/TLS involvement were significantly associated with OS. In this regard, in patients younger than one years and older than ten years, CNS involvement and TLS incidence were associated with lower OS, because, as described before, CNS involvement due to risk factors like molecular disorders and TLS incidence with serious clinical implications would include patients in high-risk group and correlates with poor prognosis. Moreover, we observed a significant relationship between patients’ age with OS and EFS, as children under one year and over ten years old showed lower OS and EFS. Similar studies have demonstrated a higher possibility of genetic abnormalities with poor prognosis in this age group, like BCR-ABL1 t(q34, q11.2), MLL gene rearrangement, and hypodiploidy (31, 32).
Chen et al. observed a poor outcome accompanied by molecular rearrangements on chromosome 11q23 in children younger than one year old (33). Another potential reason for the poor prognosis in these children might be related to their immature immune system. This happens due to inefficient immune system response to the tumor antigens, resulting in a dramatically low immune surveillance in this age group (34).
An increased risk of B-ALL relapse, on the other hand, has been contributed to the age over ten years old at diagnosis. Accordingly, the COG has recently determined the age over 13 years old at diagnosis as a very high-risk feature (35). In the COG's CCG study, multimodal regimens in older patients caused three-year post-relapse survival of 35.4%, 14.7%, and 48.6% in children aged 10 - 15 years, > 16 years, and < 10 years old, respectively (36). Worse outcomes in older pediatrics and young adults suffering from B-ALL have also been reported in various studies (37). Poor chemotherapy compliance, many patients with unfavorable risk factors like Philadelphia (Ph+) chromosome (5 - 7%), and new rearrangements and mutations in IKAROUS, JAK, and CRLFZ genes are examples of explanations for worse outcomes in older patients (38, 39). In addition, hyperdiploidy and favorable cytogenetic features like t (12; 21) (p13, q22) result in TEL-AML1 fusion, which occur less frequently in this age group compared to younger children (40, 41).
Several studies showed that iron deficiency and hypoxia in patients with anemia could reduce the treatment response and develop resistance to treatment, which is an unfavorable complication affecting poor prognosis in anemic patients (42).
It is essential to highlight that iron could cause cells protection against oxidative tissue damage by nitrogen oxidase. Hemoglobin deficiency in anemic patients could therefore lead to tissue damage and related complications. On the other hand, low hemoglobin levels at diagnosis is associated with more advanced disease (43). In this regard, in our study, univariate analysis indicated that the OS rate would decrease in patients with lower hemoglobin level (< 8). The univariate analysis also showed decreased EFS and first-relapse rate in patients with WBC count of ≥ 50000. Also, this study confirmed that a high WBC count (≥ 50,000) is associated with decreased EFS rate, as well as increased relapse and death risk.
Previous studies reported that patients with severe leukocytosis at diagnosis are associated with complications such as bulky tumor mass, mediastinal enlargement, hepatosplenomegaly, and lymphadenopathy, which are usually related to unfavorable chromosomal translocations t (4; 11) and t (9; 22) (44). Leukocytosis is associated with decreased blood flow, blood stasis in capillaries, leukemic cells aggregation, micro thrombosis, the release of toxic granules from cells into the peripheral blood, vascular endothelial damage, oxygen consumption by leukocytes, and tissue invasion. In this regard, the increase in WBC count could be attributed to the lower EFS and first-relapse rate, which was also confirmed in our study (45).
In the current study, a significant relationship between gender and NRM was detected, such that males with ALL had a higher risk of NRM compared to females. One responsible factor is XY chromosomal instability mediating abnormal cell proliferation and more biologically aggressive leukemia in males. Testosterone hormone may also give rise to the worse prognosis in males.
5.1. Conclusions
In this study, we determined the risk in children with ALL to select appropriate treatment strategies for each risk group during induction therapy, consolidation therapy, and maintenance therapy, and evaluated treatment response and the minimal residual disease. Accordingly, hyper-CVAD chemotherapy [hyperfractionated cyclophosphamide, vincristine, doxorubicin (Adriamycin), dexamethasone] is suggested for low-risk patients. However, the treatment of high-risk patients is based on chemotherapy plus clinical trials related to this group, such as PI3K pathway and JAK2 pathway inhibitors and antibody-based immunotherapy. This could potentially help low-risk patients benefit from treatments with low chemotherapy drug toxicity, and high-risk patients or patients resistant to standard treatment benefit from the best treatment choice and reduced minimal residual disease and mortality rate in this group (46-48).
