


1. Background
Obesity is a global health problem characterized by the accumulation of fat in the body because energy expenditure is less than energy intake (1). Due to unhealthy diets and lack of physical activity, the prevalence of obesity has increased in recent years in both children and adolescent age groups, like adults (2). Studies have shown that adropin plays an important role in regulating energy homeostasis, endothelial function, and insulin response (3). Adropin has been reported to decrease with increasing body mass index (BMI), whereas an increase in adropin levels is associated with increasing insulin resistance, endothelial dysfunction, and worsening lipid metabolism (4). A portion of the first 33 amino acids of adropin, a peptide structure consisting of a total of 76 amino acids, has been shown to function as a signal peptide and is expressed in the body, primarily in the liver and brain (3). Studies examining the relationship between adropin and obesity have shown that low adropin levels are associated with obesity in studies of adults (4, 5). Conflicting studies have been conducted in adolescents and children. While some studies linked obesity and BMI to adropin levels (6-9), other researchers found that there was no association (10, 11). These findings indicate that there is no consensus in the literature regarding the association between adropin and obesity in the pediatric age group.
Cardiovascular diseases are the most important complication of obesity in terms of morbidity and mortality (12). The complications of obesity for the cardiovascular system include hypertension, coronary artery disease, deep vein thrombosis, and cerebrovascular disease (13). However, one of the most important of these complications is hypertension (14). Hypertension is associated with the severity and duration of obesity (13). Studies examining the relationship between blood pressure and adropin can be found in the literature. Some studies have shown that adropin levels decrease in hypertensives (14) and that adropin is inversely related to diastolic blood pressure (DBP) but not to systolic blood pressure (SBP) (4, 15). Some studies have mentioned that adropin is related to both SBP and DBP (16). However, another study reported that adropin levels decreased in obese hypertensive children aged 7.5 to 16.4 years but showed no correlation with blood pressure (17).
Additionally, studies have reported that serum insulin, triglyceride, total cholesterol levels (15, 17), glucose, and AST levels increase, and HDL-cholesterol levels decrease in obesity (15). In the literature, it has not been clearly established whether these parameters and other kidney function tests such as urea and creatinine, liver function tests such as aspartate aminotransferase (AST), alanine aminotransferase (ALT) and gamma-glutamyl transferase (GGT), thyroid function tests such as thyroid-stimulating hormone (TSH), free T4 (fT4), C- reactive protein (CRP), and vitamin D levels correlate with serum adropin levels in obese individuals.
2. Objectives
The relationship between adropin, blood pressure, and obesity has apparently not yet been clarified. Therefore, in our study, we aimed to demonstrate for the first time in the literature the relationship between adropin levels and SBP and DBP in obese adolescents aged 10 - 18 years.
3. Methods
3.1. Patients and Design
This study was prospectively conducted on voluntary adolescents aged 10 - 18 years, 61 of whom were obese and 27 had a normal BMI percentile, who presented to the Istanbul Prof. Dr. Cemil Taşcıoğlu City Hospital Pediatrics Health and Diseases Outpatient Clinics between March 2021 and July 2021. The obese adolescent group consisted of 61 subjects with a BMI percentile of 95 or more who did not have a genetic syndrome; diabetes mellitus was excluded; they had no history of endocrinological, liver, renal, or inflammatory diseases; they had no history of chronic diseases; they were not taking steroids or similar medications that might be involved in the etiology of obesity; and they had no history of adenoidectomy or tonsillectomy. The control group consisted of 27 healthy subjects aged 10 to 18 years with a BMI between the 5th and 85th percentile. After physical examination of the children, the age and gender of all subjects were noted; blood pressure, waist circumference, height, and weight were also measured, and BMI was calculated. Body Mass Index was calculated by dividing body weight in kilograms by the square of height in meters. Reference curves for BMI, which were established for Turkish children by Neyzi et al. (18), were used. Body Mass Index-Standard Deviation Score (BMI-SDS) was calculated according to the standards established for Turkish children. Adolescents with a BMI of 95% or more were defined as obese according to age, gender, and race (19). SBP and DBP were measured by auscultation with an aneroid manometer and an appropriate cuff after subjects rested in the outpatient clinic for at least 10 minutes (20).
3.2. Measurement of Biochemical Tests
A sample was taken from the forearm pit of the subjects between 08:00 and 10:00 after fasting for at least 12 hours for the determination of glucose, insulin, urea, creatinine, AST, ALT, GGT, CRP, total cholesterol, LDL-cholesterol, HDL- cholesterol, triglyceride, TSH, fT4, and 25-hydroxyvitamin D3. The blood samples used for adropin measurement were placed in a biochemical tube and centrifuged at 4000 rpm for 10 minutes. The sera were stored at -80°C until the study day. Enzyme-linked immunosorbent assay (ELISA) kits (Human Adropin, catalog number: E3231Hu; BT-Lab®, China) were used to measure adropin levels. The analytical (linear) detection range was 5 ng/L - 1000 ng/L for adropin. The minimum detection limit was 2.49 ng/L. The reported intra-assay and inter-assay coefficients of variability (CVs) were 8% and 10%, respectively. HOMA-IR (Homeostasis model evaluation insulin resistance index) was used as an insulin sensitivity index. The following formula was used to determine HOMA-IR: fasting insulin (uIU/mL) × fasting glucose (mg/dL) /405 (21).
3.3. Statistical Analysis
Results obtained in the study were analyzed using IBM SPSS Statistics 22 software. Kolmogorov-Smirnov and Shapiro-Wilks tests were used to evaluate the normal distribution of the parameters. The study data was analyzed using descriptive statistical methods, including mean, standard deviation, and frequency. In addition, a one-way ANOVA test was employed to compare the normally distributed parameters between groups for quantitative data comparison. When the group variances were homogeneous, the Tukey HDS test was used to identify the group causing the difference. When the group variances were not homogeneous, Tamhane's T2 test was used to identify the group attributing to the difference. We conducted the Kruskal-Wallis test to compare parameters without normal distribution between groups. To identify the group(s) that caused the variation, we used the Dunn's test. To compare parameters with normal distribution across two groups, we used the Student's t-test. For parameters without normal distribution across two groups, we used the Mann-Whitney U test. We used the chi-square test and Yates continuity correction to compare qualitative data. Pearson's correlation analysis was conducted to study relationships between parameters that conformed to a normal distribution. The relationships between parameters that did not conform to the normal distribution were analyzed using Spearman's rho correlation analysis. The level of significance was evaluated as P < 0.05.
3.4. Ethical Approval
The study was conducted according to the principles outlined in the Declaration of Helsinki. The Clinical Research Ethics Committee of the University of Health Sciences, Prof. Dr. Cemil Taşcıoğlu City Hospital, granted ethical approval on 22.03.2021 with reference number E-48670771-514.10.
4. Results
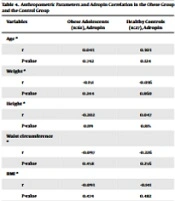
The study was conducted with a total of 88 adolescents aged 10 to 18 years, including 45 (51.1%) females and 43 (48.9%) males. The mean age of the participants was 13.79 ± 1.98 years. There was no statistically significant difference between the groups in terms of age, mean values of height, and gender (P > 0.05). Weight, waist circumference, SBP, and DBP mean values, BMI mean values, BMI percentiles, and BMI z-scores of adolescents in the obese group were statistically higher than those in the control group (P < 0.05). There was no statistically significant difference between the groups in terms of gender distribution (P > 0.05) (Table 1).
| Obese Adolescents (n:61), Mean ± SD | Healthy Controls (n:27), Mean ± SD | P-Value | |
|---|---|---|---|
| Age, y | 13.63 ± 2.01 | 14.15 ± 1.91 | 0.262 a |
| Weight, kg | 82.71 ± 20.39 | 52.53 ± 10.16 | 0.001 a, b |
| Height, cm | 161.58 ± 9.89 | 161.19 ± 10.89 | 0.869 a |
| Waist circumference, cm | 97.69 ± 13.61 | 73.57 ± 6.29 | 0.001 a, b |
| BMI, kg/m2 | 31.33 ± 5.44 | 20.01 ± 1.92 | 0.001 a, b |
| BMI z-score (median) | 2.54 ± 0.65 (2.43) | -0.23 ± 0.78 (-0.19) | 0.001 b, c |
| BMI percentile (median) | 98.64 ± 1.42 (99.2) | 43.45 ± 25.77 (42.4) | 0.001 b, c |
| SBP (median) | 120.28 ± 14.06 (120) | 108.44 ± 9.25 (110) | 0.001 b, c |
| DBP (median) | 74.74 ± 10.97 (70) | 66.26 ± 8.28 (70) | 0.001 b, c |
| Gender, No. (%) | |||
| Female | 28(45.9) | 15 (55.6) | 0.546 d |
| Male | 33 (54.1) | 12 (44.4) |
Abbreviations: BMI, body-mass index; DBP, diastolic blood pressure; SBP, systolic blood pressure.
a Student t-test
b P < 0.05
c MannWhitney U test
d Continuity (Yates) correction
Adropin levels were not statistically different between males and females in both the obese and control groups (P < 0.05) (Table 2).
| Adropin Levels of Obese Adolescents (n:61), Mean ± SD | Adropin Levels of Healthy Controls (n:27), Mean ± SD | |
|---|---|---|
| Gender | ||
| Female | 46.29 ± 31.97 (32.1) | 59.15 ± 58.21 (31.8) |
| Male | 41.19 ± 32.44 (31) | 39.29 ± 36.41 (26.8) |
| P-Value | 0.325 | 0.464 |
a Mann-Whıtney U test
The insulin, HOMA-IR, AST, ALT, GGT, CRP, triglyceride, and LDL- cholesterol levels of the adolescents in the obese group were statistically significantly higher than those in the control group (P < 0.05). HDL-cholesterol and 25-hydroxyvitamin D3 levels of adolescents in the obese group were statistically significantly lower than those in the control group (P < 0.05). There was no statistically significant difference in glucose, urea, creatinine, total cholesterol, TSH, fT4, and adropin levels between the groups (P > 0.05) (Table 3).
| Obese Adolescents (n:61), Mean ± SD | Healthy Controls (n:27), Mean ± SD | P-Value | |
|---|---|---|---|
| Glucose, mg/dL | 89.9 ± 7.49 | 90.74 ± 5.71 | 0.605 a |
| Insulin, IU/L (median) | 26.71 ± 17.03 | 12.88 ± 6.14 | 0.001 b, c |
| HOMA-IR (median) | 6.01 ± 4.03 | 2.89 ± 1.41 | 0.001 b, c |
| Urea, mg/dL | 21.98 ± 5.77 | 21.04 ± 5.02 | 0.463 a |
| Creatinine, mg/dL | 0.61 ± 0.15 | 0.62 ± 0.14 | 0.885 a |
| AST, U/L (median) | 24.2 ± 13.82 (20 ) | 18.19 ± 4.45 (17) | 0.021 b, c |
| ALT, U/L (median) | 29.82 ± 29.37 (19) | 12.7 ± 6.09 (11) | 0.001 b, c |
| GGT, U/L (median) | 19.67 ± 13.55 (16) | 11.19 ± 4.4 (10) | 0.001 b, c |
| CRP, mg/L (median) | 4.93 ± 7.47 (2.88) | 1.65 ± 2.57 (0.53) | 0.001 b, c |
| Total cholesterol, mg/dL | 154.97 ± 26.37 | 143.56 ± 26.49 | 0.065 a |
| Triglyceride, mg/dL (median) | 123.18 ± 61.48 (110) | 78.7 ± 29.55 (76) | 0.001 b, c |
| HDL-cholesterol (mg/dL) | 43.34 ± 9.14 | 53 ± 11.55 | 0.001 a, c |
| LDL-cholesterol, mg/dL | 88.41 ± 24.51 | 74.85 ± 27.02 | 0.023a, c |
| TSH, mU/L (median) | 2.65 ± 1.29 (2.43) | 3.04 ± 2.18 (2.31) | 0.982 b |
| Free T4, ng/L | 11.82 ± 1.76 | 12.06 ± 1.3 | 0.525 a |
| 25-hydroxyvitamin D3, ug/L (median) | 14.72 ± 9.87 (13.3) | 16.46 ± 6.09 (16.9) | 0.045 b, c |
| Adropin, ng/L (median) | 43.53 ± 32.06 (31.33) | 50.33 ± 49.86 (31.36) | 0.721 b |
Abbreviations: ALT, alanine aminotransferase; AST, aspartate aminotransferase; BMI, body-mass index; CRP, C-reactive protein; HOMA-IR, homeostatic model of assessment for insulin resistance; HDL-cholesterol, high-density lipoprotein-cholesterol; LDL-cholesterol, low-density lipoprotein-cholesterol; SD, standard deviation; TSH, thyroid stimulating hormone.
a Student t-test
b MannWhitney U test
c P < 0.05
In the obese group, there was an inverse, weak (27.9%), and statistically significant relationship between adropin level and DBP (P: 0.029; P < 0.05) (Table 4). Additionally, there was no statistically significant correlation between adropin level and biochemical parameters (glucose, insulin, HOMA-IR, urea, creatinine, AST, ALT, GGT, CRP, total cholesterol, triglyceride, HDL- cholesterol, LDL-cholesterol, TSH, free T4, and 25-hydroxyvitamin D3 levels in the obese group (P > 0.05). Gender, SBP, DBP, and adropin levels of each obese adolescent (Table 5) and healthy control (Table 6) were also classified.
| Variables | Obese Adolescents (n:61), Adropin | Healthy Controls (n:27), Adropin |
|---|---|---|
| Age a | ||
| r | 0.043 | 0.303 |
| P-value | 0.742 | 0.124 |
| Weight a | ||
| r | -0.151 | -0.036 |
| P-value | 0.244 | 0.860 |
| Height a | ||
| r | -0.202 | 0.047 |
| P-value | 0.119 | 0.815 |
| Waist circumference a | ||
| r | -0.097 | -0.226 |
| P-value | 0.458 | 0.256 |
| BMI a | ||
| r | -0.093 | -0.141 |
| P-value | 0.474 | 0.482 |
| BMI z-score b | ||
| r | -0.105 | -0.335 |
| P-value | 0.422 | 0.088 |
| BMI percentile b | ||
| r | -0.122 | -0.333 |
| P-value | 0.349 | 0.090 |
| SBP b | ||
| r | -0.044 | -0.229 |
| P-value | 0.735 | 0.251 |
| DBP b | ||
| r | -0.279 | -0.123 |
| P-value | 0.029 c | 0.540 |
Abbreviations: BMI, body-mass index; DBP, diastolic blood pressure; SBP, systolic blood pressure.
a Pearson's correlation,
b Spearman's rho correlation.
c P < 0.05
| Obese Adolescents | Gender | SBP, mmHg | DBP, mmHg | Adropin Levels, ng/L | Obese Adolescents | Gender | SBP , mmHg | DBP, mmHg | Adropin Levels, ng/L |
|---|---|---|---|---|---|---|---|---|---|
| 1 | M | 120 | 80 | 31.42 | 32 | F | 118 | 62 | 90.15 |
| 2 | F | 110 | 70 | 25.02 | 33 | M | 123 | 69 | 115.2 |
| 3 | F | 120 | 70 | 59.37 | 34 | M | 112 | 72 | 23,25 |
| 4 | F | 150 | 90 | 305.2 | 35 | F | 104 | 55 | 29,81 |
| 5 | F | 110 | 70 | 12.78 | 36 | F | 109 | 86 | 19,36 |
| 6 | M | 125 | 70 | 33.88 | 37 | M | 113 | 63 | 17,62 |
| 7 | F | 100 | 70 | 152.3 | 38 | M | 110 | 70 | 26.83 |
| 8 | F | 110 | 70 | 32.37 | 39 | F | 100 | 60 | 59,13 |
| 9 | F | 145 | 80 | 99.97 | 40 | M | 130 | 70 | 159,6 |
| 10 | F | 110 | 50 | 78.3 | 41 | M | 146 | 91 | 32.68 |
| 11 | F | 130 | 85 | 30.83 | 42 | M | 150 | 80 | 33.21 |
| 12 | M | 120 | 85 | 14.25 | 43 | F | 110 | 60 | 40,7 |
| 13 | M | 120 | 80 | 19.8 | 44 | M | 110 | 70 | 41,13 |
| 14 | F | 90 | 50 | 34.7 | 45 | M | 130 | 80 | 9.30 |
| 15 | M | 125 | 85 | 99,3 | 46 | F | 110 | 70 | 25,79 |
| 16 | F | 110 | 60 | 24,19 | 47 | F | 130 | 90 | 21.5 |
| 17 | F | 100 | 60 | 73.68 | 48 | M | 120 | 80 | 63,62 |
| 18 | F | 120 | 80 | 26,41 | 49 | M | 110 | 70 | 41,2 |
| 19 | M | 140 | 90 | 24,11 | 50 | M | 114 | 69 | 21,57 |
| 20 | F | 130 | 80 | 93.62 | 51 | F | 120 | 80 | 24.45 |
| 21 | M | 130 | 90 | 27,72 | 52 | F | 110 | 70 | 32.97 |
| 22 | M | 150 | 90 | 31.01 | 53 | M | 140 | 80 | 8.6 |
| 23 | F | 120 | 70 | 18,26 | 54 | M | 110 | 70 | 146.1 |
| 24 | F | 110 | 60 | 152.9 | 55 | M | 130 | 70 | 23.46 |
| 25 | M | 108 | 82 | 29,67 | 56 | M | 130 | 80 | 370.6 |
| 26 | F | 150 | 100 | 31.33 | 57 | M | 130 | 90 | 16.69 |
| 27 | M | 140 | 90 | 20,51 | 58 | M | 130 | 70 | 142.6 |
| 28 | M | 110 | 80 | 19.13 | 59 | M | 130 | 80 | 91.76 |
| 29 | M | 110 | 90 | 6.91 | 60 | M | 110 | 70 | 100.2 |
| 30 | F | 115 | 65 | 23,43 | 61 | M | 110 | 70 | 31.29 |
| 31 | F | 110 | 70 | 31,91 |
Abbreviations: DBP, diastolic blood pressure; F, female; M, male; SBP, systolic blood pressure.
| Healthy Controls | Gender | SBP, mmHg | DBP, mmHg | Adropin Levels, ng/L | Healthy Controls | Gender | SBP, mmHg | DBP, mmHg | Adropin Levels, ng/L |
|---|---|---|---|---|---|---|---|---|---|
| 1 | F | 100 | 70 | 31.76 | 15 | M | 120 | 70 | 20.37 |
| 2 | M | 107 | 65 | 31.39 | 16 | M | 120 | 80 | 20.68 |
| 3 | M | 110 | 70 | 31.36 | 17 | F | 120 | 80 | 626.1 |
| 4 | F | 110 | 70 | 8.33 | 18 | F | 110 | 70 | 19.98 |
| 5 | F | 110 | 70 | 8.93 | 19 | M | 110 | 60 | 19.08 |
| 6 | M | 110 | 70 | 32.23 | 20 | M | 110 | 60 | 22.29 |
| 7 | F | 100 | 50 | 28.55 | 21 | F | 110 | 70 | 41.51 |
| 8 | F | 90 | 50 | 196.2 | 22 | F | 105 | 60 | 153.7 |
| 9 | F | 110 | 70 | 87.23 | 23 | M | 110 | 70 | 13.83 |
| 10 | F | 95 | 60 | 14.04 | 24 | F | 95 | 50 | 34.95 |
| 11 | F | 101 | 64 | 21.51 | 25 | F | 100 | 60 | 169.4 |
| 12 | F | 110 | 70 | 24.76 | 26 | M | 100 | 60 | 34.17 |
| 13 | M | 125 | 70 | 18.37 | 27 | M | 130 | 80 | 94.23 |
| 14 | M | 110 | 70 | 133.5 |
Abbreviations: DBP, diastolic blood pressure; F, female; M, male, SBP; systolic blood pressure.
5. Discussion
The primary findings of the current study were: (1) serum adropin levels of obese adolescents were not statistically different from healthy controls, but adropin levels were even lower in the obese adolescent group; (2) there was no correlation between BMI, HOMA-IR, and adropin levels; (3) we determined that SBP and DBP levels were high in obese adolescents; (4) there was an inverse, weak, and statistically significant relationship between adropin levels and DBP in obese adolescents. But, no significant relationship was detected between adropin and SBP.
Childhood obesity and its complications are of great importance in terms of morbidity and mortality (12). Understanding the role of adipocytokines, such as adropin, in this process is important for the development of new treatment options. To this end, our study measured serum adropin levels in obese adolescents, but no significant difference was found between adolescents with normal body weight and obese subjects. On the other hand, Kocaoglu et al. (10), in their study of 70 obese adolescents, reached results similar to our study when they compared serum adropin levels with those of adolescents with normal BMI and obese adolescents. In addition, no association was found between adropin, BMI, waist circumference, and weight. Kocaoglu et al. also found a weak correlation between adropin levels and HOMA-IR and found that individuals with HOMA-IR ≥ 3.16 had lower adropin levels (10). This finding suggests that the presence of insulin resistance is an important variable when comparing adropin levels. Gozal et al. (11) measured adropin levels in children with obstructive sleep apnea and showed that there was no correlation between adropin levels and BMI z-score. Some studies found no correlation between adropin levels and BMI z-scores and observed similar adropin levels in obese and healthy individuals (22, 23).
However, an inverse relationship between adropin and obesity and BMI has been reported in both experimental (1, 24) and human studies (4-9). In the study by Erman et al. (4), conducted in adults, serum adropin levels were shown to be decreased in the obese group, and a negative correlation was found between adropin levels and BMI, glucose, and insulin. Butler et al. (5) also found a negative correlation between adropin levels and BMI. Yin et al. (6) reported that obese children and adolescents aged 7 to 14 years had lower adropin levels, and they even pointed out that obese people with metabolic syndrome had lower adropin levels than those without metabolic syndrome. Chen et al. (7) established that adropin levels were decreased in 39 obese children aged 5 to 14 years and negatively correlated with BMI, BMI Z-score, insulin, and HOMA-IR. Yuan et al. (8) showed that adropin level was decreased in obese children aged 5 to 14 years and, similar to other studies, negatively correlated with triglyceride and BMI and positively correlated with HDL- cholesterol. Sayin et al. (9) concluded that adropin levels were decreased in obese children aged 11 to 16 years, similar to other studies, and negatively correlated with weight, ALT, and HOMA-IR. Zhang et al. (15) also indicated that in obese adolescents aged 16 to 19 years, adropin levels were decreased, adropin levels correlated positively with HDL- cholesterol, and adropin levels correlated negatively with weight, BMI, AST, triglyceride, glucose, insulin, and HOMA-IR.
In the study by Herrero et al. (25), lower adropin levels were observed in 71 prepubertal and 41 pubertal children compared to pubertal children. The authors demonstrated a differential relationship between adropin levels, obesity, and age. They also suggested a potential link between adropin levels and centrally regulated sex hormones involved in pubertal development. Previous research (5, 26) has shown negative correlations between adropin levels and age in adults. The reason for this age-related decline, however, remains unclear. An analysis of the study results suggests that the relationship between adropin levels and obesity is inconclusive (5, 26). Differences in adropin levels that may occur with age (5, 25, 26) may also lead to differences between studies. Other reasons include the fact that variables such as insulin resistance (10) and the presence of metabolic syndrome (6) may cause a difference in adropin levels between healthy obese individuals and obese individuals with metabolic disorders. Studies with larger samples are needed to clarify the relationship between adropin and obesity.
High blood pressure is one of the major cardiovascular complications of obesity (13). In our study, we determined that SBP and DBP levels were high in obese adolescents. The relationship between adropin levels and SBP and DBP has been examined in several studies. However, our study is the first in the literature to demonstrate the association between adropin and DBP in obese adolescents aged 10 - 18 years. Our study revealed an inverse, weak, and statistically significant relationship between adropin levels and DBP in obese adolescents. In addition, no significant relationship was detected between adropin and SBP. Our result is consistent with the findings of some studies in the literature (4, 15). In their study, Erman et al. (4) found that serum adropin level was negatively correlated with DBP but not with SBP in obese adults. Similarly, Zhang et al. (15) found that serum adropin levels were negatively correlated with DBP but not SBP in adolescents aged 16 to 19 years. Gu et al. (16) observed that adropin levels were significantly decreased in patients with essential hypertension compared with normotensives and that adropin levels were negatively correlated with both SBP and DBP. Altincik and Sayin (17) showed in their study of obese children aged 7.5 to 16.4 years that adropin levels were decreased in hypertensive children. Still, there was no correlation between blood pressure variables and adropin levels. The differences between studies suggest that there is not yet a consensus in the literature and that further studies with larger sample groups are needed.
Endothelial dysfunction and vascular complications are common complications associated with high blood pressure (27). The endothelium has a critical role in maintaining vascular homeostasis, and endothelial dysfunction contributes to the occurrence and progression of cardiovascular disease (28). Nitric oxide (NO), a potent endogenous vasodilator, is released by endothelial nitric oxide synthase (eNOS). Nitric oxide has an important role in the maintenance of endothelial homeostasis and flow-mediated dilation (29). Adropin has been shown to increase eNOS expression in the endothelium by activating some signaling pathways (vascular endothelial growth factor receptor (EGFR) 2, phosphatidylinositol 3-kinase Akt, and EGFR 2 extracellular signal-regulated kinase 1/2) (30, 31). Because eNOS is responsible for vascular NO production, adropin deficiency has been associated with decreased NO bioavailability in the endothelium (26, 32). Some investigators have also reported decreased adropin levels in individuals with endothelial dysfunction (11, 33). Aydin et al. (34) found that adropin is an independent marker of essential hypertension. In this context, adropin may have a protective effect on endothelial function. Decreased adropin levels could play a role in the development of high blood pressure by leading to decreased NO levels and endothelial dysfunction. The inverse correlation between adropin and DBP, as determined in our study, is corroborated by this aspect.
An experimental rat study by Yosof and Husam showed that the administration of adropin significantly reduced SBP and DBP and significantly reduced DBP in the adropin-treated group compared with the control group (35). In this study, adropin significantly reduced DBP in both normal and induced hypertensive rats but reduced SBP only in hypertensive rats (34). This finding suggests that adropin-based therapies may be beneficial in regulating high blood pressure. However, we believe that studies with large samples that include other adropin-related molecules in the evaluation are needed to clarify the differences between studies. In addition, A study in diabetic rats has shown that the expression of adropin is increased in the brain (36). Adropin knockout mice were found to have decreased locomotor activity, impaired synapse formation, and impaired motor coordination (37). These studies provide evidence that adropin may also have effects on the nervous system. Therefore, it may also be of interest to investigate whether adropin can affect blood pressure by regulating the nervous system.
In the current study, we found increased triglyceride and LDL-cholesterol levels along with decreased HDL-cholesterol levels in the obese adolescent group. Increased serum triglyceride, total cholesterol, LDL-cholesterol levels, and decreased HDL-cholesterol levels may be seen in obese adolescents (38). CRP levels were significantly lower in the control group than those of obese adolescents. Elevated CRP levels suggest a low-grade inflammation in obesity (39). Also, the ALT and AST levels of the healthy control group were significantly lower than those of the obese adolescents. Slight increases in transaminase levels are among the laboratory findings seen in obesity (40). We also found lower vitamin D levels in obese adolescents. Codoner-Franch et al. (41) reported that vitamin D3 levels were significantly lower in obese children aged 9 - 14 years compared to controls. In another study, low vitamin D3 levels were associated with obesity (42). Our finding of low vitamin D is consistent with the data in the literature. This should be taken into consideration when evaluating vitamin D supplementation for obese patients. Also, in the current study, there was no statistically significant correlation between adropin level and biochemical parameters (glucose, insulin, HOMA-IR, urea, creatinine, AST, ALT, GGT, CRP, total cholesterol, triglyceride, HDL- cholesterol, LDL-cholesterol, TSH, free T4, and 25-hydroxyvitamin D3 levels) in the obese group.
Compared with the limited number of existing studies that have investigated the correlation between adropin levels and obesity, the literature lacks sufficient studies on the relationship between diet, exercise, and adropin levels. Shahdadian et al.'s study demonstrated that a plant-based diet did not alter adropin levels in patients with metabolic syndrome (43). In contrast, Zhang et al. observed low adropin levels in obese patients. However, it was observed that adropin levels considerably increased after 12 weeks of aerobic exercise in the same group of patients (15). Further research is required to comprehend the correlation between Adropin levels, physical activity, and diet in overweight individuals.
Our study has some limitations. These limitations include the small sample size, and we could not measure NO levels in our cases. In addition, studies with larger sample groups, in which obese adolescents are divided into groups such as those with and without insulin resistance and those with and without hypertension, might reveal more clearly the relationship between adropin and blood pressure. Another limitation of our study is that the patients were not evaluated in terms of diet, exercise, and socioeconomic status. Finally, the lack of a healthy weight hypertensive control group needs to be mentioned. It would be informative also to include obese normotensive and healthy-weight hypertensive adolescents to better differentiate the effects of obesity and hypertension on adropin levels.
5.1. Conclusions
We found an inverse relationship between adropin levels and DBP but observed no relationship between adropin levels and SBP in obese adolescents.
