


1. Background
The incidence of childhood obesity has increased worldwide over the past fifty years (1). The World Health Organization reported that in 2022, 37 million children under five years of age were overweight, more than 390 million children aged 5 - 19 years were overweight, and 160 million children and adolescents were obese (2). Pediatric obesity is likely to persist into later years of life and is associated with cardiometabolic, oncologic, and psychosocial comorbidities, as well as early death (1, 3, 4). Metabolic syndrome (MetS), defined by dyslipidemia, hypertension, abdominal obesity, and insulin resistance (IR), is an important cardiovascular risk factor (5, 6). The MetS has been reported in 6 - 39% of adolescents and children with obesity (7). In addition to cardiovascular disease, MetS can predict type 2 diabetes. Preventing pediatric obesity is crucial for reducing MetS, related cardiovascular diseases, and type 2 diabetes. Therefore, screening for MetS and obesity is recommended in pediatric follow-ups (6, 8).
The strong interaction between obesity, IR, and inflammation plays a crucial role in the pathogenesis of MetS. Stimulation of growth factors and inflammatory cytokines in vascular smooth muscle cells by insulin triggers the inflammatory cascade (9, 10). The value of various indices, such as the platelet-to-lymphocyte ratio (PLR), lymphocyte-to-monocyte ratio (LMR), and neutrophil-to-lymphocyte ratio (NLR), in predicting clinical and subclinical inflammation has been demonstrated in many studies (11-13). In recent years, the Systemic Inflammation Response Index (SIRI) and Systemic Immune–Inflammation Index (SII), which combine these indices as new biomarkers, have been incorporated into adult studies. In addition to indicating inflammation, these indices are also valuable in predicting the severity and prognosis of disease (14-17). The SIRI is calculated by multiplying the neutrophil count by the monocyte count and dividing by the lymphocyte count, while SII is calculated by multiplying the neutrophil count by the platelet count and dividing by the lymphocyte count. Neutrophils, through the secretion of chemotactic factors and granule proteins, attract monocytes and macrophages, working together to initiate innate immune responses and facilitate immune cell infiltration (18). Additionally, neutrophil-platelet interactions are essential for initiating immune responses (19, 20). By evaluating three hematological parameters, SIRI and SII demonstrate a superior ability to characterize the delicate balance between inflammation and immune responses compared to other indices that utilize only two parameters (21-24). Metabolic syndrome is a pro-inflammatory state characterized by the continuous release of local and systemic bioactive molecules, such as adipokines, cytokines, and white blood cells, from visceral adipocytes, leading to a systemic inflammatory response (25). The role of SIRI and SII in predicting MetS has been demonstrated in most studies conducted on adult obese individuals (26-30). However, there are few studies on obese children and adolescents, and all are retrospective (31-33).
2. Objectives
We aimed to evaluate the role of systemic inflammatory indices (SIRI and SII) in predicting MetS in obese children and to assess their relationship with the components of MetS prospectively.
3. Methods
3.1. Research Design and Sample
This prospective, single-center, cross-sectional study was conducted from February to April 2024 at the Health Sciences University Bağcılar Training and Research Hospital (Istanbul, Turkey), a tertiary general public hospital. The study included children aged 10 to 16 years with a Body Mass Index (BMI) at or above the 95th percentile. Children with secondary obesity (monogenic obesity, genetic obesity, endocrine pathology), as well as those with renal, hepatic, immunological, oncological, or hematologic disorders, a history of chronic drug use, or acute or chronic infections, were excluded. Participants diagnosed with polycystic ovary syndrome, pubertal disorders, or diabetes mellitus were also excluded from the study sample. The Istanbul Medipol University Non-interventional Clinical Ethics Committee approved the study on 15.02.2024 (decision No: 188), in accordance with the Declaration of Helsinki. Informed consent was obtained from both the children and their parents.
Obesity in children was diagnosed using the Turkish BMI percentile curves, classifying those with a BMI at or above the 95th percentile for their gender and age as obese (34). The presence of MetS in the study group was assessed based on the International Diabetes Federation (IDF) criteria. For diagnosis, a waist circumference (WC) at or above the 90th percentile for children aged 10 - 16, along with at least two of the following criteria, was required: Triglycerides (TG) ≥ 150 mg/dL, high-density lipoprotein cholesterol (HDL-C) < 40 mg/dL, fasting plasma glucose (FPG) ≥ 100 mg/dL, and systolic and diastolic blood pressure (SBP and DBP) ≥ 130 and ≥ 85 mmHg, respectively (35). Waist circumference was evaluated using percentile curves specific to Turkish children and adolescents, based on sex and age (36). Participants were categorized into two groups: Those with MetS (MetS+) and those without (MetS-). Sample size determination was conducted using PASS 15 Power Analysis and Sample Size Software (2017) (NCSS, LLC, USA, available at ncss.com/software/pass). This was based on findings from a study titled "Assessing the Relationship between Systemic Immune-Inflammation Index and MetS in Children with Obesity" (32), which found an AUC of 0.843 for distinguishing MetS patients. Using a random sample of 39 subjects from the MetS+ population and 39 subjects from the MetS- population among children with obesity, the sample size was calculated as 59 for each group, assuming an AUC of 0.800 and an expected dropout rate of 33.3%. A sample of 59 from the positive group and 59 from the negative group achieves 69% power to detect a difference of 0.0900 between the area under the ROC curve (AUC) under the null hypothesis of 0.8000 and an AUC under the alternative hypothesis of 0.708 using a one-sided z-test at a significance level of 0.050.
3.2. Clinical and Laboratory Evaluation
Each participant had their weight, height, WC, and blood pressure measured, with age and sex also documented. All measurements were consistently taken by the same trained nurse. Weight, height, and WC were measured twice, and the average value was used. Height was recorded using a Harpenden stadiometer, and body weight was measured with an electronic scale, rounded to the nearest tenth of a kilogram. Waist circumference was measured after exhalation at the midpoint between the lowest rib and the uppermost part of the iliac crest, using a non-stretchable tape measure while the participant stood upright. Blood pressure measurements were taken in a resting position using a sphygmomanometer with a properly fitted cuff on the right arm. Measurements were taken on three separate occasions, and the mean SBP and DBP values were recorded. Normal blood pressure ranges were determined based on age- and sex-specific charts. The children's pubertal development was assessed according to Tanner staging, with stage 1 classified as prepubertal and stages 2 - 5 as pubertal (37).
Blood sampling was done at 8:00 AM following an overnight fast. A complete hemogram and levels of insulin, FPG, low-density lipoprotein cholesterol (LDL-C), total cholesterol, HDL-C, and TG were assessed in the hospital's biochemistry laboratory. The homeostasis model assessment of insulin resistance (HOMA-IR) was calculated using the formula: Fasting plasma glucose (mg/dL) × insulin (µIU/mL)/405 (38). Various indices, such as NLR, LMR, platelet × neutrophil/lymphocyte ratio (SII), PLR, and neutrophil × monocyte/lymphocyte ratio (SIRI), were derived from the hemogram using counts of neutrophils, lymphocytes, monocytes, and platelets.
3.3. Statistical Analysis
Statistical analysis was performed using SPSS 29 and MedCalc® 22.016 (available online at https://www.medcalc.org; 2023). Descriptive data are presented as mean ± standard deviation or median, along with maximum and minimum values for continuous variables, and as percentages and frequencies for categorical variables. The normality of distribution was assessed using the Kolmogorov–Smirnov test. For comparing two independent groups with non-normal distribution, the Mann–Whitney U test was used. Ninety-five percent confidence intervals were calculated for mean differences. Cohen's d effect size was calculated to evaluate the magnitude of the effects, with the following interpretations: 0.00 - 0.19 as very small, 0.20 - 0.49 as small, 0.5 - 0.79 as medium, and 0.80+ as large effect size. The chi-square test was used to examine differences in categorical variables. To determine the risk factors affecting the dependent variable, multivariate analysis was performed using the enter method in logistic regression. Odds ratios for significant risk factors were calculated with 95% confidence intervals. The appropriateness of the model was evaluated using the Hosmer-Lemeshow test. The percentage of independent variables explaining the dependent variable was assessed with the Nagelkerke R² value. The Spearman correlation coefficient was used to determine the relationships between variables. The diagnostic capabilities of the indices for predicting MetS were assessed through receiver operating characteristic (ROC) curve analysis. When significant cutoff values were found, sensitivity, specificity, and cutoff values were determined. The area under the curve (AUC) was evaluated, and findings below the Type I error threshold were considered to demonstrate significant diagnostic value. A P-value < 0.05 was considered statistically significant.
4. Results
4.1. Characteristics of the Study Group
The study group consisted of 99 children and adolescents with obesity; 57.6% were female, with a median age of 12 years (range: 10 - 16), and 42.4% were classified as MetS+. Fifty percent of the MetS+ group (n = 42) were female, while 37% of the MetS- group (n = 57) were male. The age and sex distributions of the groups showed no significant differences (P = 0.923 and P = 0.190, respectively). When evaluated according to pubertal status, 66.7% of the participants were in the pubertal stage. There was no statistically significant difference between the groups in terms of prepubertal and pubertal status (P = 0.857). Tables 1 and 2 present the laboratory and clinical factors for each group. Significant differences were observed between the groups for the mean values of systolic blood pressure (SBP) (P < 0.001), DBP (P < 0.001), HDL-C (P = 0.003), TG (P < 0.001), FPG (P < 0.001), insulin (P = 0.002), and HOMA-IR (P < 0.001). Only the mean HDL-C was lower in the MetS+ group, while the means of the other variables were higher in the MetS+ group compared to the MetS- group.
| Variables and Groups | Mean ± SD (Median) | Minimum - Maximum | Mean Difference | St. Error Difference | 95% CI of the Difference | Cohen’s Effect Size | P-Value | |
|---|---|---|---|---|---|---|---|---|
| Lower | Upper | |||||||
| Age (y) | -0.055 | 0.386 | -0.822 | 0.711 | -0.026 | 0.923 | ||
| MetS- | 12.57 ± 1.88 (12.00) | 10.00 - 16.00 | ||||||
| MetS+ | 12.52 ± 1.91 (12.00) | 10.00 - 16.00 | ||||||
| BMI (kg/m2) | 1.825 | 0.854 | 0.131 | 3.522 | 0.42 | 0.128 | ||
| MetS- | 30.01 ± 3.53 (29.38) | 24.00 - 39.26 | ||||||
| MetS+ | 31.83 ± 4.96 (30.17) | 23.73 - 43.28 | ||||||
| WC (cm) | 0.234 | |||||||
| MetS- | 94.38 ± 9.43 (93.00) | 77.00 - 120.00 | ||||||
| MetS+ | 97.92 ± 12.47 (96.00) | 80.00 - 128.00 | ||||||
| SBP(mmHg) | 16.271 | 2.023 | 12.255 | 20.288 | 1.68 | < 0.001 | ||
| MetS- | 120.21 ± 10.77 (120.00) | 100.00 - 152.00 | ||||||
| MetS+ | 136.50 ± 8.69 (135.00) | 116.00 - 168.00 | ||||||
| DBP (mmHg) | 8.338 | 1.793 | 4.779 | 11.897 | 0.94 | < 0.001 | ||
| MetS- | 67.94 ± 8.17 (70.00) | 44.00 - 90.00 | ||||||
| MetS+ | 76.28 ± 9.62 (80.00) | 53.00 - 98.00 | ||||||
| Cholesterol (mg/dL) | 3.015 | 5.229 | -7.363 | 13.393 | 0.117 | 0.576 | ||
| MetS- | 163.41 ± 27.78 (164.80) | 112.90 - 241.00 | ||||||
| MetS+ | 166.43 ± 22.58 (165.70) | 120.00 - 221.00 | ||||||
| LDL-C (mg/dL) | 5.027 | 4.646 | -4.193 | 14.249 | 0.220 | 0.462 | ||
| MetS- | 92.64 ± 23.05 (95.36) | 38.12 - 152.00 | ||||||
| MetS+ | 97.67 ± 22.56 (95.50) | 52.24 - 181.50 | ||||||
| HDL-C (mg/dL) | -5.808 | 3.263 | -12.286 | 0.669 | -0.362 | 0.003 | ||
| MetS- | 52.35 ± 13.91 (50.20) | 31.20 - 117.16 | ||||||
| MetS+ | 46.54 ± 18.57 (41.00) | 24.10 - 114.78 | ||||||
| TG (mg/dL) | 36.538 | 10.175 | 16.343 | 56.733 | 0.73 | < 0.001 | ||
| MetS- | 106.00 ± 42.72 (95.40) | 37.90 - 226.40 | ||||||
| MetS+ | 142.54 ± 58.57 (140.00) | 39.40 - 318.00 | ||||||
| FPG (mg/dL) | 6.388 | 1.633 | 3.146 | 9.631 | 0.795 | < 0.001 | ||
| MetS- | 88.24 ± 5.97 (88.00) | 74.00 - 99.70 | ||||||
| MetS+ | 94.63 ± 10.19 (96.90) | 73.70 - 116.00 | ||||||
| Insulin (µIU/mL) | 7.827 | 3.237 | 1.400 | 14.253 | 0.492 | 0.002 | ||
| MetS- | 22.56 ± 15.52 (17.65) | 2.99 - 101.20 | ||||||
| MetS+ | 30.39 ± 16.44 (28.55) | 11.11 - 74.10 | ||||||
| HOMA-IR | 2.286 | 0.801 | 0.694 | 3.877 | 0.580 | < 0.001 | ||
| MetS- | 4.99 ± 3.55 (3.73) | 0.60 - 21.64 | ||||||
| MetS+ | 7.27 ± 4.41 (6.21) | 2.25 - 20.53 | ||||||
Clinical and Laboratory Parameters of the Groups a
4.2. Hematologic and Inflammatory Parameters of the Study Group
The white blood cell (WBC) count (P = 0.003), platelet count (P = 0.022), and neutrophil count (P < 0.001) were higher in the MetS+ group. In contrast, there was no significant difference in the number of lymphocytes (P = 0.865) or monocytes (P = 0.488) between the two groups. When inflammatory parameters were compared, the mean values of the NLR (P = 0.002), SII (P < 0.001), PLR (P = 0.024), and SIRI (P = 0.012) were significantly higher in the MetS+ group compared to the MetS- group (Table 3). To identify the risk factors associated with the presence of MetS, binary logistic regression analysis was performed using the enter method. The analysis revealed that SII (P = 0.003) and HOMA-IR (P = 0.012) were statistically significant risk factors for MetS, as shown in Table 4.
| Variables and Groups | Mean ± SD (Median) | Minimum-Maximum | Mean Difference | St. Error Difference | 95% CI of the Difference | Cohen’s Effect Size | P-Valuea | |
| Lower | Upper | |||||||
| WBCs (× 10³/mm³) | 1.503 | 0.506 | 0.498 | 2.509 | 0.603 | 0.003 | ||
| MetS- | 8.20 ± 2.06 (7.84) | 4.91 - 14.50 | ||||||
| MetS+ | 9.70 ± 2.97 (9.23) | 4.19 - 19.09 | ||||||
| Platelets (× 10³/mm³) | 36.511 | 12.925 | 10.857 | 62.165 | 0.574 | 0.022 | ||
| MetS- | 305.63 ± 65.24 (310.00) | 165.00 - 424.00 | ||||||
| MetS+ | 342.14 ± 61.19 (339.50) | 230.00 - 488.00 | ||||||
| Neutrophils(× 10³/mm³) | 1.304 | 0.392 | 0.525 | 2.083 | 0.676 | < 0.001 | ||
| MetS- | 4.24 ± 1.55 (4.10) | 1.80 - 9.82 | ||||||
| MetS+ | 5.54 ± 2.34 (5.23) | 1.81 - 14.60 | ||||||
| Lymphocytes (× 10³/mm³) | 0.030 | 0.177 | -0.320 | 0.382 | 0.035 | 0.865 | ||
| MetS- | 3.09 ± 0.81 (3.07) | 1.51 - 6.31 | ||||||
| MetS+ | 3.12 ± 0.94 (2.90) | 1.53 - 6.87 | ||||||
| Monocytes (× 10³/mm³) | 0.122 | 0.183 | -0.143 | 0.288 | 0.298 | 0.488 | ||
| MetS- | 0.82 ± 0.31 (0.78) | 0.30 - 1.71 | ||||||
| MetS+ | 0.94 ± 0.51 (0.79) | 0.29 - 2.43 | ||||||
| NLR | 0.433 | 0.139 | 0.157 | 0.710 | 0.633 | 0.002 | ||
| MetS- | 1.42 ± 0.53 (1.34) | 0.52 - 2.87 | ||||||
| MetS+ | 1.85 ± 0.84 (1.74) | 0.68 - 5.07 | ||||||
| PLR | 13.365 | 6.338 | 0.785 | 25.945 | 0.429 | 0.024 | ||
| MetS- | 103.46 ± 29.69 (105.17) | 49.13 - 194.68 | ||||||
| MetS+ | 116.83 ± 33.08 (116.51) | 53.57 - 197.39 | ||||||
| SII | 213.207 | 52.499 | 109.009 | 317.405 | 0.826 | < 0.001 | ||
| MetS- | 430.25 ± 163.23 (423.09) | 142.21 - 817.28 | ||||||
| MetS+ | 643.46 ± 348.27 (562.73) | 222.37 - 2088.6 | ||||||
| SIRI | 0.616 | 0.211 | 0.196 | 1.036 | 0.592 | 0.012 | ||
| MetS- | 1.16 ± 0.70 (0.96) | 0.43 - 3.67 | ||||||
| MetS+ | 1.78 ± 1.37 (1.44) | 0.36 - 2.95 | ||||||
Hematologic Parameters of the Study Groups
| Variables | B | Standard Error | Wald | df | P-Value | Odds Ratio | 95% CI for Odds Ratio | |
|---|---|---|---|---|---|---|---|---|
| Lower | Upper | |||||||
| Pubertal status | -0.650 | 0.582 | 1.245 | 1 | 0.264 | 0.522 | 0.167 | 1.635 |
| SII | 0.005 | 0.002 | 8.995 | 1 | 0.003 | 1.005 | 1.002 | 1.008 |
| SIRI | -0.192 | 0.346 | 0.309 | 1 | 0.578 | 0.825 | 0.419 | 1.625 |
| BMI | 0.117 | 0.066 | 3.141 | 1 | 0.076 | 1.124 | 0.988 | 1.280 |
| HOMA-IR | 0.157 | 0.062 | 6.345 | 1 | 0.012 | 1.170 | 1.036 | 1.323 |
| Constant | -6.764 | 2.144 | 9.954 | 1 | 0.002 | 0.001 | ||
Binary Logistic Regression Analysis of Independent Variables Affecting the Presence of Metabolic Syndrome
4.3. Associations of Systemic Immune–Inflammation Index and Systemic Inflammatory Response Index with Components of Metabolic Syndrome
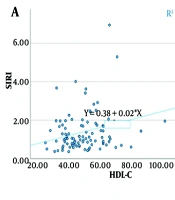
Spearman correlation coefficients were calculated to analyze the relationships between the variables (Table 5). Significant positive correlations were found between SII and DBP (P = 0.024), high-density lipoprotein cholesterol (HDL-C) (P = 0.019), and FPG (P = 0.048) (Figure 1). Similarly, significant positive correlations were observed between SIRI and HDL-C (P = 0.044) and FPG (P < 0.001) (Figure 2).
| Variables | Spearman's rho | P-Value | 95% CI (2-Tailed) a, b | |
|---|---|---|---|---|
| Lower | Upper | |||
| SII-WC | -0.054 | 0.595 | -0.254 | 0.151 |
| SII-SBP | 0.143 | 0.158 | -0.062 | 0.336 |
| SII-DBP | 0.227 | 0.024 | 0.026 | 0.412 |
| SII-HDL-C | 0.235 | 0.019 | 0.033 | 0.418 |
| SII-TG | -0.133 | 0.188 | -0.328 | 0.072 |
| SII-FPG | 0.199 | 0.048 | -0.004 | 0.387 |
| SIRI-WC | 0.078 | 0.445 | -0.128 | 0.276 |
| SIRI-SBP | 0.182 | 0.072 | -0.022 | 0.371 |
| SIRI-DBP | -0.079 | 0.436 | -0.278 | 0.126 |
| SIRI-HDL-C | 0.203 | 0.044 | 0.000 | 0.390 |
| SIRI-TG | -0.138 | 0.173 | -0.332 | 0.067 |
| SIRI-FPG | 0.352 | < 0.001 | 0.160 | 0.518 |
Relationship Between Systemic Inflammatory Response Index, Systemic Immune–Inflammation Index, and Components of Metabolic Syndrome
 and high-density lipoprotein cholesterol (HDL-C) (A), SII and diastolic blood pressure (DBP) (B), SII and fasting plasma glucose (FPG) (C).")
Scatter plot showing the relationship between Systemic Immune–Inflammation Index (SII) and high-density lipoprotein cholesterol (HDL-C) (A), SII and diastolic blood pressure (DBP) (B), SII and fasting plasma glucose (FPG) (C).
 and fasting plasma glucose (FPG) (A), SIRI and high-density lipoprotein cholesterol (HDL-C) (B).")
Scatter plot showing the relationship between Systemic Inflammatory Response Index (SIRI) and fasting plasma glucose (FPG) (A), SIRI and high-density lipoprotein cholesterol (HDL-C) (B).
4.4. Comparison of Systemic Immune–Inflammation Index and Systemic Inflammatory Response Index in Predicting Metabolic Syndrome
Receiver operating characteristic analysis was conducted to assess the ability of the indices to predict MetS. The SII demonstrated a sensitivity of 0.57, an AUC of 0.708, a specificity of 0.82, and a cutoff point of 547, showing better discrimination than the SIRI (Table 6, Figure 3).
| Test Result Variables | AUC | Standard Error | P-Value | Asymptotic 95% CI | Sensitivity | Specificity | Cut-Off | |
|---|---|---|---|---|---|---|---|---|
| Lower Bound | Upper Bound | |||||||
| SII | 0.708 | 0.053 | 0.001 | 0.603 | 0.812 | 0.57 | 0.82 | 547.97 |
| SIRI | 0.649 | 0.059 | 0.012 | 0.534 | 0.763 | 0.61 | 0.68 | 1.14 |
Comparison of Systemic Immune–Inflammation Index and Systemic Inflammatory Response Index in Differentiating Metabolic Syndrome
 curves for Systemic Immune-Inflammation Index (SII) and Systemic Inflammation Response Index (SIRI) to differentiate metabolic syndrome (MetS)")
Receiver operating characteristic (ROC) curves for Systemic Immune-Inflammation Index (SII) and Systemic Inflammation Response Index (SIRI) to differentiate metabolic syndrome (MetS)
5. Discussion
In this study, the values of SII and SIRI were significantly higher in children and adolescents with obesity who had MetS. The SII was found to be more discriminative in predicting MetS compared to the SIRI. Additionally, significant positive correlations were found between SII and DBP, HDL-C, and FPG in MetS patients, as well as between SIRI and HDL-C and FPG.
With the increasing prevalence of obesity in children and adolescents, the incidence of MetS, one of the comorbidities associated with obesity, is rising. The lack of an international consensus on the definition of MetS in the pediatric population complicates the estimation of its prevalence (7, 9, 39). Ozturk et al. (40) reported MetS in 45.1% of 62 children with obesity according to IDF criteria in their study conducted in Turkey. In our study, MetS was found in 42.4% of children with obesity who met the same criteria. Another study that determined the presence of MetS according to IDF criteria was conducted by Nicoara et al. (32). In this study, which included 191 obese Romanian children, the prevalence of MetS was reported to be 34.5%. No significant differences were observed in age or gender between the groups with and without MetS. A further study by Marra et al. (31) in Italy reported that 26.4% of 552 severely obese children and adolescents had MetS. While the prevalence of MetS was found to be higher in males, no significant difference was observed between the groups with and without MetS in terms of gender. In our study, the MetS+ and MetS- groups were similar in terms of gender and age.
Chronic low-grade activation and inflammation of the immune system contribute to the pathogenesis of obesity-induced type 2 diabetes and IR. Infiltration of macrophages and other immune cells can be observed in the liver, pancreas, muscle, and adipose tissue, where inflammation occurs in the presence of obesity (40). These cells contribute to local inflammation, defects in adipogenesis, and IR by producing proinflammatory cytokines. The strong interaction between inflammation, obesity, and IR leads to MetS (9, 10, 41).
Inflammation is thought to be the pathophysiologic basis of MetS. The presence of excess free fatty acids and glucose triggers the release of inflammatory factors such as TNF-α, pro-inflammatory arachidonic acid, and leukotrienes, attracting neutrophils to inflamed tissues and initiating the inflammatory response. T regulatory cells have been found to inhibit IR and atherosclerosis by suppressing pro-inflammatory T-cells and macrophages (42). In metabolic diseases, there is an increased survival of neutrophils and chronic accumulation in inflammatory regions, leading to the prolonged release of cytokines that exacerbate IR. Highly activated platelets in MetS contribute to inflammation by releasing small molecules and cytokines, as well as promoting immune cell adhesion. The SIRI and SII assess three hematologic parameters—neutrophil/monocyte, lymphocyte, and platelet—which reflect the interaction of multiple cell types and provide a more comprehensive response to the complex immune-inflammatory state of the body (18-24, 26).
The SII and SIRI are new-generation inflammatory markers associated with disease severity and poor prognosis (14, 43, 44). Moreover, this relationship has been shown to be superior to that of other inflammatory markers, such as the PLR and NLR (16, 45, 46). A few studies have investigated the SII and SIRI values in predicting the presence and severity of obesity-related MetS. In a study by Marra et al. (28), conducted with 231 adults with extreme obesity, it was found that the SII and SIRI were correlated with the severity of MetS and also with HOMA-IR. In a US adult cohort of 6,999 participants, MetS was diagnosed in approximately one-third of the participants, and the SII was found to be independently and positively correlated with both MetS and hypertension (26).
In a study evaluating macular damage and the inflammatory indices NLR, PLR, and SII in obese Turkish adolescents and children with MetS, it was shown that high NLR and SII values were associated with macular damage (40). In a retrospective study involving 191 obese Romanian children, Nicoara et al. (32) reported higher NLR, PLR, SII, and SIRI values in the group with MetS. Binary logistic regression analysis revealed that SII and the TG: High-density lipoprotein cholesterol ratio were independent predictors of MetS. They emphasized that SII was a significant marker for identifying MetS in children with obesity and showed a positive correlation with HOMA-IR, non-HDL-C, and TG: High-density lipoprotein cholesterol, which are cardiometabolic risk biomarkers. In another study conducted in Romania, 71 children and adolescents aged 6 - 16 years were retrospectively analyzed, including 5 who were overweight, 35 who were obese, and 31 who were severely obese. Metabolic syndrome (45.1%) was detected in 32 of them according to the NCEP ATP III criteria. Erythrocyte sedimentation rate, PLR, NLR, and SII were not useful in predicting MetS or differentiating the degree of obesity, whereas TG: High-density lipoprotein cholesterol, total cholesterol: High-density lipoprotein cholesterol, platelets to HDL-C ratio (PHR), monocytes to HDL-C ratio (MHR), neutrophils to HDL-C ratio (NHR), lymphocyte to HDL-C ratio (LHR), and the Atherogenic Index of Plasma were found to be significant (33). In the retrospective study by Marra et al. (31), which included a larger number of patients, it was reported that the NHR, LHR, and MHR indices were correlated with the severity of MetS, whereas SIRI was not. In our study, we prospectively evaluated the value of SII and SIRI in predicting MetS in obese adolescents and children and their relationship with MetS components. In the MetS+ group, WBC, platelet, neutrophil, PLR, NLR, SII, and SIRI values were higher. Binary logistic regression analysis, using the enter method, was performed to determine the risk factors affecting the presence of MetS. Accordingly, SII and HOMA-IR were found to be statistically significant risk factors for MetS.
Nicoara et al. (32) showed that WC was the only individual component significantly associated with SII when evaluating the relationship between SII and the components of MetS using multiple regression analysis. In our study, we found a significant positive correlation between SII and DBP, HDL-C, and FPG among the components of MetS, as well as between SIRI and HDL-C and FPG. Receiver operating characteristic analysis assessed the ability of the indices to predict MetS. The SII demonstrated a sensitivity of 0.57, an AUC of 0.708, a specificity of 0.82, and a cutoff point of 547, with greater discrimination than the SIRI.
Our study is one of the few that evaluates inflammatory indices for predicting MetS in adolescents and children with obesity. The main difference between our study and these few studies is that ours is prospective. However, our research has some limitations. When power calculations were performed to validate the sample size, it was found that the desired target was not achieved. Therefore, a significant limitation of our study is the small number of cases. Although it was a prospective study, it was a single-center, cross-sectional study with a relatively small sample size. Since it was not a longitudinal study, we could not provide information on the onset and progression of MetS. Third, we did not include a normal-weight control group. The primary aim of our study was not to compare with a normal-weight healthy group. In the future, we plan to conduct a prospective longitudinal multicenter study with a larger number of subjects, including a normal-weight control group. We also emphasize the importance of conducting studies that investigate the utility of these indices in the follow-up of nutritional and pharmacologic interventions in children and adolescents with MetS. In our study, the effect of pubertal status was evaluated in obese children with MetS, but no association with puberty was found. Further studies on this subject are needed.
5.1. Conclusions
The SIRI and SII can predict the presence of MetS in adolescents and children with obesity and are correlated with the components of MetS. Both the SII and SIRI are easily calculated from hemogram parameters and can be quickly used to assess the presence of MetS in adolescents and children with obesity. These inflammatory indices may guide the diagnosis and treatment of pediatric MetS, an important risk factor for diabetes and cardiovascular damage, before irreversible damage occurs.
