1. Background
Syndecans, a family of heparan sulfate proteoglycan (HSPG) glycoproteins, are widely found on cell surfaces and within the extracellular matrix of all mammalian tissues. They play a crucial role in various cellular functions, including adhesion, movement, growth, specialization, and angiogenesis, through their own signaling mechanisms and interactions with growth factors (1). There are four known syndecans in vertebrates: Syndecan 1 to syndecan 4 (1, 2). Syndecans serve as major transmembrane proteoglycans, influencing the activity of leukocytes, endothelial cells, and chemokines in different ways (3). Syndecan 4 is linked to wound healing and angiogenesis, while syndecan 3 is involved in regulating feeding behavior through the modulation of hypothalamic melanocortin activity. Syndecan 1, which is expressed in epithelial and other nonhematopoietic cells, is considered a marker for the development of B lymphocytes and plasma cells (4). However, the role of syndecan 1 in regulating body fat and glucose homeostasis remains unclear (2).
The assessment of heparan sulfate and syndecan 1 can help evaluate the degree of glycocalyx disruption, which is an indicator of the endothelial response to inflammation (5). Childhood obesity, characterized by excessive fat accumulation, has emerged as a major global health concern due to its medical, social, and psychological complications. Oxidative stress, metabolic dysfunction, and low-grade inflammation are key mechanisms driving the pathogenesis of obesity. Adipose tissue acts not only as an energy store but also as a metabolically active tissue that releases hormones and cytokines (6). This adipose tissue activity is linked to a mild, chronic inflammatory response, which leads to adipocyte hypertrophy, apoptosis, increased production of pro-inflammatory adipokines, and the release of free fatty acids, all of which activate the immune system (7, 8).
Given the extensive roles of heparan sulfate in inflammation, it is not surprising that syndecans modulate the behavior of chemokines, leukocytes, and endothelial cells in various ways (9). Syndecan 1 has been identified as a potential biomarker for cardiac fibrosis and plays a role in the accumulation of foam cells within the intimal smooth muscle. In syndecan-1-deficient individuals, there is an increase in inflammatory macrophages, which heightens the risk of atherosclerotic plaque development (10). Syndecan 1 is also thought to be involved in processes such as adhesion, cell growth, wound healing, differentiation, and inflammation (11), and it acts as a negative regulator of endothelial-leukocyte interactions (12). Despite its importance, there are limited studies examining serum syndecan 1 levels in obese adolescents and children (13).
2. Objectives
This study aimed to evaluate serum syndecan 1 levels in obese children and investigate the relationship between its levels and the complications associated with childhood obesity.
3. Methods
In this research, 30 obese and 30 healthy children aged 8 to 16 years, who were admitted to our pediatric outpatient clinic between January and August 2023, were included. Patients with chronic conditions such as diabetes, inflammatory diseases, and infectious diseases, as well as those using oral insulin, antidiabetic, antihypertensive, or lipid-lowering drugs, were excluded. The study adhered to the principles of the Declaration of Helsinki and was approved by the local ethics committee (22.12.2023/no: 364). Informed consent was obtained from all patients and their parents prior to conducting measurements and necessary examinations.
Height and weight were measured using a Harpenden stadiometer, with participants wearing light clothing and no shoes. Body Mass Index (BMI) was calculated by dividing body weight by the square of height (kg/m²), and its standard deviation score (SDS) was determined based on the standards established for Turkish children (14). Children with a BMI between the 5th and 85th percentile (BMI-SDS -1, +1) were included in the healthy control group, while those with a BMI in the 95th percentile or higher (BMI SDS +2 and above) were included in the obese group.
Blood samples were collected from both the control and obese groups after 10 - 12 hours of fasting in the morning. Serum concentrations of alanine aminotransferase (ALT), aspartate aminotransferase (AST), syndecan-1, fasting blood glucose (FBG), creatinine, and urea were measured in both groups. Additionally, in the obese group, blood samples were analyzed for low-density lipoprotein cholesterol (LDL-C), triglycerides (TG), insulin, and high-density lipoprotein cholesterol (HDL-C), as part of routine obesity screenings. Blood specimens were centrifuged at 4000 rpm for 15 minutes after clotting, and approximately 5 mL of serum was transferred to Eppendorf tubes and stored at -80°C until analysis. Biochemical parameters were measured from the remaining serum on the same day using a Roche Cobas 6000 analyzer. The Homeostasis Model Assessment for Insulin Resistance (HOMA-IR) was calculated as FBG (mmol/L) × fasting insulin (IU/mL)/22.5. Syndecan-1 levels were measured from serum samples stored in Eppendorf tubes using the Bioassay Technology Laboratory (BT-LAB) Human Syndecan-1 ELISA Kit, Catalog No: E3344 Hu, which employs a sandwich ELISA method.
3.1. Statistical Method
Data analyses were performed using SPSS version 29.0, with a significance level set at P < 0.05. The Shapiro-Wilk test was used to assess the normal distribution of the data. Descriptive statistics are presented as mean ± standard deviation for continuous variables with normal distribution and as median, minimum, and maximum values for those without normal distribution. The independent sample t-test was used to compare measurements between groups with normal distribution, while the Mann-Whitney U test was employed for comparisons of measurements without normal distribution. Multivariate evaluation was conducted using logistic regression analysis. Pearson correlation coefficients were calculated to assess relationships between variables. The sample size for the study was determined using the G*Power 3.1.9.2 program.
4. Results
The average age of the 30 children in the obese group was 12 ± 2.13 years (range: 8 - 16 years), and the average age of the 30 healthy children in the control group was 12 ± 1.81 years (range: 8 - 15 years). The average BMI SDS in the obese group was 2.85 ± 0.50. The mean serum syndecan 1 level in the obese group was 15.65 ± 10.01 ng/mL. Data for the obese children are presented in Table 1.
| Variables | Mean ± SD | Median | Minimum-Maximum |
|---|---|---|---|
| BMI (kg/m2) | 31.40 ± 3.29 | 30.65 | 26.00 - 39.60 |
| BMI SDS | 2.85 ± 0.50 | 2.78 | 2.10 - 3.92 |
| Syndecan 1 (ng/mL) | 15.65 ± 10.01 | 11.91 | 5.08 - 42.63 |
| Urea (mg/L) | 27.43 ± 4.87 | 26.53 | 19.00 - 38.60 |
| Creatinine (mg/dL) | 0.59 ± 0.09 | 0.62 | 0.45 - 0.80 |
| FBG (mg/dL) | 92.43 ± 12.50 | 90.50 | 71.00 - 132.00 |
| AST (U/L) | 25.06 ± 9.98 | 24.00 | 10.00 - 67.00 |
| ALT (U/L) | 20.76 ± 8.99 | 18.00 | 10.00 - 39.00 |
| TG (mg/dL) | 135.80 ± 46.46 | 130.00 | 54.00 - 236.00 |
| HDL -C (mg/dL) | 44.0 ± 9.53 | 43.00 | 30.00 - 61.00 |
| LDL-C (mg/dL) | 99.56 ± 18.41 | 97.00 | 65.00 - 152.00 |
| Insulin (mU/L) | 32.37 ± 13.56 | 29.55 | 12.60 - 74.10 |
| HOMA-IR | 7.28 ± 3.14 | 6.71 | 2.81 - 16.80 |
Abbreviations: BMI SDS, Body Mass Index standard deviation score; HDL -C, high-density lipoprotein cholesterol; LDL-C, low-density lipoprotein cholesterol; AST, aspartate aminotransferase; HOMA-IR, Homeostasis Model Assessment for Insulin Resistance; BMI, Body Mass Index; ALT, alanine aminotransferase; FBG, fasting blood glucose; TG, triglyceride.
In the control group, the average BMI SDS was -0.10 ± 0.52, and the mean serum syndecan 1 level was 6.99 ± 3.79 ng/mL. The data for the control group are shown in Table 2. The mean serum syndecan 1 concentration in obese children was 15.65 ± 10.01 ng/mL, while in the controls, it was 6.99 ± 3.79 ng/mL, which was significantly higher in the obese group compared to the controls (P < 0.001) (Table 3). Additionally, BMI, BMI SDS, creatinine, AST, and ALT levels were significantly different between the control and obese groups (P < 0.05), with higher values in the obese group (Table 3).
| Variables | Mean ± SD | Median | Min-Max |
|---|---|---|---|
| BMI (kg/m2) | 19.25 ± 2.06 | 18.98 | 15.21 - 25.00 |
| BMI SDS | -0.10 ± 0.52 | -0.24 | -0.87 - 0.64 |
| Syndecan 1 (ng/mL) | 6.99 ± 3.79 | 6.26 | 1.39 - 24.47 |
| Urea (mg/L) | 25.37 ± 5.41 | 25.10 | 17.90 - 38.60 |
| Creatinine (mg/dL) | 0.43 ± 0.11 | 0.41 | 0.21 - 0.68 |
| FBG (mg/dL) | 90.40 ± 6.85 | 89.50 | 74.00 - 102.00 |
| AST (U/L) | 19.90 ± 5.24 | 19.00 | 9.00 - 35.00 |
| ALT (U/L) | 13.60 ± 7.16 | 11.50 | 6.00 - 41.00 |
Abbreviations: BMI, Body mass index; ALT, alanine aminotransferase; AST, aspartate aminotransferase; FBG, fasting blood glucose; BMI SDS, Body mass index standard deviation score.
| Variables and Groups | Mean ± SD | Median | Min-Max | P-Value |
|---|---|---|---|---|
| BMI (kg/m2) | < 0.001 a, b | |||
| Control | 19.25 ± 2.06 | 18.98 | 15.21 - 25.00 | |
| Obese | 31.40 ± 3.29 | 30.65 | 26.00 - 39.60 | |
| BMI SDS | < 0.001 a, b | |||
| Control | -0.10 ± 0.52 | -0.24 | - 0.87 - 0.64 | |
| Obese | 2.85 ± 0.50 | 2.78 | 2.10 - 3.92 | |
| Age (y) | 0.746 c | |||
| Control | 11.76 ± 1.81 | 12.00 | 8.00 - 15.00 | |
| Obese | 11.93 ± 2.13 | 12.00 | 8.00 - 16.00 | |
| Syndecan 1 (ng/mL) | < 0.001 a, b | |||
| Control | 6.99 ± 3.79 | 6.26 | 1.39 - 24.47 | |
| Obese | 15.65 ± 10.01 | 11.91 | 5.08 - 42.63 | |
| Urea (mg/L) | 0.127 c | |||
| Control | 25.37 ± 5.41 | 25.10 | 17.90 - 38.60 | |
| Obese | 27.43 ± 4.87 | 26.53 | 19.00 - 38.60 | |
| Creatinine (mg/dL) | < 0.001 b, c | |||
| Control | 0.43 ± 0.11 | 0.41 | 0.21 - 0.68 | |
| Obese | 0.59 ± 0.09 | 0.62 | 0.45 - 0.80 | |
| FBG mg/dL) | 0.894 c | |||
| Control | 90.40 ± 6.85 | 89.50 | 74.00 - 102.00 | |
| Obese | 92.43 ± 12.50 | 90.50 | 71.00 - 132.00 | |
| AST (U/L) | 0.006 a, b | |||
| Control | 19.90 ± 5.24 | 19.00 | 9.00 - 35.00 | |
| Obese | 25.06 ± 9.98 | 24.00 | 10.00 - 67.00 | |
| ALT (U/L) | < 0.001 a, b | |||
| Control | 13.60 ± 7.16 | 11.50 | 6.00 - 41.00 | |
| Obese | 20.76 ± 8.99 | 18.00 | 10.00 - 39.00 |
Abbreviations: FBG, fasting blood glucose; BMI, Body Mass Index; AST, aspartate aminotransferase; BMI SDS, Body Mass Index standard deviation score; ALT, alanine aminotransferase.
a Mann-Whitney U test.
b P < 0.05, statistically significant.
c Independent samples t-test.
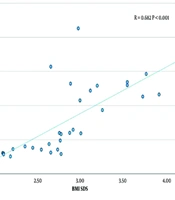
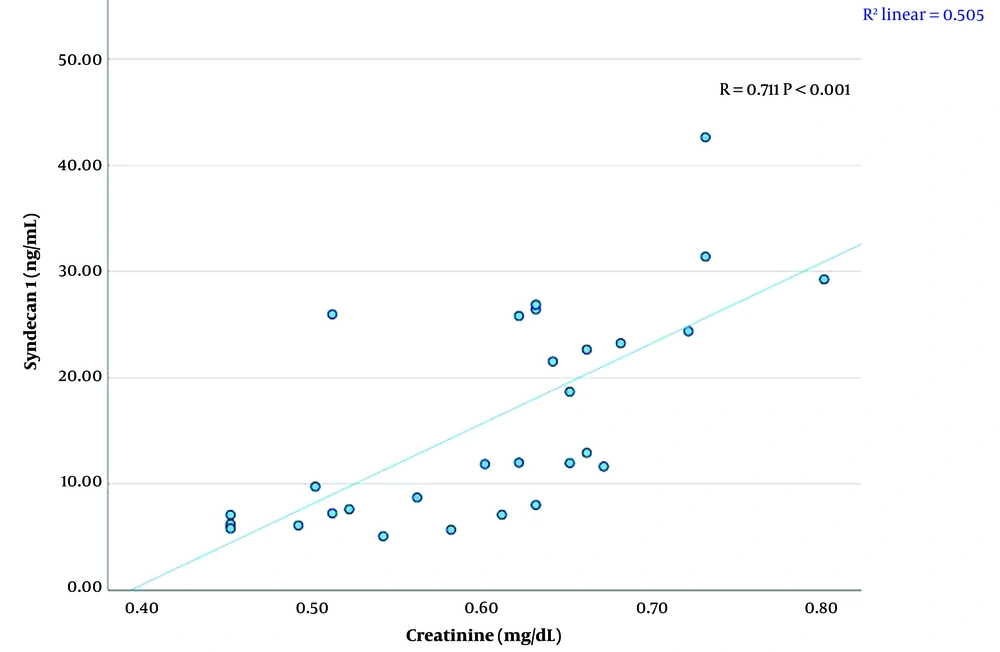
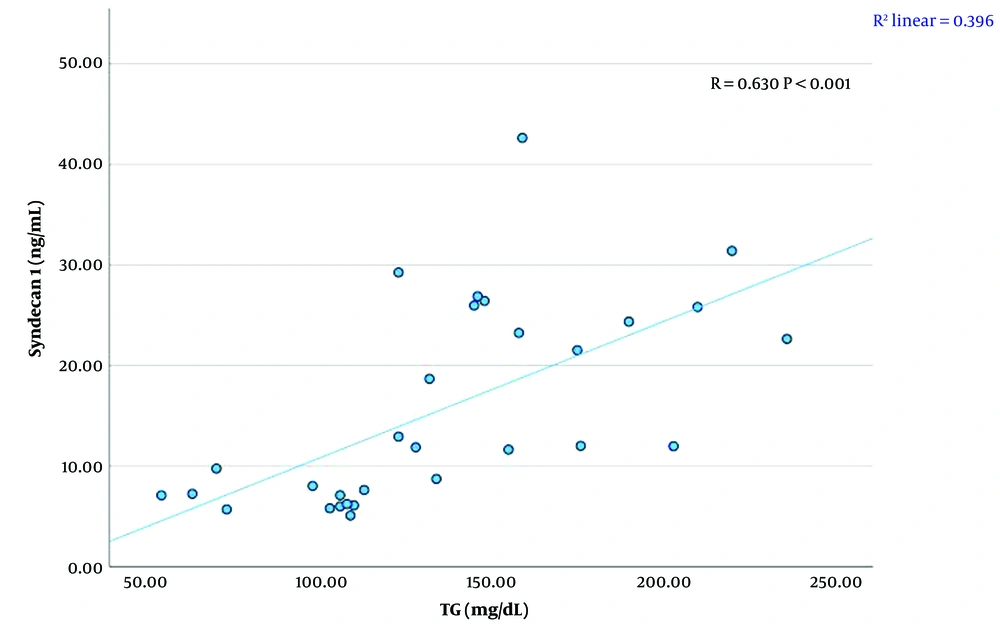
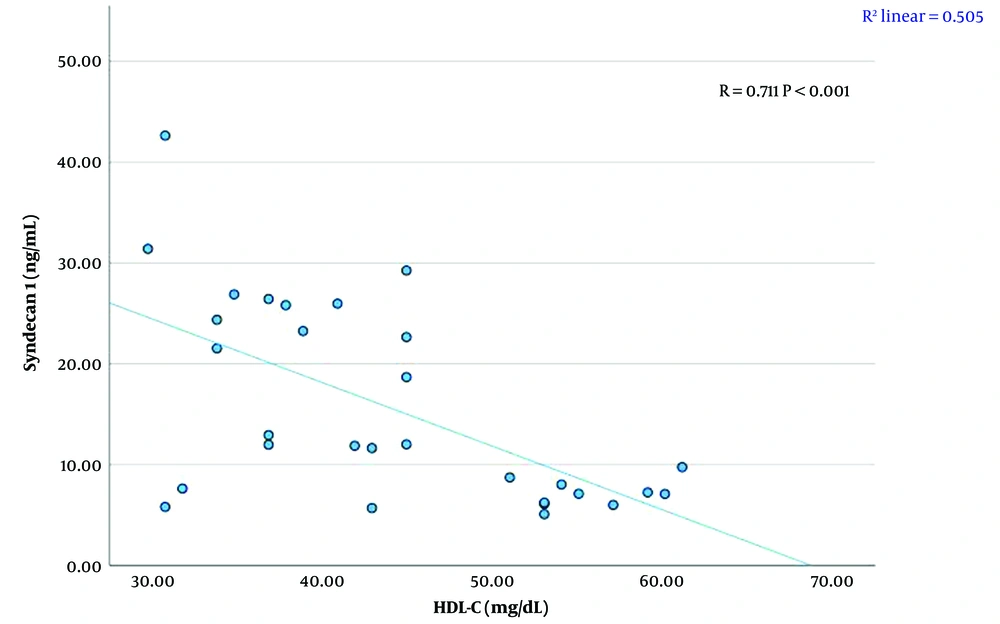
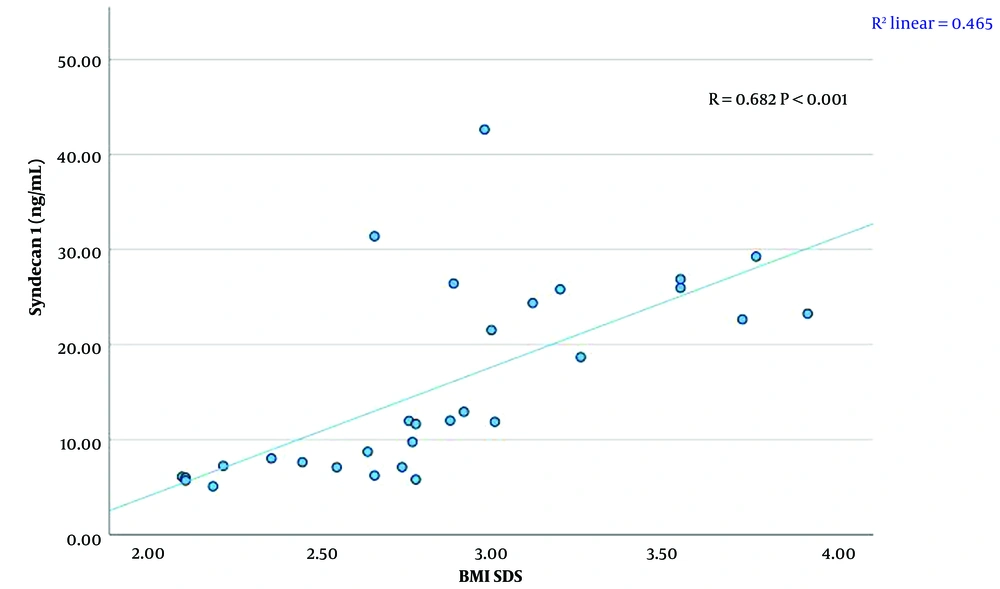
A significant linear relationship was found between syndecan 1 levels and creatinine, TG, HDL-C levels, and BMI SDS (P < 0.01). There was a strong positive correlation between syndecan 1 and creatinine concentrations (r = 0.711, P < 0.001) (Figure 1, Table 4). A moderate positive correlation was observed between syndecan 1 and TG levels (r = 0.630, P < 0.001) (Figure 2, Table 4). Syndecan 1 and HDL-C concentrations showed a strong negative correlation (r = -0.609, P < 0.001) (Figure 3, Table 4). Additionally, a moderately strong positive correlation was seen between syndecan 1 concentrations and BMI SDS (r = 0.682, P < 0.001) (Figure 4, Table 4).
| Variables | Pearson Correlation | P-Value |
|---|---|---|
| Syndecan 1 (ng/mL)-Creatinine (mg/dL) | 0.711 | < 0.001 |
| Syndecan 1 (ng/mL)-TG (mg/dL) | 0.630 | < 0.001 |
| Syndecan 1 (ng/mL)-HDL-C (mg/dL) | -0.609 | < 0.001 |
| Syndecan 1 (ng/mL)-LDL -C (mg/dL) | 0.020 | 0.918 |
| Syndecan 1 (ng/mL)-ALT (U/L) | 0.155 | 0.412 |
| Syndecan 1 (ng/mL)-AST (U/L) | 0.071 | 0.710 |
| Syndecan 1 (ng/mL)-FBG (mg/dL) | 0.139 | 0.463 |
| Syndecan 1 (ng/mL)-Ürea (mg/Ll) | 0.151 | 0.427 |
| Syndecan 1 (ng/mL)-BMI (kg/m2) | 0.338 | 0.068 |
| Syndecan 1 (ng/mL)-BMI SDS | 0.682 | < 0.001 |
| Syndecan 1 (ng/mL)-Insulin (mU/L) | 0.108 | 0.568 |
| Syndecan 1 (ng/mL)-HOMA-IR | 0.116 | 0.541 |
Abbreviations: HOMA-IR, homeostasis model assessment for insulin resistance; TG, triglyceride; LDL-C, low-density lipoprotein cholesterol; FBG, fasting blood glucose; ALT, alanine aminotransferase; HDL-C, high-density lipoprotein cholesterol; AST, aspartate aminotransferase; BMI SDS, Body Mass Index standard deviation score; BMI, Body Mass Index.
No significant linear relationship was found between syndecan 1 concentrations and LDL-C, ALT, AST, glucose, urea, insulin concentrations, or HOMA-IR measurements (P > 0.05) (Table 4).
Linear regression analysis was conducted to examine the relationship between syndecan 1 and statistically significant parameters. The analysis revealed that serum creatinine level and BMI SDS were the statistically significant variables explaining changes in serum syndecan 1 levels (Table 5).
| Variables | Unstandardized Coefficients | Standardized Coefficients | t | Sig. | 95.0% Confidence Interval for B | ||
|---|---|---|---|---|---|---|---|
| B | Std. Error | Beta | Lower Bound | Upper Bound | |||
| Constant | -18.216 | 14.019 | - | -1.299 | 0.206 | -47.088 | 10.655 |
| Creatinine (mg/ dL) | 36.518 | 16.601 | 0.343 | 2.200 | 0.037 | 2.328 | 70.708 |
| TG (mg/ dL) | 0.020 | 0.036 | 0.091 | 0.550 | 0.587 | -0.054 | 0.093 |
| HDL-C (mg/dL) | -0.239 | 0.157 | -0.227 | -1.523 | 0.140 | -0.562 | 0.084 |
| BMI SDS | 6.956 | 2.840 | 0.349 | 2.450 | 0.022 | 1.108 | 12.805 |
Abbreviations: TG, triglyceride; HDL -C, high-density lipoprotein cholesterol; BMI SDS, Body Mass Index standard deviation score.
a Dependent Variable: Syndecan 1 (ng/mL).
5. Discussion
Obesity increases the risk of metabolic disorders such as type 2 diabetes, insulin resistance, and cardiovascular disease. Immune cells involved in regulating chronic low-grade inflammation and adipogenesis include members of the HSPG family. However, the role of syndecan 1, a member of this family, in regulating body fat and glucose homeostasis remains unclear (2). Kasza et al. reported that the loss of syndecan 1 in mice results in reduced subcutaneous fat and increased sensitivity to cold stress. They suggested that syndecan 1 functions as a lipoprotein uptake receptor required for fat cell differentiation in vitro (15). In mice, Jaiswal et al. also demonstrated the critical multisystem and opposing roles of syndecan 1 in the regulation of glucose homeostasis and normal energy balance (2).
There are limited studies evaluating the association between syndecan 1 levels and metabolic parameters in obese children (13). In this study, serum syndecan 1 concentrations were significantly higher in obese children compared to controls. Syndecan 1, the most widely studied member of the syndecan family, is involved in adhesion, cell growth, wound healing, differentiation, and inflammatory processes (16). It has been linked to obesity and chronic low-grade inflammation (17, 18). Body Mass Index is commonly used to describe obesity and its effects on the development of vascular and cardiac complications (19). Inflammation can disrupt the endothelial structure by promoting neutrophil-endothelial cell adhesion through molecules present on endothelial cells and leukocytes (3, 11). Syndecan 1 regulates inflammation and has been linked to elevated leukocyte-endothelial interactions in syndecan 1-deficient mice. While primarily found in the epithelium, syndecan 1 is also expressed in T-cells and other cell types (12). Previous studies on adults have mostly focused on the association of syndecan 1 with type 2 diabetes (3, 4, 11). Obesity, especially central obesity, increases the risk of type 2 diabetes (20). Vascular inflammation and neutrophil infiltration are more prevalent in obese and overweight women and are significantly associated with BMI (21). Wang et al. found a direct relationship between the proportion of neutrophils expressing syndecan 1 and BMI in diabetic patients, which may be due to heightened inflammation in overweight or obese individuals (3). In our study, we found a significant positive correlation between BMI SDS and syndecan 1 levels. This suggests that syndecan 1 levels in obese children are elevated both due to weight gain and low-grade inflammation. Studies have also shown that serum creatinine levels are significantly related to BMI, with BMI being a predictor of increased creatinine levels in children older than ten years (22). We identified a significant positive association between serum syndecan 1 concentrations and serum creatinine levels in obese children. Saboia et al. also demonstrated a significant link between renal function and endothelial damage in obese adolescents. This relationship is further supported by syndecan 1 levels, which have been reported to indicate possible subclinical renal injury and endothelial dysfunction (13). Elevated plasma syndecan 1 and heparan sulfate levels are markers of endothelial glycocalyx disruption, and it has been suggested that these elevated levels may occur during sudden changes in renal function (5).
We also observed a significant positive correlation between serum TG levels and syndecan 1 levels, while a significant negative correlation was found between serum HDL-C levels and syndecan 1 levels in obese children. Syndecan 1 may play a role in regulating lipoprotein metabolism. As coreceptors and membrane receptors, syndecans can undergo endocytosis upon ligand stimulation, and this activity is crucial in lipid metabolism (23). Clinically, serum syndecan 1, the core protein of HSPG in the endothelial glycocalyx, serves as a marker of endothelial damage in individuals with various diseases, such as diabetes, chronic kidney disease, sepsis, hypertriglyceridemia, and cardiovascular disease (24). Endothelial dysfunction is closely related to conditions like atherosclerosis. The endothelial glycocalyx, which coats the inner surface of the vascular endothelium, regulates leukocyte adhesion and prevents leukocytes from sticking to endothelial cells. Damage to the glycocalyx may precede the development of atherosclerosis. As a component of the glycocalyx, syndecan 1 degradation signals endothelial damage. Although the exact mechanism of how syndecan 1 affects lipid profiles in obese individuals is not fully understood, when the glycocalyx is damaged, syndecan 1 is released from the endothelium, increasing its levels in the bloodstream (25).
We found no significant correlations between serum syndecan 1 levels and LDL-C, ALT, AST, glucose, urea, HOMA-IR, or insulin levels in obese children. This finding suggests that elevated serum syndecan 1 levels in obese children are primarily related to early endothelial damage and lipid metabolism dysregulation. The limitations of our study include the lack of data on body composition, a detailed clinical assessment of obesity-related complications, and a small sample size. However, one of the strengths of our study is that it addresses the limited number of studies evaluating serum syndecan 1 levels in obese children, particularly those with obesity, contributing valuable data to the existing literature.
5.1. Conclusions
Syndecan 1 is a key component of the glycocalyx, and its degradation indicates endothelial damage. While most research on syndecan 1 has focused on individuals with type 2 diabetes, our study observed elevated serum syndecan 1 levels in children with obesity. In these children, serum syndecan 1 levels were positively correlated with serum creatinine, TG levels, and BMI SDS, and negatively correlated with HDL-C levels. Therefore, serum syndecan 1 levels may serve as a useful marker for detecting endothelial damage in obese children. Syndecan 1 could potentially be used as an early biomarker to assess obesity-related kidney injury and cardiovascular risk in this population.
