


1. Background
Cardiopulmonary bypass (CPB) is an essential component of most cardiac surgical procedures, ensuring organ perfusion during cardiac arrest. Additionally, CPB allows for the regulation of the patient's core body temperature (1). Hypothermic CPB is employed as a protective strategy to mitigate ischemic-reperfusion injury (I/R injury) by reducing metabolic rates and cellular oxygen consumption during cardiac surgery (2). However, this approach may be associated with complications that could increase postoperative mortality and morbidity. Hypothermic conditions can also contribute to coagulopathy during and after cardiac surgery (3). Conversely, the normothermic CPB strategy has demonstrated certain advantages over the hypothermic systemic perfusion regimen in adults undergoing cardiac surgery (4). Given the ongoing debate regarding the optimal temperature for CPB, some evidence suggests a growing preference for normothermic perfusion strategies in the repair of congenital heart defects (5).
2. Objectives
Therefore, the objective of this study was to analyze and compare the clinical outcomes of pediatric patients undergoing cardiac surgery with normothermic versus moderate hypothermic CPB strategies.
3. Methods
3.1. Study Design and Participants
This study is a single-center, prospective, randomized cohort study. Patients were randomly assigned to receive either a normothermic CPB strategy (35 - 37°C) or a moderate hypothermic CPB strategy (28 - 32°C). The study population consisted of pediatric patients aged between two months and six years. These patients underwent CPB with risk adjustment for congenital heart surgery (RACHS) categories I-II for congenital heart defect surgeries from January 2019 to June 2022 at the Department of Cardiac Surgery, Imam-Reza Hospital, Mashhad, Iran.
Exclusion criteria included RACHS categories higher than II, critical conditions prior to surgery, congenital anomalies of the respiratory system, evidence of cold agglutinins, lack of written informed consent from parents/guardians, and the requirement for deep hypothermic circulatory arrest (18 - 28°C). Drop-out criteria included intraoperative complications and the need for reoperation.
The sample size was determined to be 120 patients, with 60 patients in the moderate hypothermic group and 60 in the normothermic group. This was based on the means of space and the hypothesis of a similar study (6), with a 99% confidence level, 80% power, and weaning time in both groups. An additional 10% was added to account for potential drop-outs.
Block randomization was employed after patients were deemed eligible and informed consent was obtained from their parents. A computer-generated randomization schedule using blocks of four patients was created. The study managers placed group assignments in sequentially numbered envelopes and coordinated the necessary facilities and data collection.
3.2. Perfusion Strategy
Cardiopulmonary bypass was initiated once the activated coagulation time (ACT) exceeded 480 seconds, following the administration of 350 mg/kg of heparin. Cannulation was then performed, and CPB commenced. For myocardial protection, Custodiol® was administered at a dosage of 30 ml/kg following the application of the aortic cross-clamp. The oxygenator used for all patients was the Sorin® (D901 Lilliput 1).
The CPB priming circuit included isotonic saline 0.9% (700 - 800 mL), human albumin (1 g/kg), heparin (1 mg/kg), sodium bicarbonate 7.5% (2 mEq/L as 100 mL of prime solution volume), mannitol (500 mg/kg), and methylprednisolone (30 mg/kg). Non-pulsatile perfusion was recommended throughout the procedure.
For patients in the normothermic group, CPB flow was maintained at 3.5 L/min/m2, while for those in the moderate hypothermic group, it ranged between 2.63 and 3.15 L/min/m2. During CPB, the alpha-stat strategy was employed. The conventional ultrafiltration (CUF) method was utilized for all patients during cardiac surgery.
3.3. Anesthesia Strategy
In the operating room, anesthetic induction was achieved using ketamine (1 - 2 mg/kg), fentanyl (10 - 15 mcg/kg), midazolam (0.1 mg/kg), followed by atracurium (0.2 mg/kg). For anesthesia maintenance, propofol was administered at a rate of 50 - 70 mcg/kg/min, and sufentanil was given at 0.2 - 0.5 mcg/kg. Temperature monitoring for both moderate hypothermia and normothermia was conducted using a nasopharyngeal thermometer.
3.4. Outcomes
Initially, demographic variables such as age, gender, and Body Mass Index (BMI), along with the classification of congenital cardiac defects as cyanotic or acyanotic, and the specific type of cardiac defects were recorded.
The primary endpoints of the study included:
(1) Vasoactive inotropic score (VIS) measured at ICU admission and 24 hours post-ICU entrance.
(2) Duration of mechanical ventilation.
(3) Length of ICU and hospital stay.
The secondary outcomes assessed were:
(1) The CPB time and cross-clamp time.
(2) Renal function tests.
(3) Arterial blood gas (ABG) parameters, including pH, PaO2, PaCO2, and HCO3-, recorded at various time points: Before surgery (T1), before cross-clamp removal (T2), at ICU admission (T3), four hours (T4), and 24 hours (T5) after ICU entrance.
(4) Thoracic blood loss (ml/kg) and blood product transfusion requirements within the first 24 hours post-ICU entrance.
(5) Hematologic laboratory parameters, including white blood cell count (WBC), hemoglobin (Hgb), hematocrit (Hct), platelet count (Plt), prothrombin time (PT), partial thromboplastin time (PTT), and INR, measured before surgery, and at four and 24 hours after ICU entrance.
(6) In-hospital mortality.
3.5. Statistical Methods
Statistical analysis was conducted using SPSS software version 26.0 (Chicago, IL, USA). Quantitative results were presented as mean ± standard deviation (SD) and median. For variables with a normal distribution, the independent Student's t-test was utilized, while the Mann-Whitney test was employed for comparing non-normally distributed quantitative variables. Fisher's exact test and the chi-square test for independence were used to assess the homogeneity of categorical variables between groups. Quantitative variables were compared using either the paired sample t-test or the Wilcoxon test.
To examine the effect of measurement time (as a repeated measure variable) and the interaction between measurement time and categorical group variables, the generalized estimating equation (GEE) method was applied, following verification of the normality of residuals. A significance level of P < 0.05 was considered for all statistical tests.
4. Results
In this study, 120 eligible patients participated, with an equal distribution of 50% in the normothermic group and 50% in the moderate hypothermic group. The mean age of the participants was 18.6 ± 17.6 months. Among all patients, 54.2% were male.
4.1. Baseline Characteristics
A comparison of the demographic variables of the patients is presented in Table 1.
| Variables | Hypothermia Group | Normothermia Group | P-Value |
|---|---|---|---|
| Age (mo) | 19.4 ± 18.3 | 17.8 ± 16.9 | 0.629 |
| BMI | 14.3 ± 2.4 | 14.1 ± 2.7 | 0.667 |
| Gender | < 0.001 b | ||
| Male | 43 (71.7) | 22 (36.7) | |
| Female | 17 (28.3) | 38 (63.3) | |
| Type of surgery | 0.167 | ||
| ASD | 4 (6.7) | 6 (10) | |
| VSD | 28 (46.7) | 36 (60) | |
| TOF | 28 (46.7) | 18 (30) | |
| Cyanotic disorder | 0.624 | ||
| Yes | 11 (18.3) | 9 (15) | |
| No | 49 (81.7) | 51 (85) |
Compares the Baseline Characteristics Between Moderate Hypothermic and Normothermic Group Patients in This Study a
The two treatment groups in this study showed no significant differences in age, BMI, type of surgery, or cyanotic versus acyanotic status (P > 0.05). However, there was a significant difference in gender distribution between the treatment groups (P < 0.001).
4.2. Primary Outcomes
The analysis of primary outcomes revealed that the VIS was significantly lower in patients receiving the normothermic strategy compared to those in the moderate hypothermic group at ICU admission (10.4 ± 3.7 vs. 15.1 ± 3.2, respectively; P < 0.001) and 24 hours after ICU entrance (4.2 ± 3.6 vs. 10.5 ± 2.7, respectively; P < 0.001). The ICU stay was also significantly shorter for patients in the normothermic group (50.5 ± 11.7 hours) compared to the moderate hypothermic group (71.8 ± 21.5 hours; P < 0.001). Additionally, the hospital stay was significantly reduced in the normothermic group (6.7 ± 1.8 days) compared to the moderate hypothermic group (9.4 ± 3.0 days; P < 0.001). Lastly, the weaning time from mechanical ventilation was significantly shorter in the normothermic group (4.8 ± 3.2 hours) compared to the moderate hypothermic group (19.0 ± 11.9 hours; P < 0.001).
4.3. Secondary Outcomes
4.3.1. Cardiopulmonary Bypass Time and Cross-Clamp Time
The analysis of CPB time indicated that the duration was significantly shorter in the normothermic group compared to the moderate hypothermic group (65.1 ± 14.7 minutes vs. 109.6 ± 16.1 minutes, respectively; P < 0.001). However, there were no statistically significant differences in cross-clamp time between the moderate hypothermic group and the normothermic group (52.7 ± 10.4 minutes vs. 49.8 ± 14.8 minutes, respectively; P = 0.089).
4.3.2. Renal Function Test
The analysis of renal function parameters showed no statistically significant differences in blood urea nitrogen (BUN) and creatinine levels at any time point during the study. However, the GFR exhibited a statistically significant difference 24 hours after ICU entrance between patients in the normothermic and moderate hypothermic perfusion strategies (105.30 ± 16.03 vs. 111.52 ± 13.69, respectively; P = 0.024) (Table 2).
| Renal Function Tests and Times b | Normothermic Group | Mild Hypothermic Group | P-Value |
|---|---|---|---|
| BUN | |||
| T1 | 24.62 ± 11.49 | 23.73 ± 7.79 | 0.819 |
| T2 | 25.72 ± 8.27 | 26.38 ± 9.40 | 0.765 |
| T3 | 27.12 ± 7.57 | 29.02 ± 9.23 | 0.220 |
| Serum creatinine | |||
| T1 | 0.41 ± 0.13 | 0.35 ± 0.09 | 0.069 |
| T2 | 0.39 ± 0.10 | 0.36 ± 0.12 | 0.058 |
| T3 | 0.39 ± 0.09 | 0.36 ± 0.11 | 0.112 |
| GFR | |||
| T1 | 104.98 ± 30.71 | 113.07 ± 24.99 | 0.074 |
| T2 | 105.42 ± 19.05 | 110.60 ± 17.13 | 0120 |
| T3 | 105.30 ± 16.03 | 111.52 ± 13.69 | 0.024 c |
Compares the Renal Function Tests During Different Times Between Moderate Hypothermic and Normothermic Group Patients a
4.3.3. Arterial Blood Gas Parameters
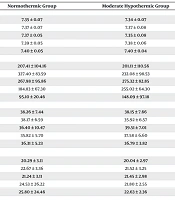
In the evaluation of ABG parameters, the pH range in patients undergoing normothermic CPB was statistically higher than in those in the moderate hypothermic group at ICU admission (7.35 ± 0.05 vs. 7.35 ± 0.08, respectively; P = 0.018). Additionally, PaCO2 levels showed a significant difference between the normothermic and moderate hypothermic groups at ICU admission (36.40 ± 10.47 vs. 39.51 ± 7.01, respectively; P = 0.001). Conversely, PaO2 levels were significantly higher in the moderate hypothermic group compared to the normothermic group at 4 hours post-ICU admission (255.02 ± 64.30 vs. 184.83 ± 67.30, respectively; P < 0.001). Lastly, there were no statistically significant differences in HCO3- values between the moderate hypothermic and normothermic CPB strategies at any time point during the study. Table 3 provides detailed ABG parameters at five different time points.
| ABG Parameters and Times b | Normothermic Group | Moderate Hypothermic Group | P-Value |
|---|---|---|---|
| pH | |||
| T1 | 7.35 ± 0.07 | 7.34 ± 0.07 | 0.250 c |
| T2 | 7.37 ± 0.07 | 7.37 ± 0.08 | 0.459 d |
| T3 | 7.37 ± 0.05 | 7.35 ± 0.08 | 0.018 d, e |
| T4 | 7.39 ± 0.05 | 7.38 ± 0.06 | 0.237 c |
| T5 | 7.40 ± 0.05 | 7.40 ± 0.04 | 0.522 c |
| PaO2 | |||
| T1 | 207.41 ± 104.16 | 201.11 ± 110.56 | 0.749 c |
| T2 | 327.40 ± 83.59 | 232.08 ± 98.53 | 0.751 c |
| T3 | 267.98 ± 95.86 | 275.32 ± 82.85 | 0.125 d |
| T4 | 184.83 ± 67.30 | 255.02 ± 64.30 | < 0.001 c, e |
| T5 | 95.10 ± 20.46 | 148.09 ± 97.18 | 0.070 d |
| PaCO2 | |||
| T1 | 38.26 ± 7.44 | 38.15 ± 7.66 | 0.939 c |
| T2 | 38.17 ± 6.59 | 35.92 ± 6.57 | 0.064 c |
| T3 | 36.40 ± 10.47 | 39.51 ± 7.01 | 0.001 d, e |
| T4 | 35.82 ± 5.70 | 37.58 ± 6.60 | 0.110 d |
| T5 | 36.31 ± 5.23 | 36.79 ± 3.82 | 0.272 d |
| HCO3- | |||
| T1 | 20.29 ± 3.11 | 20.04 ± 2.97 | 0.996 d |
| T2 | 22.67 ± 3.36 | 21.52 ± 3.25 | 0.121 d |
| T3 | 21.24 ± 3.11 | 21.45 ± 2.98 | 0.900 d |
| T4 | 24.53 ± 26.22 | 21.80 ± 2.55 | 0.195 d |
| T5 | 25.80 ± 24.46 | 22.63 ± 2.36 | 0.916 d |
The Arterial Blood Gas Parameters Based on Sampling at Five Different Times in Patients with Normothermic and Moderate Hypothermic Cardiopulmonary Bypass Strategies a
4.3.4. Thoracic Blood Loss and Blood Products Transfusion
The evaluation of blood loss revealed that mean thoracic blood loss was significantly higher in patients who underwent moderate hypothermic CPB compared to those in the normothermic group (2.2 ± 1.2 mL/kg vs. 1.1 ± 1.3 mL/kg, respectively; P < 0.001). Additionally, the requirement for all types of blood products was greater in the moderate hypothermic CPB group than in the normothermic group. This included packed red blood cells (RBC) (7.2 ± 1.4 mL/kg vs. 4.6 ± 1.2 mL/kg, respectively; P < 0.001), cryoprecipitate (5.0 ± 0.4 mL/kg vs. 3.5 ± 0.9 mL/kg, respectively; P < 0.001), and platelets (9.6 ± 1.4 mL/kg vs. 7.3 ± 1.8 mL/kg, respectively; P < 0.001).
4.3.5. Hematologic Laboratory Findings
The analysis of hematologic laboratory findings indicated that the mean WBC count 24 hours after ICU admission was significantly higher in the moderate hypothermic group compared to the normothermic group (15.41 ± 3.90 vs. 13.79 ± 5.07, respectively; P = 0.007). Additionally, 4 hours after ICU entrance, patients in the moderate hypothermic CPB group exhibited higher Hgb levels (13.42 ± 1.70 vs. 12.83 ± 1.70, respectively; P = 0.044) and Hct levels (40.02 ± 4.46 vs. 37.90 ± 4.56, respectively; P = 0.008) than those in the normothermic group.
Furthermore, the GEE analysis demonstrated that the normothermic group had a more significant effect on the trend of Hct variations over time compared to the moderate hypothermic CPB group (P = 0.009). There were no significant differences in Plt between the normothermic and moderate hypothermic groups throughout the study period (P > 0.05).
Regarding coagulation tests, data analysis revealed statistically significant differences in PT, PTT, and international normalized ratio (INR) 24 hours after ICU admission between the moderate hypothermic and normothermic groups (Table 4).
| Coagulation Tests and Times b | Normothermic Groups | Mild Hypothermic Groups | P-Value |
|---|---|---|---|
| PT | |||
| T1 | 13.10 ± 1.53 | 15.60 ± 15.89 | 0.337 |
| T2 | 15.27 ± 2.48 | 15.50 ± 2.07 | 0.581 |
| T3 | 14.16 ± 2.57 | 17.15 ± 15.75 | 0.006 c |
| PTT | |||
| T1 | 31.76 ± 4.41 | 32.44 ± 4.85 | 0.971 |
| T2 | 37.43 ± 15.16 | 37.09 ± 10.00 | 0.635 |
| T3 | 30.62 ± 4.95 | 32.14 ± 5.60 | 0.048 c |
| INR | |||
| T1 | 1.13 ± 0.19 | 1.12 ± 0.15 | 0.928 |
| T2 | 1.39 ± 0.19 | 1.41 ± 0.18 | 0.584 |
| T3 | 1.36 ± 0.20 | 1.44 ± 1.27 | 0.041 c |
Compares the Coagulation Status During Different Times Between Moderate Hypothermic and Normothermic Group Patients a
4.3.6. In-hospital Mortality
During the study period, there were no incidences of in-hospital mortality in either the normothermic or moderate hypothermic groups.
5. Discussion
Systemic hypothermia during CPB is currently prevalent among pediatric cardiovascular surgeons, with many opting to maintain a moderately hypothermic core body temperature during surgery (5, 7). Conversely, the normothermic CPB strategy is widely practiced in adult cardiac surgeries but has been less utilized in pediatrics due to limited strong evidence regarding clinical outcomes in this group (8).
The main finding of our study was the significant reduction in the need for vasopressors and inotropes, as indicated by the VIS, among patients in the normothermic group. Consistent with our findings, several studies (6, 9-11) have demonstrated that the requirement for vasopressors and inotropic agents after ICU admission is lower in the normothermic CPB strategy compared to hypothermic patient groups. However, Caputo et al. reported no statistical differences between normothermic and hypothermic CPB strategies in pediatrics undergoing congenital cardiac defect surgeries (2). Additionally, another study assessing cardiac outcomes after using normothermic and hypothermic cardioplegic solutions in pediatrics found no statistical differences in the use of vasopressors and inotropes post-surgery (P = 0.76) (12).
According to other investigations (6, 13, 14), normothermic systemic perfusion in pediatrics results in reduced cytokine storms following CPB use and offers a protective effect against myocardial reperfusion injury compared to the hypothermic perfusion strategy. Thus, despite the beneficial effects of normothermic systemic perfusion on cellular functions (15), this approach, along with improved myocardial preservation after cardiac surgery, may reduce the risk of low cardiac output syndrome (16) following congenital heart defect surgeries.
The heterogeneity of findings across different studies may be attributed to variations in the evaluation scale used to determine the amount of vasoactive and inotropic agents. In our study, and in all related research, there was a significant reduction in vasopressor and inotropic agents based on VIS, whereas others only reported the number of these agents separately.
Our findings revealed that patients with the normothermic perfusion strategy had significantly shorter ICU and hospital stays compared to the hypothermic group. While the findings of Corno et al. (6) align with our results, the majority of other research (2, 9, 11) reported no statistical differences between hypothermic and normothermic strategies in terms of ICU and hospital stay. Another similar study (17) indicated that hospital stay was not shorter in normothermic groups, with the hypothermic CPB strategy group showing a shorter hospital stay. The differences in study results regarding ICU and hospital stay may be due to the significant variety of surgeries experienced by patients in these studies (2, 9, 11) or the focus on a single type of surgery (17).
The increased mean weaning time from mechanical ventilation in patients who underwent CPB may be due to pulmonary microcirculation dysfunction induced by hypothermia. Additionally, hypothermia-induced immune response activation is considered a leading cause of prolonged mechanical ventilation (9). In our study, the normothermic perfusion technique resulted in shorter mechanical ventilation periods compared to the hypothermic group. Other investigations support our findings (2, 6, 9). However, the study by Aydemir et al. (17) found that the hypothermic group had a significantly shorter mechanical ventilation time than the normothermic group. Meanwhile, Schmitt et al. reported no significant differences between normothermic and hypothermic systemic perfusion groups (11).
Although our results showed that CPB time was significantly longer in the hypothermic strategy compared to normothermic CPB patients, many studies on CPB and cross-clamp time have revealed that pediatric patients undergoing hypothermic perfusion strategy experience longer CPB and cross-clamping times than those in the normothermic group (6, 18). Conversely, Caputo et al. (2) reported that the normothermic group had longer CPB and cross-clamp times in their study. However, their results may be unreliable due to a higher ratio of complex surgeries with RACHS 3 and 4 in the normothermic group, which could have affected the final results.
In our study, the rewarming process was scheduled based on a standard protocol of 0.25°C per hour (19). Additionally, our patients were not weaned from CPB until the temperature difference between the heater-cooler and the patient's core temperature was below five degrees centigrade. This approach justifies the statistical difference in CPB time between the two groups.
There are two paradoxical viewpoints regarding hypothermia during CPB. On one hand, it is hypothesized that induced hypothermia alleviates the systemic inflammatory response syndrome (SIRS) and subsequent cytokine storm following CPB use in cardiac surgery (3). However, the hypothermic circulatory approach prolongs CPB and cross-clamp times, potentially increasing the severity of SIRS (20). Therefore, when considering the effects of hypothermic CPB on inflammatory markers, especially in pediatrics, careful reporting of data is essential.
Cardiac surgery-associated acute kidney injury is a common consequence of cardiac surgery (16). Our study's findings align with other research (5, 14). Although serum creatinine and blood urea parameters remained steady during the measurement times, the GFR parameter was statistically lower in the normothermic group 24 hours after ICU entrance. One unique finding of our study was the reporting of GFR as a renal function test, which has not yet been widely reported as an early renal function outcome marker in pediatric cardiac surgeries. Given the diverse weight range in pediatric patients, we recommend using GFR for renal function evaluation after congenital cardiac surgeries.
In the normothermic situation, there is a balance between tissue perfusion and cell metabolic function (9). We found that ABG parameters in patients with the normothermic CPB strategy were within normal ranges. Although pH levels were statistically different at ICU admission, this may be due to rebound hypothermia affecting tissue metabolism and resulting in metabolic acidosis. Another study supports this theory, with results consistent with our findings (21).
In our study, we used CUF, which may be considered a high-flow, high-Hct CPB strategy that results in renoprotection and favorable outcomes after pediatric cardiac surgery (22). Nevertheless, the mean Hct level in the hypothermic group four hours after ICU admission was statistically higher than in the normothermic group. This may be due to the higher rate of packed red blood cell transfusion in the hypothermic group compared to normothermic patients. Furthermore, this was corroborated by the higher amount of thoracic blood loss followed by a coagulopathy state, which showed significant acceleration in PT, PTT, and INR after cardiac surgery.
This study has limitations, including its single-center design and the lack of diversity in types of surgeries, which limit the generalizability of the findings. Future studies should include precise evaluations with inflammatory marker measurements alongside clinical outcomes to draw practical conclusions for using an optimal strategy in pediatric cardiac surgery.
