1. Background
Sepsis induces lethal effects primarily through excessive activation of a series of proinflammatory, anti-inflammatory, and apoptotic cascades, ultimately resulting in a disruption of physiologic homeostasis, leading to organ dysfunction, shock, and death (1). Beyond diagnosing sepsis, clinicians are also faced with the task of monitoring the patient’s response to therapy toward either resolution of illness or its progression to septic shock, multisystem organ failure and finally death. For all of these reasons, there is a need to develop biomarkers in the field of sepsis in order to supplement clinical assessments and provide information to bear on diagnostic, monitoring and therapeutic decision making, as well as staging of sepsis (2).
Numerous recent studies have focused on procalcitonin (PCT) in infectious diseases diagnosis and prognosis, but its significance is still under debate (3). Procalcitonin has been proposed as a specific biomarker of bacterial infections and has been related to the severity of sepsis (4). PCT has been widely studied in patients with pneumonia as a biomarker to reduce the duration of antibiotic treatment (5, 6), but no studies have investigated its kinetics behavior specifically in pediatric patients with multiorgan dysfunction syndrome (MODS).
Should a potential diagnostic marker be used in a clinical setting it is necessary to describe its behavior under given conditions. In our study this means to describe changes in procalcitonin blood levels over time and diagnostic characteristics of this marker.
2. Objectives
The first objective of our study was an analysis of PCT levels kinetics in patients with SIRS, sepsis and multi organ dysfunction syndrome during a 5-day period after admission. The second objective was to determine optimal cut-off value and quantify diagnostic characteristics of PCT between controls and patients with various septic conditions.
3. Patients and Methods
Our prospective observational study took place in the period from June 2009 to March 2011. The study protocol and informed consent were approved by the Ethics committee of the University Hospital, Brno. Parents provided informed written consent for their children to participate in this trial. Data were collected and analyzed from sixty-two consecutive patients with SIRS or septic state who were admitted to the Department of Anesthesia and Intensive Care of the University Children´s Hospital Brno, Czech Republic. The most common sources of infection that led to sepsis were the lungs – bacterial and viral infections, and central nervous system – bacterial infections of the brain. Infections, sepsis, severe sepsis, septic shock and multiple organ dysfunction syndromes were defined according to commonly used criteria by International Pediatric Sepsis Consensus Conference (7). The criteria for adult SIRS were modified for pediatric use. Age-specific normal values of vital signs and laboratory data were incorporated into the definitions of SIRS. Sepsis was defined as SIRS associated with suspected or proven infection (7). Patients were categorized into five groups according to their clinical data and to the described definitions: a) SIRS, b) sepsis, c) severe sepsis, d) septic shock, e) MODS. In these groups, we compared the difference in the levels of PCT. The samples from 70 children undergoing elective surgery were used as controls (strabismus surgery, umbilical and inguinal hernia repair), i.e. samples from patients without signs of infection. Patient data were recorded at the time of diagnosis o SIRS or septic state and consisted of age, sex, pediatric logistic organ dysfunction score (PELOD) score and length of hospitalization. PELOD score is a tool which is used to characterize the severity of organ dysfunction in critically ill children. Score which is given to each organ will increase according to the severity of organ dysfunction, so PELOD score can be used to predict severity of organ dysfunction. The PELOD scoring system consists of physical and laboratory variables representing 6 organs, namely nervous, cardiovascular, renal, respiratory, hematologic, and hepatic system (8). PELOD score twelve was chosen as the median of the whole set. Specimens for the diagnosis of infection were obtained at admission. Complete medical history and clinical examination, laboratory parameters, and disease-specific examinations were evaluated. Blood samples were obtained from a central venous catheter during the first 12 h after the diagnosis of SIRS or septic state, or before the beginning of surgery in the control group. PCT was measured by an immunoluminometric assay (Lumitest-PCT, Brahms-Diagnostica, Berlin, Germany). The threshold of detection of PCT defined by our laboratory is 0.1 ng/mL. Values of PCT levels >0.5 ng/mL were considered as abnormal. The laboratory technicians performing the assays were completely blinded to the clinical information.
3.1. Statistical Analysis
Demographic characteristics and baseline data were summarized using descriptive statistics. PCT values were logarithmically transformed in order to achieve an approximately normal distribution of the data. Differences of PCT levels between groups over the 5-day period were analyzed using analysis of variance (ANOVA). A compound symmetry covariance matrix was adopted in order to account for within patient correlation (repeatedly measured ANOVA). Results were plotted as mean structure (mean model) profile plots so that the dynamics of PCT could be easily assessed. Significance levels of mean and interaction effects were considered for interpretation. Group comparison for the above mentioned analysis was done only between septic or mortality groups, not the controls, where serial data were available. Receiver operating characteristic (ROC) analysis was performed in order to find out optimal cut-off values of PCT utilizing Day 1, Day 3 and Day 5 values. Corresponding diagnostic characteristics (sensitivity and specificity, area under curve) were given. Level of significance was considered P < 0.05.
4. Results
The study included sixty-two patients whose characteristics are listed in Table 1. Six patients died within 28 days after admission. PCT values during the 5-day period analyzed are given in Table 2. Analysis of PCT revealed that its levels were mildly decreased during the evaluated 5-day period. This conclusion could be made with respect to the ANOVA results with non-significant time effects.
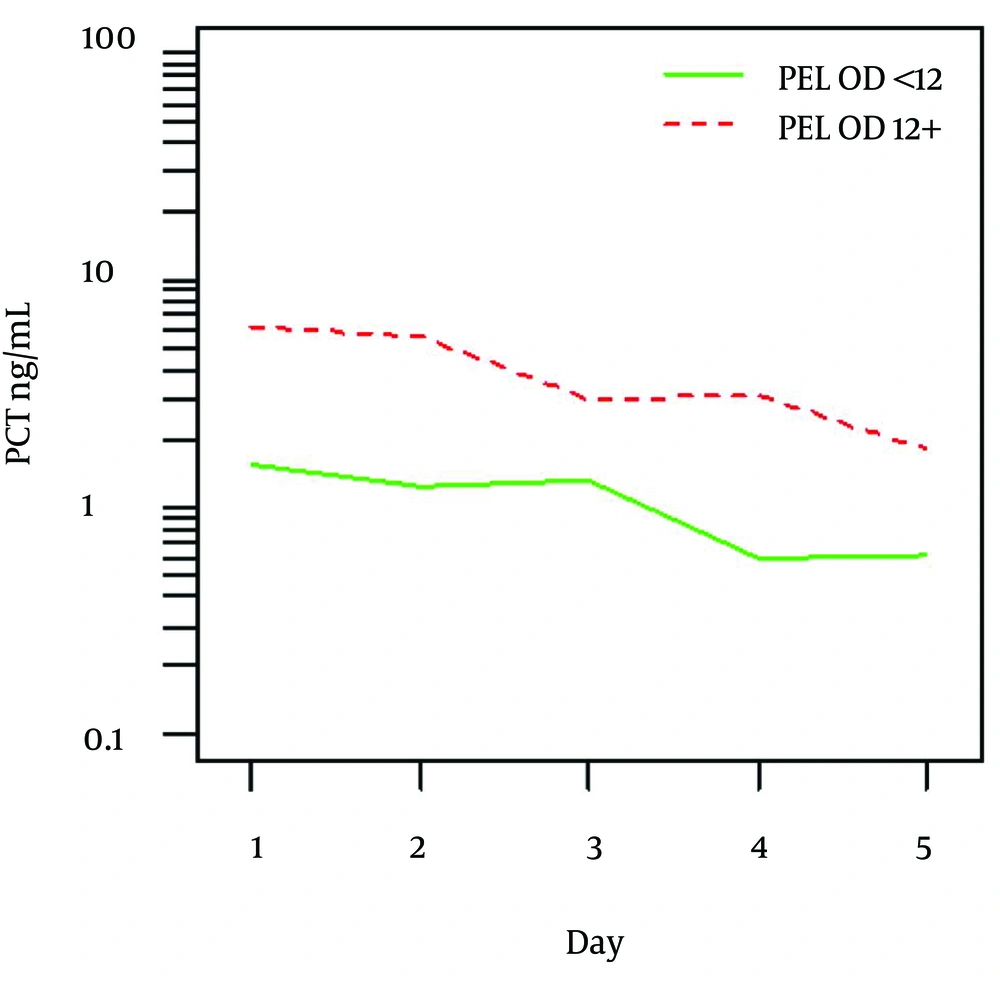
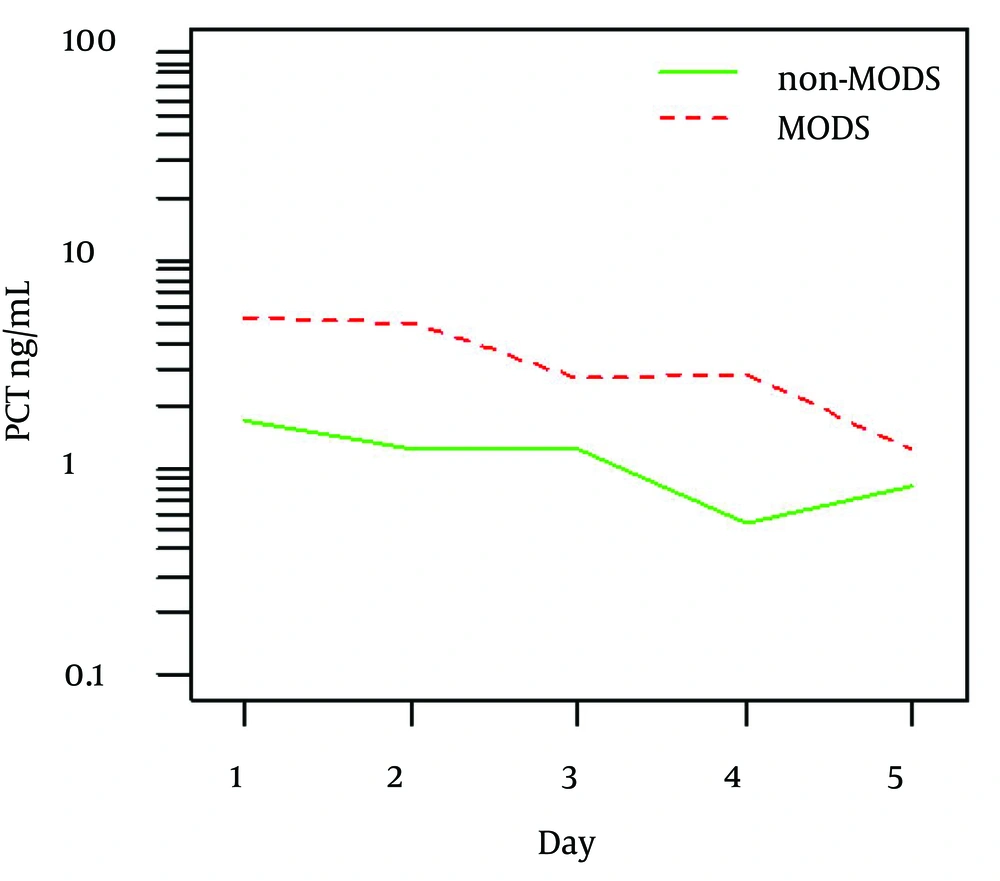
Overall higher values of PCT were identified in patients with PELOD score 12 and more compared to those with PELOD < 12 (P = 0.016). Figure 1 shows mean values and detail summary statistics is given in respective Table 3. Similarly, higher PCT values were found in patients who developed MODS in contrast to those without MODS (P = 0.011).
Figure 2 shows mean values and detail summary statistics is given in Table 4. However, diagnostic characteristics of PCT levels in differentiating MODS and non-MODS did not prove to be useful in ROC analysis (AUC = 0.696, P = 0.081).
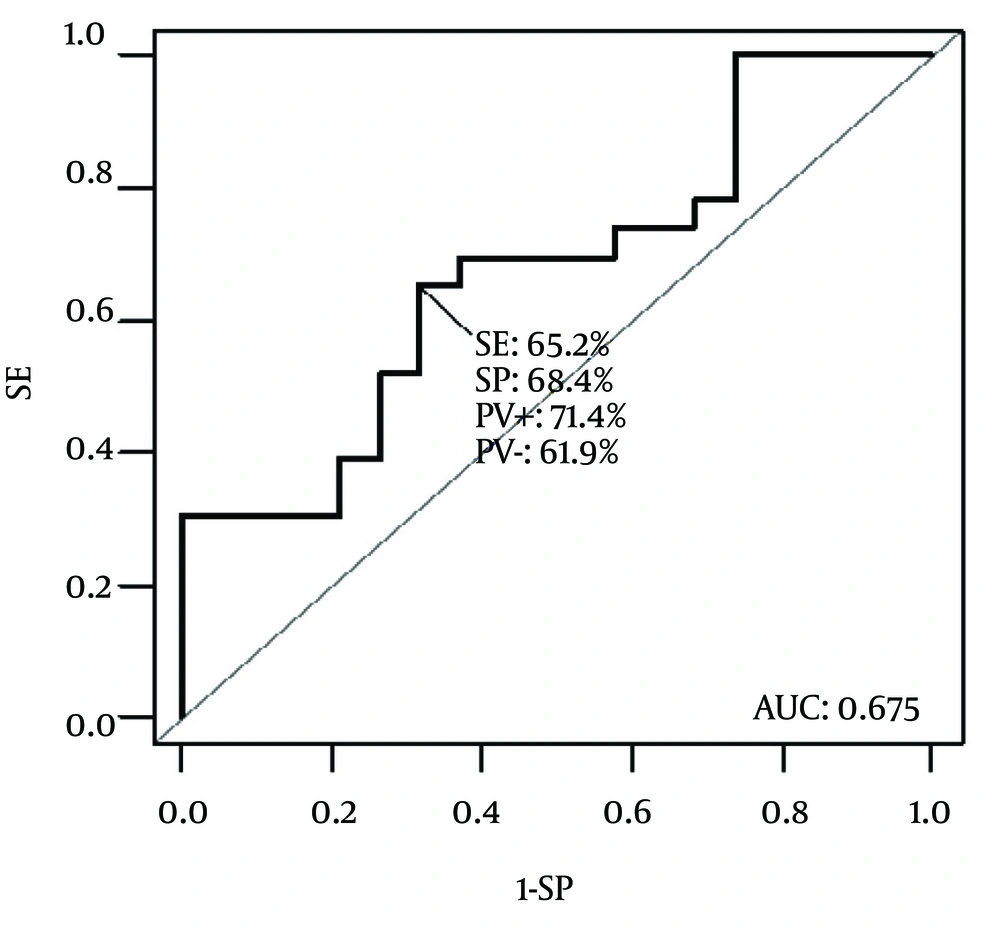
With the knowledge of PCT behavior, ROC analysis was performed using Day 1, Day 3 and Day 5 values of PCT. Comparison was made between significantly different groups of patients from the former analysis (PELOD score or those developing MODS ) as well as between the whole sample and controls. Significantly discriminating characteristics of PCT was found between PELOD groups of patients (Figure 3).
According to ROC analysis, cut-off value of 4.05 ng/mL was found to best discriminate patients with PELOD < 12 and PELOD ≥ 12 with AUC = 0.675 (P = 0.035) with sensitivity 65.2% and specificity 68.4%. No other differences in PCT levels could be identified between various septic conditions, mortality or duration of the hospital stay.
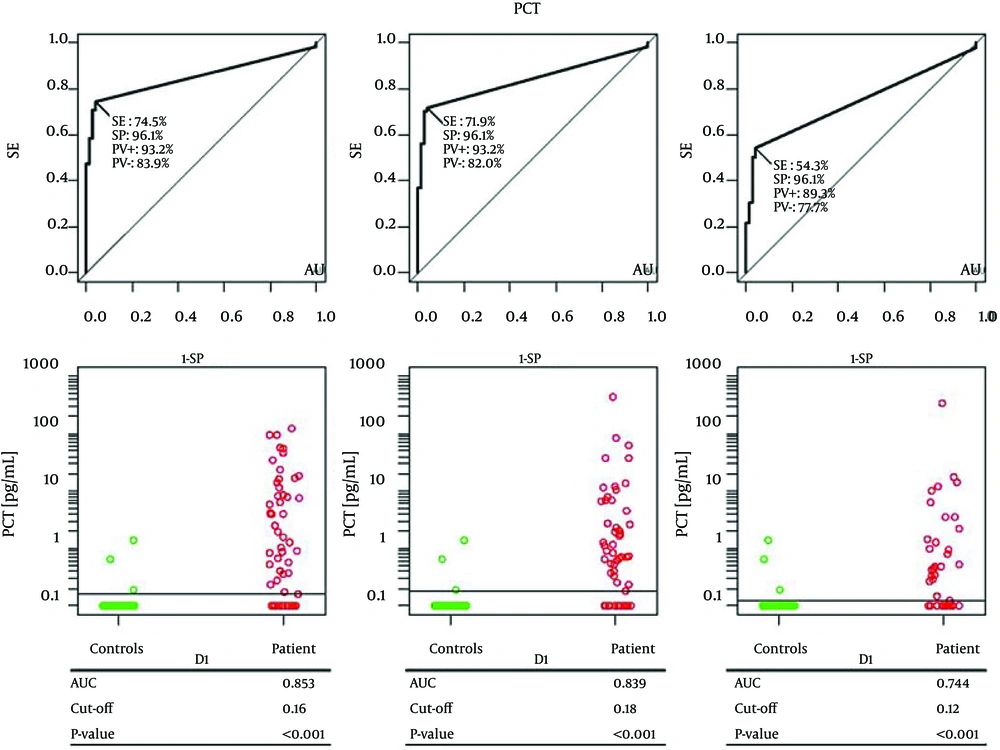
Finally an ROC analysis of PCT levels with comparison between all patients and controls was performed (Figure 4). PCT levels from controls were compared with those on D1, D3 and D5 in all patients. PCT could significantly differentiate controls from patients on D1 (cut-off 0.16 ng/mL, AUC = 0.853, SE = 74.5%, SP = 96.1%, P < 0.001), on D3 (cut-off 0.18 ng/mL, AUC = 0.839, SE = 71.9%, SP = 96.1%, P < 0.001) and on D5 (cut-off 0.12 ng/mL, AUC = 0.744, SE = 54.3.6%, SP = 96.1%, P < 0.001).
| Survivals (n = 56) | Non-survivals (n = 6) | All (n = 62) | |
|---|---|---|---|
| 67.1 ± 72.7 | 96.8 ± 76.1 | 70.0 ± 72.9 | |
| 21.6 ± 27.1 | 22.2 ± 21.8 | 21.7 ± 26.5 | |
| Female | 22 (39.3) | 4 (66.7) | 26 (41.9) |
| Male | 34 (60.7) | 2 (33.3) | 36 (58.1) |
| SIRS | 13 (23.2) | 1 (16.7) | 14 (22.6) |
| Sepsis | 3 (5.4) | 0 (0) | 3 (4.8) |
| Severe sepsis | 17 (30.4) | 0 (0) | 17 (27.4) |
| Septic shock | 23 (41.1) | 5 (83.3) | 28 (45.2) |
| No | 31 (55.4) | 1 (16.7) | 32 (51.6) |
| Yes | 25 (44.6) | 5 (83.3) | 30 (48.4) |
| 11.0 (1.0-61.0) | 26.0 (11.0-41.0) | 11.5 (1.0-61.0) | |
| 10.0 (1.0-53.0) | 7.5 (1.0-19.0) | 10.0 (1.0-53.0) |
| Day | Number | Mean ± SD | Median (min-max) |
|---|---|---|---|
| 62 | 16.27 ± 28.793 | 4.07 (0.02-120.95) | |
| 62 | 15.58 ± 34.257 | 2.67 (0.02-185.60) | |
| 61 | 18.38 ± 68.975 | 1.45 (0.01-440.99) | |
| 55 | 23.82 ± 87.102 | 1.00 (0.00-487.86) | |
| 49 | 16.24 ± 66.976 | 0.88 (0.00-343.77) |
Summary Statistics of PCT Levels During Evaluated 5-day Period
| Day | PELOD < 12 | P = 0.016 | PELOD 12+ | |||
|---|---|---|---|---|---|---|
| Number | Mean ± SD | Median (min-max) | number | Mean ± SD | Median (min-max) | |
| 32 | 5.51 ± 7.504 | 1.55 (0.02 - 23.34) | 30 | 25.16 ± 36.282 | 7.46 (0.36 - 120.95) | |
| 34 | 4.17± 6.583 | 0.99 (0.02 - 23.34) | 28 | 25.96 ± 44.889 | 4.51 (0.31 - 185.60) | |
| 34 | 5.94±14.170 | 1.12 (0.01 - 62.13) | 27 | 28.66 ± 91.967 | 2.34 (0.18 - 440.99) | |
| 30 | 3.47±7.660 | 0.42 (0.00 - 31.03) | 25 | 41.12 ± 116.790 | 1.91 (0.16 - 487.86) | |
| 28 | 2.35±3.610 | 0.66 (0.00 - 12.23) | 21 | 28.15 ± 91.019 | 0.97 (0.15 - 343.77) | |
| Day | non-MODS | P = 0.011 | MODS | |||
|---|---|---|---|---|---|---|
| Number | Mean ± SD | Median (min-max) | Number | Mean ± SD | Median (min-max) | |
| 32 | 10.85 ± 25.586 | 0.90 (0.16-96.32) | 30 | 19.95 ± 30.739 | 7.96 (0.02-120.95) | |
| 34 | 11.87 ± 43.392 | 0.95 (0.16-185.60) | 28 | 18.37 ± 26.103 | 6.79 (0.02-96.81) | |
| 34 | 6.66 ± 20.987 | 0.92 (0.25-85.12) | 27 | 25.60 ± 86.000 | 2.29 (0.01-440.99) | |
| 30 | 2.73 ±8.500 | 0.40 (0.13-33.41) | 25 | 38.20 ±111.460 | 3.14 (0.00-487.86) | |
| 28 | 2.99 ± 6.314 | 0.52 (0.15-17.28) | 21 | 21.12 ±78.253 | 0.99 (0.00-343.77) | |
Summary Statistics of PCT Levels in Patients With and Without MODS
5. Discussion
Although some papers have been published emphasizing the importance of measuring kinetics rather than just absolute values (3, 9), this is a study focusing exclusively on pediatric patients with sepsis and MODS. Our results imply that PCT levels could not differentiate between various septic conditions in patients until a marked organ dysfunction develops. This conclusion could be made considering significantly higher and discriminating PCT levels in patients with MODS on one hand or high PELOD score on the other. Although significant diagnostic characteristics could be found in PELOD groups discrimination, the association is still weak for clinical utilization (AUC = 0.675). Difference between conclusions made with respect to ANOVA results and those from ROC analysis could be noticed. Significant difference of PCT between MODS and non-MODS patients was in contrast with non-significant result of PCT discriminating characteristic from ROC analysis. This finding may not be surprising because ANOVA analysis should be more sensitive (utilizing information from the whole 5-day period) in detecting smaller differences (higher power). A noticed difference in PCT levels kinetics in survivors and non-survivors was not consistent with other findings. This finding could be biased due to early drop-out of non-survivors.
Studies focusing on PCT kinetics values to predict patient’s outcome in children’s sepsis are sparse. Hatherill et al. studied PCT in 75 children with septic shock and determined that children with higher PCT levels at admission ultimately had worse organ failure and lower survival rate. When serum PCT levels were trended over several days they observed that children whose levels of PCT remained elevated were at much greater risk of severe disease and death than those whose levels dropped in response to therapy (10).
With specific regard to separating sepsis from SIRS, multiple studies have demonstrated the diagnostic superiority of PCT (11, 12). Arkader et al. demonstrated that in children with sepsis, serum PCT concentration was significantly elevated above that of non-infected children with SIRS following cardiopulmonary bypass (AUC: 0.99). In this setting, however, CRP could not distinguish the two states (AUC: 0.54) (11). Our study did not confirm this finding. Procalcitonin was significantly increased only in MODS. McMaster et al. showed similar postoperative PCT kinetics, but also demonstrated that children who developed local infections, suspected sepsis and confirmed sepsis had increasing PCT levels that were statistically significant (AUC: 0.84). CRP in this setting was a poor marker of infection and sepsis (AUC: 0.62) (12).
In adult patients the prognostic value based on the evolution of PCT levels may be more useful than the individual evaluation of initial PCT levels. In patients with sepsis secondary to ventilator-associated pneumonia (VAP), community acquired pneumonia (CAP) or bloodstream infection, reductions in PCT concentrations above 30% between days 2 and 3 are considered an independent predictor of survival, with an odds ratio of 2.9 (13). Jung et al. reported that at admission, PCT absolute value might be an indicator of treatment failure but PCT decrease of at least 80% from the peak or its kinetic from admission to day 5 could not predict accurately treatment response. This has been shown in the homogenous group with all patients presenting a septic shock related to an intra-abdominal infection (14). Interesting is the study investigating PCT clearance (PCT-c) specifically in patients with septic shock and multiorgan dysfunction. PCT-c is an innovative concept that reflects PCT dynamics. A positive value indicates a decrease or clearance of PCT and a negative value shows an increase in PCT and persistence of its synthesis and release. In this study, PCT-c increased progressively in surviving patients but decreased in non-survivors with significant differences at 24 and 48 hours. PCT-c 48 hours was the value that best identified the favorable evolution of septic shock patients; a PCT-c 48 hours higher than 50% had a negative predictive value of 91% (15). Several limitations of our study have to be mentioned. The first and most important is the relative small sample size. The small sample size of our study could have made difficult the estimation of the AUC value with a correct accuracy - in particular, for consideration of the mortality. Secondly, this is a prospective study of consecutive patients at a single center. Any generalization of our data should therefore be cautious. The large prospective multicenter studies are necessary to confirm our results. Finally, it is worth noting that PCT daily measurement costs could compromise the translation of our findings into the clinical practice. We suggest that PCT serum levels and PCT kinetics could serve as early and accurate markers for the diagnosis and prognosis of MODS in the pediatric ICU setting, associated with clinical findings. The possibility that PCT plays a supporting role in fuelling the process of multiple organ failure should add impetus to further investigation into the origin, mechanism of production, and mode of action of this molecule.


