1. Introduction
Congenital hypothyroidism (CH) is one of the most common endocrine diseases and it also is one of the major causes of preventable and treatable physical and mental disabilities all around the world (1, 2). Thyroid hormones have a key role in fetal nervous system development and infant physical growth (3, 4). If untreated, hypothyroidism can cause retardation in physical growth, development, and it may lead to a delay or failure in the growth of the body (5, 6). Since these disorders are often unknown, continuous follow-up of the children with CH to assess the pattern of growth in height, weight, and head circumference, seems to be essential and is amongst health priorities (7-11). On the other hand, blood parameters (T4 and TSH) should be controlled on regular intervals by the physician in order to avoid complications and ensure the mental development of children with CH. In abnormal cases, treatment should be started to restore the values of these indexes within the normal range (12, 13). Because of the importance of the disease, nowadays, routine thyroid screening, utilizing hormone estimation, is done at birth in many countries. Considering the results of the thyroid screening program, the estimated prevalence of CH in countries with established programs is between 1/3000 and 1/4000. The prevalence of the disease is reported between 1/1400 and 1/2000 in several Middle East countries (14), while its prevalence in Iran is about 1 in 1000 births (15). In Yazd, the incidence of CH was found to be 1:1608 with a female to male ratio of 0.69:1 (16).
Various studies on the growth patterns of children with hypothyroidism in China, France, Spain, Canada and other countries revealed contrasting results. However, only one study on growth patterns in children with CH was done in Iran (17). The present study aimed to evaluate the physical growth patterns (height, weight, head circumference) and blood levels of T4 and thyroid stimulating hormone (TSH) during the first five years of life in CH children in Yazd city.
2. Methods
This retrospective cohort study was conducted on all infants diagnosed with CH by the neonatal thyroid screening program in Yazd. All infants diagnosed with hypothyroidism during the years 2006 to 2008 were selected considering the study inclusion and exclusion criteria. The growth pattern of the patients in the first five years of life were compared and contrasted in terms of age and gender with growth pattern of the first five years of healthy children reported by the national center for health statistics of the United States (NCHS).
Children with thyroid stimulating hormone (TSH) > 10 (mu/L) or T4 < 6.5 (µg/dL) were diagnosed as hypothyroidism and 25 - 50 microgram of thyroxin was started. Inclusion criteria were, diagnosis of CH, residing in Yazd, diagnosed by neonatal thyroid screening program, referred to Akbari health center and lack of other congenital disorders at the same time. Residents of cities other than Yazd and also neonates with other congenital abnormality and intra uterine growth retardation (IUGR) were excluded. By reviewing the family and neonatal care files, anthropometric parameters (height, weight and head circumference) were collected and recorded in a data collection form. The height and weight of the children over five years old and the head circumference of children over two years old were assessed. These parameters were checked in intervals of three months for infants up to one-year-old, intervals of six months for children aged less than two years, and annually for those more than two years old. In summary, each participant was tested 10 times for weight and height and 7 times for head circumference.
To compare growth patterns of the children with CH with those of healthy children reported by the NCHS, fifth, twenty-fifth, fiftieth, seventy-fifth and ninety-fifth percentiles of variables including height, weight and head circumference were assessed considering age and gender in the two groups. The growth patterns of these parameters were mapped using the Excel software.
In the second phase of this study, the effectiveness of therapeutic intervention on the normality of serum T4 and TSH levels in children with CH were evaluated. The following methods were used to fulfill this purpose:
Method one: the mean serum T4 and TSH levels in children with CH were considered throughout the study. Then, using the repeated measure test, changes in serum T4 and TSH levels of participants from the first to tenth intervention were evaluated.
Method two: calculating the frequency of the number of children whose serum TSH and T4 levels reached a normal range from the first to 10th intervention.
The collected data were analyzed using 22nd version of SPSS software. Repeated Measure test was used to compare the data.
3. Results
The total number of the CH patients selected for the study was 55, of which 21 (38%) were females and 34 (62%) males. The results are shown in Tables 1 - 3. Moreover, to compare the growth patterns, the diagrams of weight, height, and head circumference considering age and gender of cases is plotted in Figures 1 - 3.
| Percentiles | ||||||||||
|---|---|---|---|---|---|---|---|---|---|---|
| Age, mo | 5 | 25 | 50 | 75 | 95 | |||||
| Female | Male | Female | Male | Female | Male | Female | Male | Female | Male | |
| Birth CHNCHS | 42.3 (45.4) | 44.5 (46.4) | 48 (48.2) | 50 (49) | 51 (49.9) | 52 (50.5) | 52 (51) | 53 (51.8) | 53.9 (52.9) | 55.2 (54.4) |
| 3 months CHNCHS | 52.1 (55.4) | 51 (56.7) | 57.5 (57.8) | 56 (59.4) | 60 (59.5) | 60 (61.1) | 61 (61.2) | 61.2 (63) | 62.9 (63.4) | 63.5 (65.4) |
| 6 months CHNCHS | 59.3 (61.8) | 56 (63.4) | 63 (64.2) | 63 (66.1) | 65 (65.9) | 65 (67.8) | 68 (67.8) | 68.2 (69.7) | 70.9 (70.2) | 71.2 (72.3) |
| 9 months CH NCHS | 64.3 (66.1) | 60 (68) | 68 (68.7) | 66.7 (70.6) | 70 (70.4) | 70 (72.3) | 72 (72.4) | 73 (74) | 73.9 (75) | 75.5 (77.1) |
| 12 months CHNCHS | 68.3 (69.8) | 64.8 (71.7) | 72 (72.4) | 70 (74.3) | 73 (74.3) | 74.5 (76.1) | 76 (76.3) | 77 (77.7) | 78.9 (79.1) | 82.7 (81.2) |
| 18 months CHNCHS | 74.2 (76) | 70.8 (77.5) | 78 (78.8) | 77 (80.5) | 80 (80.9) | 80 (82.4) | 81 (83) | 83 (84.3) | 85.9 (86.1) | 87.5 (88.1) |
| 24 months CHNCHS | 79.2 (81.3) | 76.5 (82.3) | 83 (84.2) | 83.8 (85.6) | 85 (86.5) | 85 (87.6) | 88 (88.7) | 88.3 (89.9) | 95.5 (92) | 95.8 (92.2) |
| 36 months CHNCHS | 84.2 (90) | 85.8 (91.6) | 89 (93.1) | 90 (94.2) | 93 (95.6) | 93 (96.5) | 96 (96.1) | 96 (98.9) | 101.8 (101.5) | 107 (103.1) |
| 48 months CHNCHS | 88.5 (95) | 92.5 (95.8) | 95.5 (98.8) | 97 (100) | 100 (101.6) | 100.5 (102.9) | 104 (104.3) | 105 (105.8) | 111.5 (108.3) | 115.8 (108.2) |
| 60 months CHNCHS | 95.4 (101.1) | 99 (102) | 101 (105.4) | 104.8 (106.5) | 107 (108.4) | 107.5 (109.9) | 111.5 (111.4) | 110 (112.8) | 124 (115.6) | 121.2 (117) |
| Percentiles | ||||||||||
|---|---|---|---|---|---|---|---|---|---|---|
| Age, mo | 5 | 25 | 50 | 75 | 95 | |||||
| Female | Male | Female | Male | Female | Male | Female | Male | Female | Male | |
| Birth CH NCHS | 2.73 (2.36) | 1.57 (2.54) | 3.10 (2.93) | 2.57 (3.00) | 3.26 (3.23) | 3.20 (3.27) | 3.57 (3.52) | 3.70 (3.64) | 4.61 (3.81) | 3.95 (4.15) |
| 3 months CH NCHS | 3.91 (4.18) | 3.87 (4.43) | 5.40 (4.88) | 4.79 (5.32) | 5.85 (5.40) | 6.00 (5.98) | 6.17 (5.90) | 6.50 (6.56) | 7.48 (6.74) | 7.10 (7.37) |
| 6 months CH NCHS | 6.31 (5.79) | 5.10 (6.20) | 7.00 (6.60) | 6.40 (7.20) | 7.60 (7.21) | 7.25 (7.85) | 7.90 (7.83) | 8.00 (8.49) | 9.30 (8.73) | 8.52 (9.46) |
| 9 months CH NCHS | 7.41 (7.00) | 6.12 (7.52) | 8.00 (7.89) | 7.52 (8.56) | 8.50 (8.56) | 8.50 (9.18) | 9.05 (9.24) | 9.00 (9.88) | 10.20 (10.17) | 9.50 (10.93) |
| 12 months CH NCHS | 8.02 (7.84) | 6.42 (8.43) | 8.50 (8.81) | 8.17 (9.49) | 9.30 (9.53) | 9.45 (10.15) | 10.50 (10.23) | 10.00 (10.91) | 11.77 (11.24) | 10.95 (11.99) |
| 18 months CH NCHS | 9.02 (8.92) | 7.82 (9.59) | 9.95 (10.04) | 9.47 (10.67) | 10.90 (10.82) | 10.70 (11.47) | 12.00 (11.56) | 11.42 (12.31) | 13.95 (12.76) | 12.52 (13.44) |
| 24 months CH NCHS | 9.59 (9.87) | 8.90 (10.54) | 11.30 (11.10) | 10.50 (11.65) | 12.30 (11.90) | 12.15 (12.59) | 13.85 (12.74) | 12.85 (13.44) | 14.50 (14.08) | 14.17 (14.70) |
| 36 months CH NCHS | 10.58 (11.60) | 10.00 (12.26) | 13.05(12.99) | 12.00(13.58) | 13.90(13.93) | 13.90(14.69) | 15.50 (15.03) | 14.85 (15.59) | 18.70 (16.54) | 16.25 (17.28) |
| 48 months CH NCHS | 12.02 (13.11) | 11.77 (13.64) | 14.90 (14.80) | 13.97 (15.39) | 15.90 (15.98) | 15.40 (16.69) | 17.10 (17.56) | 17.00 (17.99) | 20.79 (19.91) | 18.70 (20.27) |
| 60 months CH NCHS | 14.50 (14.56) | 13.07 (15.27) | 16.45 (16.29) | 15.90 (17.22) | 17.20 (17.66) | 17.35 (18.67) | 18.80 (19.39) | 19.00 (20.14) | 21.87 (22.62) | 22.12 (23.09) |
| Percentiles | ||||||||||
|---|---|---|---|---|---|---|---|---|---|---|
| Age, mo | 5 | 25 | 50 | 75 | 95 | |||||
| Female | Male | Female | Male | Female | Male | Female | Male | Female | Male | |
| Birth | 2.73 (2.36) | 1.57 (2.54) | 3.10 (2.93) | 2.57 (3.00) | 3.26 (3.23) | 3.20 (3.27) | 3.57 (3.52) | 3.70 (3.64) | 4.61 (3.81) | 3.95 (4.15) |
| 3 months CH NCHS | 3.91 (4.18) | 3.87 (4.43) | 5.40(4.88) | 4.79(5.32) | 5.85(5.40) | 6.00(5.98) | 6.17(5.90) | 6.50(6.56) | 7.48(6.74) | 7.10(7.37) |
| 6 months CH NCHS | 6.31 (5.79) | 5.10 (6.20) | 7.00 (6.60) | 6.40 (7.20) | 7.60 (7.21) | 7.25 (7.85) | 7.90 (7.83) | 8.00 (8.49) | 9.30 (8.73) | 8.52(9.46) |
| 9 months CH NCHS | 7.41 (7.00) | 6.12 (7.52) | 8.00(7.89) | 7.52(8.56) | 8.50(8.56) | 8.50(9.18) | 9.05(9.24) | 9.00(9.88) | 10.20(10.17) | 9.50(10.93) |
| 12 months CH NCHS | 8.02 (7.84) | 6.42 (8.43) | 8.50 (8.81) | 8.17 (9.49) | 9.30 (9.53) | 9.45 (10.15) | 10.50 (10.23) | 10.00 (10.91) | 11.77 (11.24) | 10.95 (11.99) |
| 18 months CH NCHS | 9.02 (8.92) | 7.82 (9.59) | 9.95 (10.04) | 9.47 (10.67) | 10.90 (10.82) | 10.70 (11.47) | 12.00 (11.56) | 11.42 (12.31) | 13.95 (12.76) | 12.52 (13.44) |
| 24 months CH NCHS | 9.59 (9.87) | 8.90 (10.54) | 11.30 (11.10) | 10.50 (11.65) | 12.30 (11.90) | 12.15 (12.59) | 13.85 (12.74) | 12.85 (13.44) | 14.50 (14.08) | 14.17 (14.70) |
| 36 months CH NCHS | 10.58 (11.60) | 10.00 (12.26) | 13.05 (12.99) | 12.00 (13.58) | 13.90 (13.93) | 13.90 (14.69) | 15.50 (15.03) | 14.85 (15.59) | 18.70 (16.54) | 16.25 (17.28) |
| 48 months CH NCHS | 12.02 (13.11) | 11.77 (13.64) | 14.90 (14.80) | 13.97 (15.39) | 15.90 (15.98) | 15.40 (16.69) | 17.10 (17.56) | 17.00 (17.99) | 20.79 (19.91) | 18.70 (20.27) |
| 60 months CH NCHS | 14.50 (14.56) | 13.07 (15.27) | 16.45 (16.29) | 15.90 (17.22) | 17.20 (17.66) | 17.35 (18.67) | 18.80 (19.39) | 19.00 (20.14) | 21.87 (22.62) | 22.12 (23.09) |
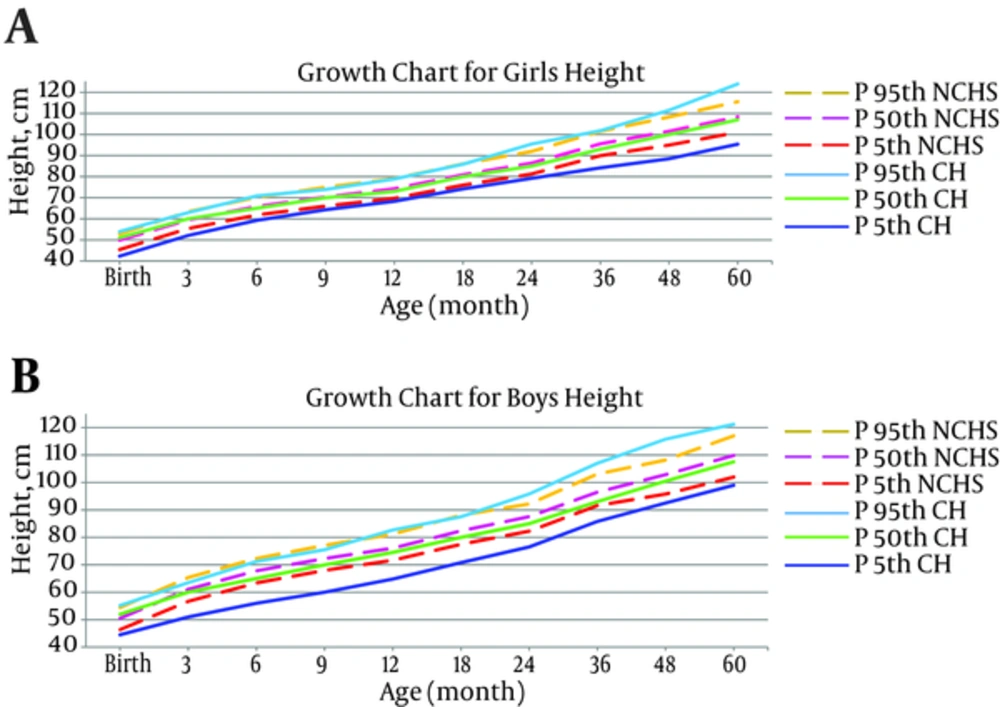
Reviewing the table and chart of the CH and normal NCHS children’s height growth, showed that the trend of the height growth of the females with CH was parallel to those of the healthy girls and the height values in both groups of girls were the same at different percentiles. In the male patients, the height growth pattern in the first 36 months of life was not optimal in comparison with NCHS of healthy children, but after this age, the height growth pattern in both (CH and NCHS) groups of males became the same (Figure 1).
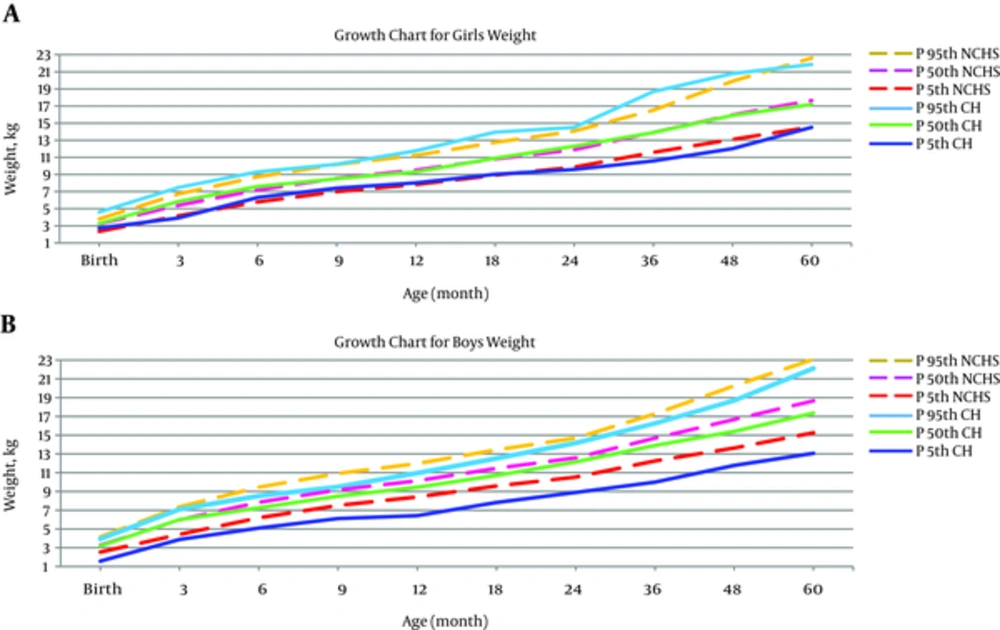
Investigating the weight growth patterns in females with CH, indicated that weight also had an optimal growth in this group. The growth pattern of CH females in the first five years of life ran parallel to NCHS of healthy females. It was also observed that the weight growth pattern of the males of both groups was the same in fiftieth and ninety-fifth percentiles in the first five years of life. However, the weight growth pattern of male patients was impaired after the age of six months, in a way that the fifth percentile of this group was less than NCHS of the healthy group (Figure 2).
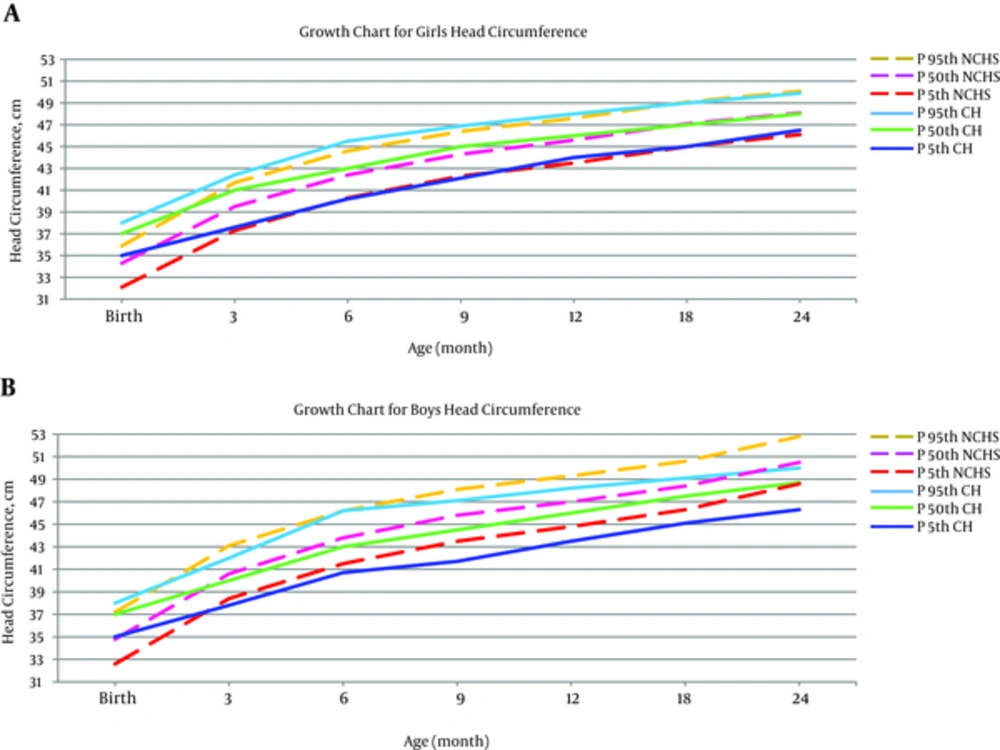
In this study, the female patients’ head circumference had better growth up to age of three months. However, the difference in all percentiles reached the least after this age. The growth pattern of head circumference was the same for both female groups up to age of 60 months. The growth pattern of head circumference of the male patient group was parallel to healthy NCHS group up to age of six months. However, the growth pattern of male head circumference was impaired after the age of six months and all the percentiles were higher for healthy children in comparison with CH children (Figure 3).
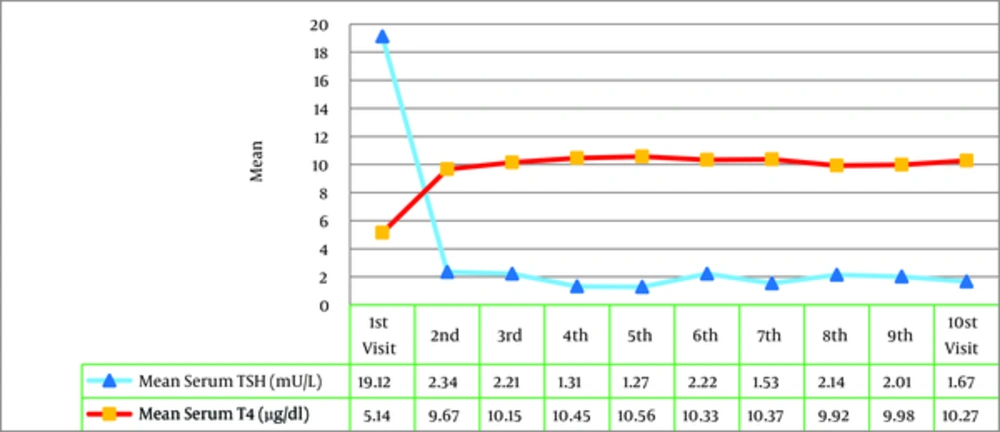
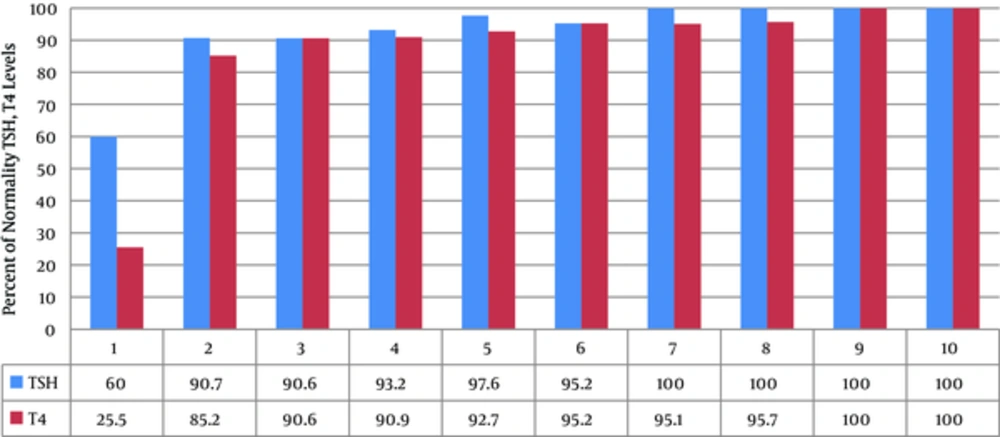
Calculating the mean serum TSH and T4 levels in children with CH, the growth pattern changes of these levels were evaluated during the treatment by the Repeated Measure test. The findings revealed that the level of TSH in serum was significantly decreased and T4 level was significantly increased from the first to tenth intervention and reached a normal range (P = 0.001) (Figure 4). The frequency of the children, whose serum T4 and TSH levels were within the normal range, was gradually increased after each intervention (Figure 5). Furthermore, the level of TSH in serum of all children with CH reached normal range after the 7th visit. However, the level of T4 in serum of these children also reached the normal range after the 9th visit. The levels of TSH and T4 in serum in children with CH had normality percentage of more frequency in the second visit in comparison with other visits. Therefore, the results revealed the efficacy of interventions on the normality of serum TSH and T4 levels in children with CH.
4. Discussion
In the present study, height, weight and head circumference for both age and gender groups were determined on the 5th, 25th, 50th, 75th, and 95th percentiles, in children with CH in Yazd city compared with NCHS healthy children up to the age of five years. For the first five years of life, the pattern of height growth of the female patients ran parallel with the growth curve of healthy girls. Also the pattern of height growth in male patients ran towards the growth curve of NCHS healthy boys after 36 months of age.
Our findings were consistent with the results of previous studies conducted in other parts of the world. Sato et al. (2002) found that the height of the majority of the patients were within ±2 SD while 70 (3%) children had a height below -2 SD. Generally, the height growth of children with CH was not significantly different from healthy children (18). Daliva et al. (2000) indicated that during the first three years of life, the values of height percentiles for all children with CH were within a normal range (19).
In a longitudinal cohort study in Qatar, Solimab et al. (2012) reported no significant association between birth height of the patients with CH and healthy children. All the patients had normal height in their first six years of life. They also concluded that screening along with treatment completely led to appropriate linear growth and mental development (20).
Kik et al. (2011) evaluated physical growth of children with CH, who were detected by screening in Poland. Physical growth of all the children was found to be within a normal range. Early initiation of treatment was essential for their growth and development (21). A similar study was done by Salerno et al. (2001) in Italy on longitudinal growth, sexual maturation, and final height of 55 children with hypothyroidism during a 17-year period. The results showed that final height of all patients was within a normal range (22).
In France, Grant et al. (1994) revealed that the average height of children with severe CH was below the standards of healthy children during the first and second years of life. However, these values became normal from the third and fourth years onwards (23).
A similar study was done in Isfahan, Iran by Hashemipour et al. (2011). The values of percentiles for each variable were different between the CH and healthy children. However, this difference decreased with age and finally the height of patients reached normal values (24).
In contrast, the results of certain studies did not support our findings. Heyerdahl (1997) evaluated the linear growth of 103 children with CH, followed up until the age of six years by a longitudinal cohort study in Sweden and Norway. Average height of children with CH was found to be below the standard in the first year of life. Generally, the CH children had a lower average height in comparison with the reference population (25).
In Canada, Aronson et al. (1990) conducted a prospective cohort in which physical growth of 56 children with CH was evaluated in terms of height, weight and head circumference and compared with the percentiles of Britain’s healthy children. After a delay in the first year, the height of children with CH was higher than the standard population until the fourth year (26).
The difference in the results of the present study with Aronson and Heyerdahl’s findings seems to be due to the different study designs and comparison groups. The present study was a retrospective cohort and NCHS healthy children were selected as reference for height growth pattern. However, Aronson and Heyerdahl studied prospective cohorts comparing the patients with native healthy children of Britain, Sweden and Norway.
The present study indicates that the weight growth pattern of the female patients had an optimum status and was not different from NCHS healthy girls. Weight growth pattern of the CH and healthy boys followed a similar trend on the 50th and 95th percentiles during the five-year study. However, after six months of age, weight growth of male patients faced problems on the 5th percentile.
The results of some other studies were in agreement with our findings. Sato et al. (2007) conducted a study in Japan in which weight growth curves of children with CH were not significantly different from those of healthy children. At the end of this study, children with CH had the same weight growth as normal children (18). In a study from China, during year 2012, Sun et al. reported that weight growth of children with CH was similar to that of healthy children (27). In Barcelona, Agullo et al. (2011) revealed that weight and physical development of all patients with CH were within the normal growth range and did not differ from the healthy population (28). Ashraf found no meaningful relationship between the weight of CH children and CDC healthy children. The weight growth patterns of both groups ran parallel to each other (20). Kik demonstrated that weight growth of all children with CH was within a normal range (21). Aronson et al. (1990) argued that the weight of CH children below one year of age was less than the healthy population; however, from the first year onwards, their weight percentiles were in accordance with standard percentiles (26).
Conversely, Feizi et al. (2009) reported that the patients’ weight did not reach normal values after a five-year follow-up, and it was lower than reference values. However, their weight had a growing trend during the treatment period (24). In this prospective cohort study, 760 children with CH were enrolled in the study and their height, weight, head circumference and body mass index (BMI) were compared with the world health organization (WHO) healthy children. The difference in the results of the present study and Hashemipour’s study could be explained by different study designs and sample size; as their study was a prospective cohort with larger sample size. Also in Hashemipour’s study the growth pattern of WHO healthy children was selected as reference while in our study NCHS healthy children were used as the comparison group.
Based on the results of the current study, occipitofrontal circumference (OFC) percentiles showed a very similar growth trend until 60 months of age in CH and NCHS healthy girls. There was a decline in OFC growth trend of CH boys after six months of age.
In 2010, Gibert Agullo et al. performed a study in Catalonia, Spain, where no difference was observed in final values of OFC of CH children compared with the general population of Barcelona (28). According to the study of Ashraf et al. (2012), there was no considerable difference in OFC between the CH children and CDC healthy children, while children with CH had an appropriate OFC growth trend (20). Hashemipour et al. reported that OFC of children with CH was smaller than that of healthy children until the age of three years (24), whereas in other studies it was shown to be larger in CH children (29). This difference could have resulted from different etiologies of disease in Iran compared with others. In Iran most cases of the disease are caused by dyshormonogenesis while in other societies it is mainly caused by gland dysgenesis (24, 30).
Grant et al. (2010) claimed that at all ages, the average OFC of children with severe CH was larger than reference values for healthy children (23). In a study in 2004, Ng et al. suggested that OFC of children with CH was larger than that of healthy children in the first three years of life (29). Aronson indicated that the average OFC of children with CH was significantly larger than that of the normal population (26).
The current research and review of other studies about diagnosis, treatment, and follow-up of children with hypothyroidism revealed that therapeutic interventions had considerably optimal and appropriate effect on normalization of TSH and T4 levels in CH children under treatment in Yazd city. In other words, in most of the patients T4 and TSH levels had reached the normal range after the second clinical visit.
In a recent systematic review of management of patients with CH, Rastogi et al. (2010) suggested serum T4 and TSH to be regularly monitored for appropriate care and management of these patients. Finally, it was claimed that after appropriate treatment of children with CH, serum T4 level rapidly increases and TSH level decreases. In order to improve mental growth and physical development of children with CH, serum T4 level should be restored to higher values than normal (> 10 μg/dL) and TSH level should be kept < 5 mU/L (12). Therefore, based on the results it can be stated that in the present study treatment goals were completely achieved and the physicians in charge of treatment reached the golden standard of treatment for children with CH.
In 2006, Bajracharya et al. carried out a study in Nepal to examine the effect of therapeutic interventions on growth pattern of children with hypothyroidism. Thirty-four children were recruited and the indexes of thyroid function (T3, T4, and TSH) were measured. The results demonstrated that the level of TSH was high in 76% of the patients on the first visit. Also T4 and T3 levels were low in 44% and 35% of the patients, respectively. Three months later, on the second visit, abnormal levels of TSH, T4 and T3 decreased to 21%, 3% and 9% of the patients, respectively, this continued to be 15%, 3% and 6%, on the third visit. At last, on the 12th visit all the patients had normal levels of TSH, T4 and T3. The results of this study demonstrated efficient therapeutic interventions and hopeful growth of the children with CH (13).
A study in China by Yang et al. (2005) showed that one month after treatment, serum TSH level of children with CH reduced (P < 0.01) and T4 raised (P < 0.01) significantly compared with baseline (31).
In 2011, Rostampour et al. measured primary levels of TSH and T4 at the screening in children with CH. These values were measured once more after treatment at the age of three years. The level of primary TSH was 25.5 while it decreased to 3.9 after treatment. Being 5.7 at the screening time, T4 level raised to 8.1 after treatment (32).
This study had some limitations such as the number of cases and lack of cooperation of some parents, who opposed participation of their child. Due to the unavailability of normal measures of Iranian children we had to use the information reported by the national center for health statistics of the United States.
4.1. Conclusions
In conclusion the pattern of height, weight and OFC of the girls with CH ran parallel with the growth pattern of NCHS of healthy girls. The pattern of height and weight growth of boys with CH gradually became similar to the growth pattern of NCHS of healthy boys; however, there was a decline in their OFC growth trend after six months of age. Also it was revealed that therapeutic interventions had completely optimal and appropriate effect on normalization of serum TSH, T4 levels and growth pattern in CH children under treatment.
