1. Background
Reference ranges are important in order to correctly interpret test results and apply accurate clinical diagnoses and treatment. A reference range is defined as two limiting values that include the distribution of test values from 0.025 - 0.975 (95% of results) in apparently healthy individuals. International guidelines suggest conducting a reference range study for 1) a new analyte measurement, 2) the measurement of an existing analyte with reference values using a new or different analytical method, and 3) the measurement of an analyte that has different laboratory or manufacturer reference values using the same or a similar analytical method (1). For each laboratory in these cases, it is recommended that it determine its own reference range for the healthy population in appropriate age groups or that it use the reference ranges recommended by the manufacturer. However, as it is difficult for each laboratory to determine its own reference range, most laboratories tend to use manufacturers’ reference ranges or information from the literature.
Reference ranges for coagulation tests, which are recommended by manufacturers, often include a limited number of adult age groups and do not encapsulate reference ranges for children and pubescent adolescents. The coagulation and fibrinolysis physiology of newborn and young children have statistically significant differences when compared with older children and adults (2-5). These variations, which usually reflect the immaturity of the hemostasis system of a newborn, are functionally balanced. Compared with adults, healthy newborns exhibit fewer symptoms of bleeding disorders and thrombosis (4, 5).
In order to apply the correct treatment for hemostatic disorders in childhood, laboratory data should be interpreted in accordance with age, analyzer, and appropriate reagent reference ranges. Otherwise, abnormal test results may cause further unnecessary diagnostic investigations, requests for additional consultations, improper treatments, the cancellation of surgical operations, challenges for the family and the clinician, and economic losses. However, the number of studies regarding reference ranges for coagulation tests is limited for the following reasons: the need for additional staff to collect and analyze samples from pediatric age groups, sampling is laborious and difficult, coagulation tests have more pre-analytic variance, the costly nature of studies, and problems with time constraints and ethics. While there are studies involving different analyzers and reagents (6-10), there are no studies on determining age-dependent reference range values for prothrombin time (PT), activated partial thromboplastin time (aPTT), fibrinogen tests, and D-dimer tests using TriniCLOT (Tcoag) reagents with a Destiny Plus device (Diagnostica Stago).
2. Objectives
The objective of this study is to determine age-dependent reference range values for PT, aPTT, fibrinogen tests, and D-dimer tests in pediatric and adult volunteers whose blood was drawn prior to elective surgery.
3. Materials and Methods
Participants were selected using the a priori approach in accordance with the clinical laboratory standards institute’s (CLSI) C28-A3 Standard. A total of 320 volunteers who were already scheduled to undergo minor surgical operations in elective cases that were carried out by pediatric surgery, urology, and otorhinolaryngology departments were included in the study. Of these, 188 were in the pediatric age group (0 - 17 years) and 132 were in the adult age group (18 - 65 years). The participants were divided into five groups according to age: 1 month - 1 year old (Group 1), 2 - 5 years (Group 2), 6 - 10 years (Group 3), 11 - 17 years (Group 4), and 18 - 65 years (Group 5). Approval from the Tepecik training and research hospital ethics committee was obtained for the study, and volunteers who participated in the study (or their legal guardians) signed informed consent forms. The study was realized in compliance with the declaration of Helsinki.
The inclusion criteria for volunteers were as follows: 1) volunteers who came to the pediatric surgery clinic for elective surgical operations such as circumcision, inguinal hernia repair, umbilical hernia repair, rectal polyp excision, anoplasty, diagnostic cystoscopy, posterior urethral valve resection and imperforate hymen opening, 2) volunteers who came to the otorhinolaryngology clinic for elective surgical operations such as tonsillectomy, adenoidectomy, septum deviation surgery and tympanoplasty, 3) volunteers who came to the urology clinic for elective surgical operations such as circumcision, cystoscopy, varicocele surgery, hydrocele surgery, prostate biopsy, and urodynamic interventions, 4) participants between 1 - 6 months who were born at term and had a birth weight of more than 2,500 grams, and 5) according to normal clinical practice, pediatric patients who were given 1 mg of intramuscular K vitamin in the delivery room. Each volunteer or relative of a volunteer was surveyed in order to exclude hemostatic system disorder.
Exclusion criteria for volunteers included the following: 1) undergoing anticoagulation treatment or using any drugs; 2) having the history of bleeding in patient or its family; 3) having a history of thromboembolic or hemorrhagic disease; 4) blood samples that were not at the desired level; 5) blood samples that were hemolyzed, icteric, or lipemic; and 6) hematocrit levels greater than 55%.
The volunteers’ blood samples were collected in BD Vacutainer tubes (Beckton Dickinson, Franklin Lakes, NJ, USA) containing 1 part 3.2% trisodium citrate for every 9 parts of blood. In order to prevent stasis, blood was collected using a light tourniquet, and if possible, from the antecubital vein with the help of a holder. If this was not possible, it was collected from the veins on the back of the hand using the broken needle technique. Blood samples were centrifuged at room temperature for 15 minutes at 1,500 g. The plasma was separated and stored at -80°C.
The following were used to analyze the samples: TriniCLOT PT HTF (Tcoag Ireland Ltd, Wicklow, Ireland), TriniCLOT aPTT HS (Tcoag Ireland Ltd, Wicklow, Ireland), TriniCLOT Fibrinogen (Tcoag Ireland Ltd, Wicklow, Ireland), TriniLIA D-Dimer (TcoagIreland Ltd, Wicklow, Ireland), and Destiny Plus (Trinity Biotech, Acton, USA). PT and aPTT were measured using magnetic identification and based on mechanical clot detection. The Clauss method was used to determine fibrinogen, and the agglutination method with polystyrene micro particles was used to determine D-dimer. Precision studies were performed in accordance with CLSI’s EP15-A3 protocol (11). The maximum in-study coefficient of variations (CVs) at two different levels for PT, aPTT, fibrinogen, and D-dimer reagents were 2.8, 3.0, 2.3, and 5.9, respectively. The total CVs for PT, aPTT, fibrinogen, and D-dimer reagents were 4.8, 4.5, 3.7, and 7.0, respectively. The CV values were within the expected limits claimed by the manufacturer.
The data obtained were evaluated using the MedCalc software program (MedCalc, Mariakerke, Belgium). Extreme values were excluded according to the Dixon D/R rule: D = most extreme value–adjacent value, R = range value between all data. When D/R > 0.33, the most extreme value was excluded from the calculation. The Shapiro-Wilk test was used to analyze normal distribution. Differences between the subgroups, which were created in accordance with information found in the literature, were analyzed using the Mann Whitney-U test. P < 0.05 was considered to be statistically significant. Where there were no statistically significant differences between the groups, they were combined and reanalyzed. The reference range was established using the nonparametric method on obtained data according to the C28-A3 standard (1). Using the nonparametric method, the reference range and the upper and lower limits covering 95% of the distribution (corresponding to 2.5% - 97.5%) were calculated. For groups including less than 120 data, confidence ranges for the upper and lower limits of the reference range were calculated using bootstrapping via the robust method (12).
4. Results
The study included a total of 188 children 1 month - 17 years of age and a total of 132 adults 18 - 65 years of age. Some extreme values were excluded in order to maintain compatibility with the normal distribution. Participants reflected the mixed population of Turkey. The participants’ demographic information is summarized in Table 1. As the majority of children presenting to clinics are applying for circumcision, the number of boys was greater than the number of girls. In the adult age group, the distribution of male and female volunteers was approximately the same.
| 1 mo - 1, y | 2 - 5, y | 6 - 10, y | 11 - 17, y | ≥ 18, y | |
|---|---|---|---|---|---|
| 52 | 50 | 48 | 38 | 132 | |
| 9/43 | 7/43 | 7/41 | 15/23 | 66/66 | |
| 44 | 47 | 45 | 16 | 0 | |
| 0 | 0 | 0 | 0 | 47 | |
| 8 | 3 | 3 | 25 | 82 |
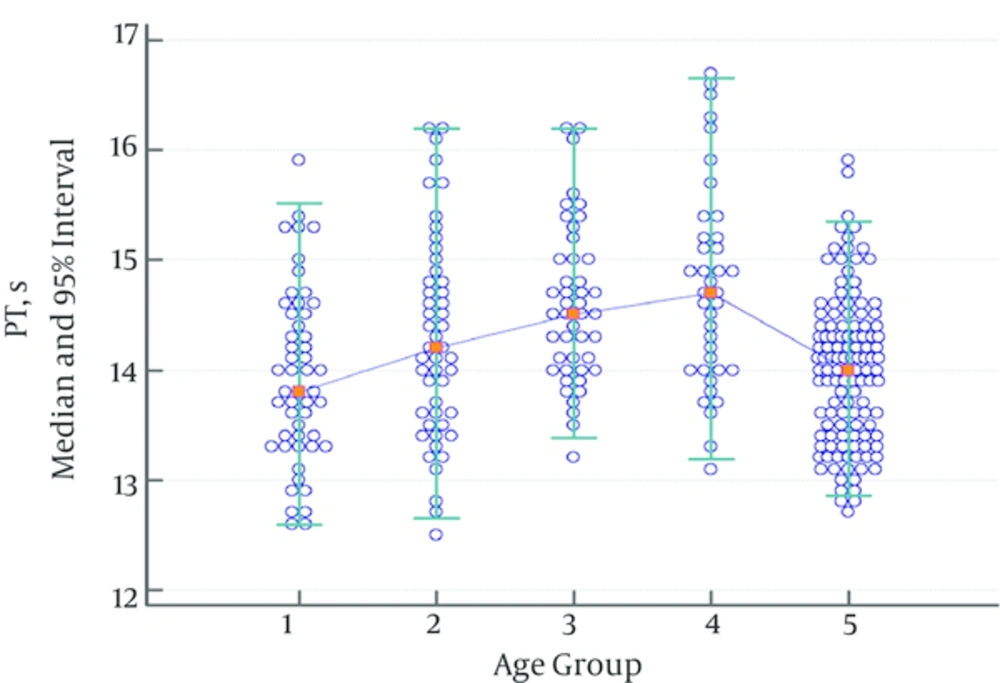
While there was no statistically significant difference regarding PT between the groups consisting of children between 1 month - 1 year, ages 2 - 5, ages 6 - 10, and ages 11 - 17, there was a statistically significant difference between the group consisting of children aged 11 - 17 and the adult group. Thus, the pediatric age groups were combined, and the obtained data were divided into two groups: children and adults. Significances between the child and adult groups were reanalyzed. A significant difference between the child and adult group was found, and two different reference ranges were determined (Table 2). While there was an increase in PT values in the group consisting of children aged 6 - 10, this increase was not statistically significant (Figure 1).
| Age | |||||
|---|---|---|---|---|---|
| 1, mo - 1, y | 2 - 5, y | 6 - 10, y | 11 - 17, y | ≥ 18, y | |
| 51 | 49 | 45 | 38 | 121 | |
| 13.8 | 14.2 | 14.5 | 14.7 | 14.0 | |
| 12.3 | 12.3 | 13.1 | 12.8 | 12.8 | |
| 12.0 - 12.6 | 12.0 - 12.7 | 12.8 - 13.4 | 12.4 - 13.2 | 12.7 - 13.0 | |
| 15.5 | 16.1 | 16.0 | 16.6 | 15.4 | |
| 15.2 - 15.8 | 15.7 - 16.5 | 15.5 - 16.3 | 16.1 - 17.1 | 15.1 - 15.9 | |
| 0.073 | 0.076 | 0.439 | < 0.001 | ||
| 183 | 121 | ||||
| 14.3 | 14.0 | ||||
| 12.7 (12.5 - 12.9) | 12.8 (12.7 - 13.0) | ||||
| 16.2 (16.2 - 16.7) | 15.4 (15.1 - 15.9) | ||||
| < 0.001 | |||||
aRobust method.
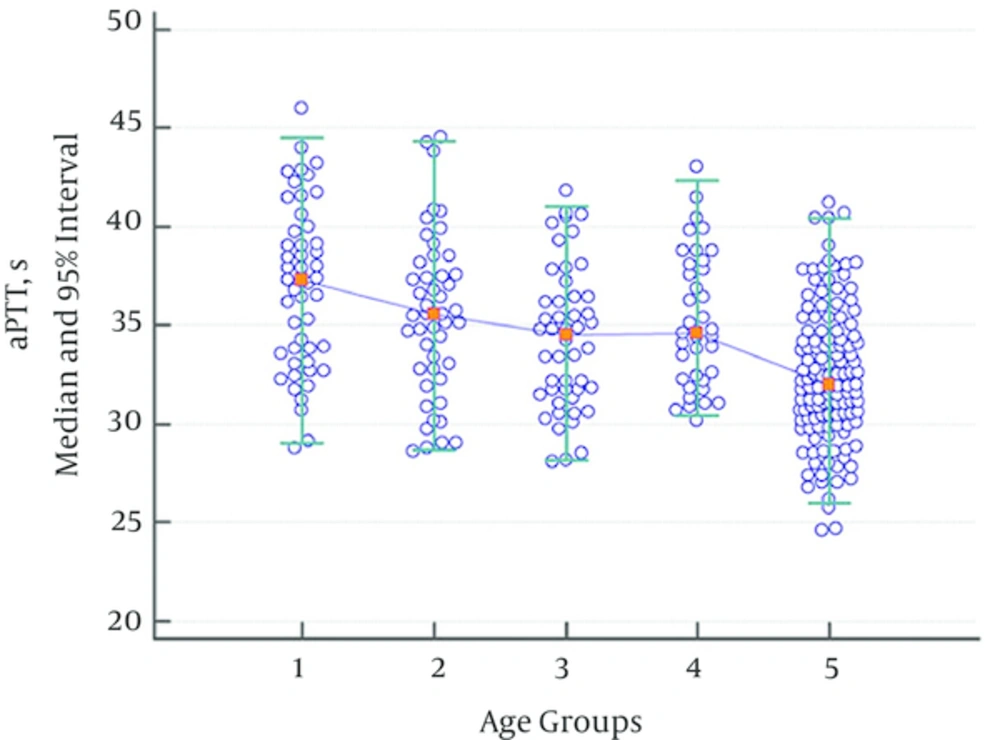
While there were no statistically significant variations regarding aPTT values between groups consisting of children aged 1 month - 1 year, 2 - 5 years, 6 - 10 years, and 11 - 17 years, a statistically significant decline was observed in the adult group when compared with the group consisting of children aged 11 - 17. Thus, the data for all pediatric subgroups were combined. The aPTT values in the children’s age groups were significantly higher than in the adult group (Table 3, Figure 2). The aPTT values showed a tendency to decrease with age.
| Age | |||||
|---|---|---|---|---|---|
| 1, mo - 1, y | 2 - 5, y | 6 - 10, y | 11 - 17, y | ≥ 18, y | |
| 49 | 47 | 48 | 38 | 127 | |
| 37.3 | 35.6 | 34.6 | 34.7 | 32.0 | |
| 28.4 | 27.1 | 26.8 | 28.0 | 25.8 | |
| 26.9 - 30.1 | 25.6 - 28.9 | 25.4 - 28.1 | 26.8 - 29.4 | 24.6 - 27.0 | |
| 45.4 | 43.7 | 41.6 | 42.2 | 40.4 | |
| 43.8 - 47.0 | 42.0 - 45.4 | 40.0 - 43.0 | 40.2 - 43.7 | 38.2 - 41.2 | |
| 0.114 | 0.135 | 0.264 | < 0.001 | ||
| 182 | 127 | ||||
| 35.2 | 32.0 | ||||
| 28.7 (28.1 - 29.1) | 25.8 (24.6 - 27.0) | ||||
| 43.9 (42.8 - 46.0) | 40.4 (38.2 - 41.2) | ||||
| < 0.001 | |||||
aRobust method.
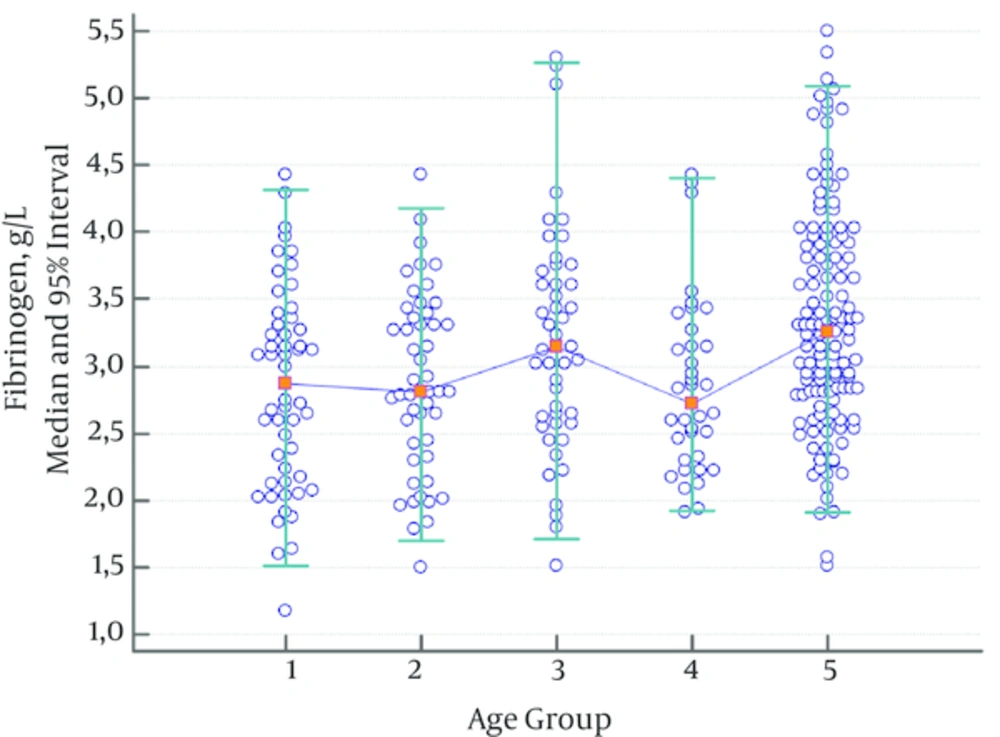
Fibrinogen levels were significantly higher in the adult group and the group consisting of children aged 6 - 10 compared to the other groups (Table 4, Figure 3). Therefore, a different reference range was established for these groups.
| Age | |||||
|---|---|---|---|---|---|
| 1, mo - 1, y | 2 - 5, y | 6 - 10, y | 11 - 17, y | ≥ 18, y | |
| 52 | 49 | 47 | 37 | 126 | |
| 2.87 | 2.81 | 3.15 | 2.72 | 3.26 | |
| 1.30 | 1.51 | 1.40 | 1.40 | 1.90 | |
| 1.04 - 1.59 | 1.28 - 1.78 | 1.04 - 1.79 | 1.10 - 1.73 | 1.51 - 2.18 | |
| 4.37 | 4.25 | 4.84 | 4.10 | 5.13 | |
| 4.08 - 4.65 | 3.97 - 4.50 | 4.45 - 5.23 | 3.70 - 4.46 | 4.91 - 5.50 | |
| 0.711 | 0.095 | 0.034 | < 0.001 | ||
| 182 | 47 | 37 | 126 | ||
| 2.88 | 3.15 | 2.72 | 3.26 | ||
| 1.62 (1.17 - 1.83) | 1.40 (1.04 - 1.79) | 1.40 (1.10 - 1.73) | 1.90 (1.51 - 2.18) | ||
| 4.32 (4.09 - 4.43) | 4.84 (4.45 - 5.23) | 4.10 (3.70 - 4.46) | 5.13 (4.91 - 5.50) | ||
| 0.042 | 0.034 | < 0.001 | |||
aRobust method.
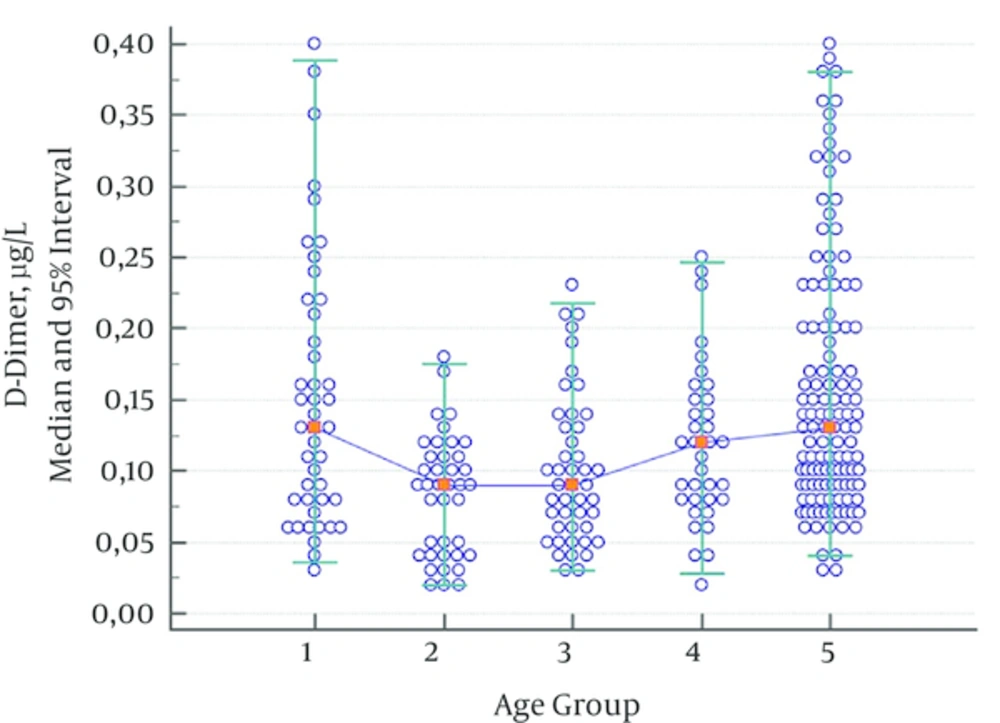
As the lowest measurement limit for D-dimer in the Destiny Plus device was 0.05 µg/L, no lower limit was given. Furthermore, determining the upper limit of the 95% interval would be enough to exclude thromboembolism.
As no statistically significant difference was observed between groups consisting of children aged 2 - 5 years, 6 - 10 years, and 11 - 17 years, the data were combined for children aged 2 - 17. D-dimer values of children aged 1 month - 1 year showed a significant decline in the group consisting of children aged 2 - 17. Another statistically significant increase was observed in the adult group; this was evaluated as a different reference range (Table 5, Figure 4).
| Age | |||||
|---|---|---|---|---|---|
| 1, mo - 1, y | 2 - 5, y | 6 - 10, y | 11 - 17, y | ≥ 18, y | |
| 44 | 39 | 45 | 35 | 122 | |
| 0.13 | 0.09 | 0.09 | 0.12 | 0.13 | |
| 0.34 | 0.17 | 0.20 | 0.23 | 0.38 | |
| 0.28 - 0.39 | 0.15 - 0.19 | 0.17 - 0.23 | 0.20 - 0.26 | 0.35 - 0.40 | |
| < 0.001 | 0.272 | 0.103 | 0.150 | ||
| 44 | 115 | 122 | |||
| 0.13 | 0.09 | 0.13 | |||
| 0.34 (0.28 - 0.39) | 0.18 (0.17 - 0.26) | 0.38 (0.35 - 0.40) | |||
| < 0.001 | < 0.001 | ||||
aRobust method.
5. Discussion
Andrew et al. (2) were the first to define developmental hemostasis in 1987. The findings of this study were supported by several other studies (5, 10, 13, 14). The present study showed that adult and child age groups should be evaluated using different reference ranges. This is because an evaluation based on misdiagnosis can lead to serious consequences for the healthcare system, patients, patients’ families, and clinicians.
Flanders et al. (14) found that the PT (Diagnostica Stago) median value (14.0 s) in the 7 - 17 age group was significantly higher than in the adult group (13.2 s). However, they did not observe any significant difference in aPTT (Diagnostica Stago) values. Similarly, the present study found a difference of about 1 s in the same age group (7 - 17 years). The fact that PT and aPTT values tend to decrease as age increases (5, 13) in every four systems, including in this device, proves that the same age-related physiological changes were observed.
In Andrew et al.’s study (2), PT values showed a significant decline in the first month of infancy and continued at similar levels in the adult group during childhood. As vitamin K-dependent factors (factor II, VII, IX, X) increase in the first six months of an infant’s life, it has been suggested that they contribute to the decline of PT values. It has been observed that aPTT values, which increase at birth, decrease to adult levels in the first six months of life and show no statistically significant difference during the childhood period when compared with adults. This has been explained by contact factors being lower at birth and tending to increase during the first six months of life (2, 15-17).
In Andrew et al.’s (2) study, the fibrinogen values did not exhibit a statistically significant increase until adulthood, except for an increase observed on the fifth day of life (2, 16, 17). Similar to other studies (5, 13), the present study discovered a statistically significant decline in fibrinogen values from 1 month - 1 year when compared with adulthood, and a statistically significant increase between 6 - 10 years of age.
In one study (5), while D-dimer values were significantly higher in the first three days of life, they were significantly higher until the age of one year in another study (13). In the present study, D-dimer values statistically decreased from ages 2 - 17.
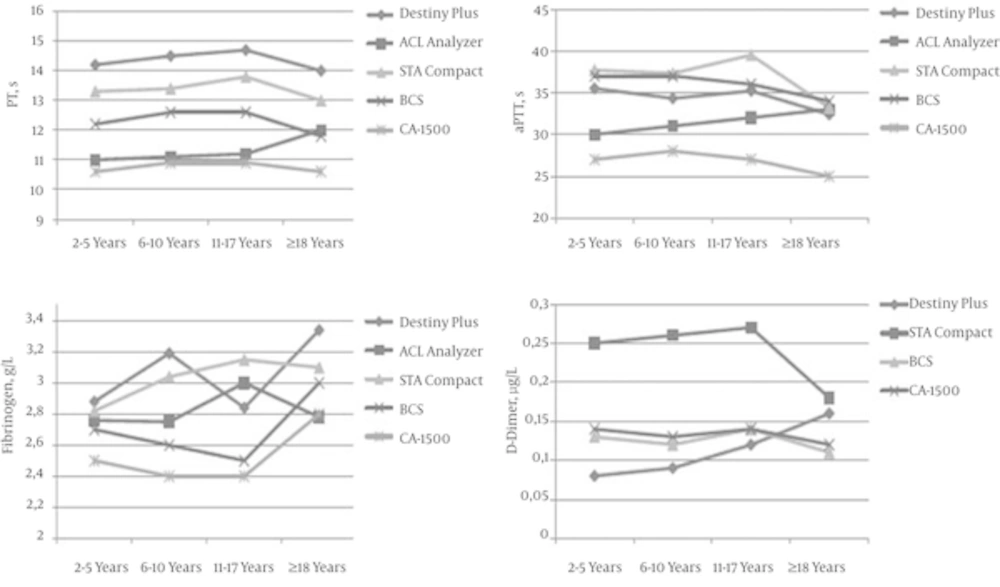
When age-dependent mean values of reference range studies were compared (2, 5, 13, 15) (Figure 5), it emerged that while PT values were different in device/reagent combinations, their increase or decrease tendencies were parallel to each other. The only exception was the increase in PT value in the adult group on the ACL analyzer, but this was not statistically significant. While the aPTT values on the ACL analyzer increased with age, these values decreased in the other four device/reagent combinations as age increased. Excluding the ACL analyzer, the fibrinogen values were significantly higher in adults when compared with the 2 - 5 year group. With the Stago Compact analyzer, the D-dimer results were significantly higher when compared with the other devices. While the D-dimer results showed similar tendencies in the Stago Compact, BCS, and CA-1500 analyzers, the present study found an increase with age in its device.
Comparison of Mean Values of Reference Range Studies was Conducted With Five Different Device/Reagent Combinations (2, 5, 13, 15): Destiny Plus (Trinity Biotech), ACL analyzer (Beckman Coulter), STA Compact (Diagnostica Stago), BCS (Simens Diagnostic), CA-1500 (Sysmex Corporation). ACL analyzer was not evaluated for D-dimer.
In summary, different results in some of the age groups emerged, likely caused by differences between the methods used (mechanical or optical), population, blood collection method (from the antecubital vein or from the back of the hand using the broken needle technique), sensitivity of the reagent for the lupus anticoagulant, gene polymorphism for fibrinogen (beta fibrinogen gene promoter, G455A), seasonal differences (higher in winter), and non-physiological variances (inflammation). As this study mechanically measured coagulation time, the detection mechanism was not affected by hyperbilirubinemia or lipemia.
For the evaluation of pediatric samples, diagnostic laboratories should use appropriate reference ranges in terms of age, analyzer, and reagent (18). This is particularly necessary in tests that show physiological variances. When determining age-appropriate reference ranges, laboratories should establish groups with statistically significant differences in order to standardize age groups. When laboratories are not able to establish their own reference ranges, they should use the reference ranges established by using the same analyzer and reagent systems. In cases like this, population variance should also be taken into account. This is because population-specific variances (19, 20), reagent-specific variances (5, 21), and analyzer-specific variances (22) have been observed in the literature. If there is no reference range value present for the analyzer/reagent combination used in that laboratory, great care should be taken when interpreting coagulation test results in children. In cases like this, each laboratory should establish its own reference range for healthy populations in appropriate age groups. If the sample size for calculating reference range is greater than 120, a nonparametric method should be used. If the sample size is smaller than 120, the reference range should be calculated using the robust method. Confidence intervals of 90% at the upper and lower limits should be determined. If this cannot be achieved, the reference range values recommended by the manufacturer should be used.
