1. Background
Food allergy is one of the most common allergies in infants and children, the prevalence rate of which is increased with time for foods including cow milk protein (1). The prevalence of cow milk protein allergy (CMPA) has been reported to be increased from 1.6% to 3.5% over a decade (2). Although the majority of CMPA children can recover spontaneously by the age of 5 years, a recent report has shown that about 10% of CMPA children continued allergic symptoms until more than 5 years old (3). In addition, CMPA children over 5 years old are often accompanied by other allergic reactions, including asthma and rhinoconjunctivitis (4, 5), and so on.
In recent years, the etiologies of atopic diseases have been hypothesized to be involved in gut microbiota, because it has been observed that some disruptions occur in the gut microbiota between healthy and allergic children (6-8). Compared with healthy children, more Clostridia (9), fewer Bifidobacteria (10, 11) and lower Lactobacilli (12) were detected in the gut microbiota of allergic children. Especially, Bifidobacterium in the feces of infants and children were reported to be associated with the development of food allergy (13). Similarly, our previous study analyzed fecal microbiota in 5 - 8-year-old children with and without CMPA by using polymerase chain reaction-denaturing gradient gel electrophoresis (PCR-DGGE), and revealed that the diversity of Bifidobacterium group was lower in the fecal microbiota of CMPA children than in healthy controls (14). Given an increased prevalence and a long-term persistence of CMPA, it is necessary to conduct a further study on the fecal microbial composition of CMPA children.
High-throughput sequencing technology is commonly used to analyze comprehensively the richness and diversity of the gut microbiota. It can identify approximately 80% more gut microbiota which was hardly identified by culture-based microbiological methods (15). The fecal microbiota characteristics had been known and clarified using the high-throughput sequencing technology, particularly in the allergic diseases, including food allergy (16), atopic eczema (17), and allergic atopic dermatitis (18). The application of high-throughput sequencing technique to the study of gut microbiota in CMPA children has been less fruitful.
Short-chain fatty acids (SCFAs) are major end products metabolized by mainly anaerobic bacteria in the intestine, they play the key role for adjusting the function of the host metabolism and regulating of immune responses (19). A higher level of acetic acid has been observed in allergic 4-year-old children compared with healthy children (20). Thompson-Chagoyan et al. found that fecal butyric acid and branched-chain short fatty acids were higher in CMPA infants than in healthy infants (21). However, a further thorough study on the changes of SCFAs and lactic acid in feces of CMPA children was limited.
In this study, we focus on the alteration of intestinal microflora structure and changes of SCFAs of CMPA children aged 5 to 8 years.
2. Objectives
The study aims to comprehensively compare the composition of fecal microbiota and levels of fecal SCFAs and lactic acid between CMPA children at the age of 5 - 8 years and healthy controls, and analyze the interaction between fecal microflora and its metabolites, namely SCFAs and lactic acid.
3. Methods
3.1. Population Enrollment and Sample Collection
During a 7-month period (March 2016 to October 2016) at the Harbin children’s hospital (Heilongjiang, China), we enrolled 6 CMPA children aged 5 - 8 (mean 6.4) years with about equal number of males and females. The CMPA children in this study showed some symptoms of allergic disease such as angioedema, pruritus, diarrhea or eczema, the details of which are given in supplementary file (Appendix 1). Moreover, CMPA was diagnosed by three tests: a skin prick test, analysis of serum samples and a double-blind placebo-controlled standard cow’s milk formula challenge (5, 22, 23). The patient was considered CMPA when the following criteria were met (21): (i) an obvious immediate hypersensitivity to CMP; (ii) positive skin prick test, specific IgE to CMP; (iii) positive CMP challenge test. Meanwhile, 8 age- and sex-matched controls were recruited from healthy children in Harbin city with no history of CMPA or any other allergies. According to their sensitization, the children were divided into two groups: CMPA group (C) and healthy group (H). In addition, all participants did not ingest antibiotics within 4 weeks before the sampling.
All fecal samples were obtained from all participating children immediately after defecation, and transferred into sterile plastic tubes by physicians. Then the samples were transported quickly to the lab and stored at -80°C until extraction of genomic DNA.
3.2. DNA Extraction, 16S rRNA Gene Amplification and Sequencing
DNA was extracted using a TIANamp Stool DNA Kit (Tiangen, China, cat#DP328-02) according to the manufacturer’s instructions. In order to improve the efficiency of cell wall lysis of gram-positive bacteria in the feces, the samples were incubated at 95°C for 5 minutes. The extracted DNA was stored at -20°C until processed (24).
DNA was amplified with the primers 515 F (5’-GTG CCA GCM GCC GCGG-3’) and 806 R (5’- GGA CTA CNN GGG TAT CTA AT -3’) for the V3-V4 hypervariable regions of 16S rRNA gene (25). All PCR reaction mixture comprised with 15 μL of Phusion® High-Fidelity PCR Master Mix (New England Biolabs), 0.2 μM of forward and reverse primers, and about 10 ng DNA template. The PCR conditions were as follows: thermal cycling consisted of initial denaturation at 98°C for 1 minute, followed by 30 cycles of denaturation at 98°C for 10 seconds, annealing at 50°C for 30 seconds, and elongation at 72°C for 30 seconds. Finally 72°C for 5 minutes. PCR products were detected by electrophoresis on 2% agarose gel. Then, the mixture of PCR products was purified using GeneJET Gel Extraction Kit (Thermo Scientific). After purification, samples with bright main strip were chosen to analyze using the Illumina high-throughput sequencing method (26).
3.3. Bioinformatics Analysis and Statistical Analysis
The paired-end reads were assigned to each sample according to the unique barcodes. Sequences were analyzed using QIIME (Quantitative Insights Into Microbial Ecology) software package. First, reads were filtered by QIIME quality filters (26). Then sequences with ≥ 97% similarity were assigned to the same OTUs by utilizing UPARSE software V7.0.1001. The representative sequences were selected for each OTU and used the Ribosomal Database Project (RDP) classifier to annotate taxonomic information (27). Linear discriminant analysis (LDA) effect size (LEfSe) was used to find significantly different microbial community among the groups, and LDA was performed to estimate the effect size of each feature. The correlation between the abundance of fecal microbiota and SCFAs and lactic acid was evaluated by Spearman correlation analysis.
3.4. Determination of the Fecal Lactic Acid and SCFAs
The concentrations of the fecal lactic acid and SCFAs were analyzed by high-performance liquid chromatography (HPLC) according to Dostal et al. (28). 500 mg faces were mixed with 2 mL of 0.5 mmol/L H2SO4 and centrifuged for 20 minutes (11000 r/min, 4°C). The supernatants were filtered via 0.22 μm organic filter to 1.5 mL vials for HPLC.
HPLC was performed using a COSMOSIL® 5C1818-AR-II (4.6 × 250 mm) column, with the flow rate of 0.6 mL/min at 35°C and the flowing phase 50% methanol: 0.1% acetic acid (1:1). The ultraviolet detector operated at λ = 210, and the total running time was set at 20 minutes. The concentrations of samples were analyzed according to the standard curves and the data was expressed as mmol/kg feces.
3.5. Ethical Considerations
This study was approved by the northeast agricultural university ethics committee of Heilongjiang province, China and informed consents were obtained from the children’s parents. In addition, the study protocol is consistent with the ethical guidelines of the 1975 declaration of Helsinki.
3.6. Statistical Analysis
Independent-samples t-test was used to analyze statistical significance in fecal microbial abundance and alpha diversity, and P < 0.05 was considered statistically different. Analyses were performed using the software SPSS 16.0 for windows.
4. Results
4.1. Sequencing Metrics and Taxonomy
16S rDNA amplicon sequencing was performed to characterize the bacterial lineages presented in the fecal microbiota of the 14 children. A total of 583,198 high-quality sequences reads remained for analysis, after removing low quality and short length sequence reads, chimeric sequences and sequences only appeared once in the dataset. The average length of validated sequences reads was 250 bp, which were clustered into OTUs with a similarity cutoff of 97%. A total of 5, 922 OTUs were obtained and each individual averaged 423 OTUs.
4.2. Microbial Richness and Biodiversity
The alpha diversity of fecal microbiota was analyzed by using Chao1, ACE, Simpson, Shannon, and coverage indices (Table 1). The OTU richness was estimated by the Chao1 estimator and ACE, and the Shannon and Simpson index reflected the diversity of microbial community. Good’s coverage, which presented a measure of sampling completeness, was above 99.4% in all samples. These indexes had no significant difference between the two groups by t-test (P > 0.05).
| Group | Good’s Coverage, % | Richness Estimator | Diversity Index | ||
|---|---|---|---|---|---|
| Chao 1 | ACE | Simpson | Shannon | ||
| C | 99.58 | 569 | 582 | 0.894 | 4.712 |
| H | 99.73 | 334 | 343 | 0.686 | 3.264 |
a.The richness estimators (ACE and Chao1), diversity indices (Shannon and Simpson), and coverage were calculated using the QIIME software.
4.3. Abundance of Fecal Bacterial Composition
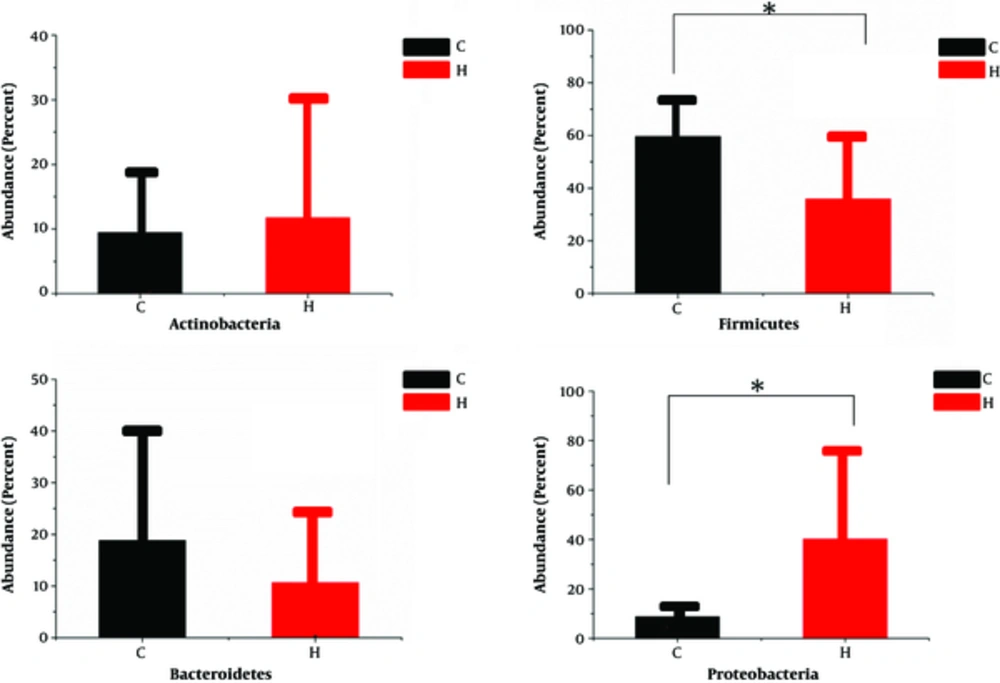
Bioinformatic analysis of 16S rDNA sequence data revealed that there were some differences in the fecal microbiota of children with CMPA and healthy children. More than 96.6% of the sequences in all samples were found to belong to the four most populated bacterial phyla, Actinobacteria, Bacteroidetes, Firmicutes, and Proteobacteria (Figure 1). Bacteroidetes and Firmicutes were more presented in the group C than in the control group (18.84% vs. 10.68%, 59.59% vs. 35.88% respectively), whereas Actinobacteria and Proteobacteria were more abundant in the group H than in the group C (11.74% vs. 9.46%, 40.21% vs. 8.77% respectively). Statistical analysis using independent-samples t-test indicated that Proteobacteria (P = 0.047) and Firmicutes (P = 0.046) significantly differentiate the CMPA children from the healthy children.
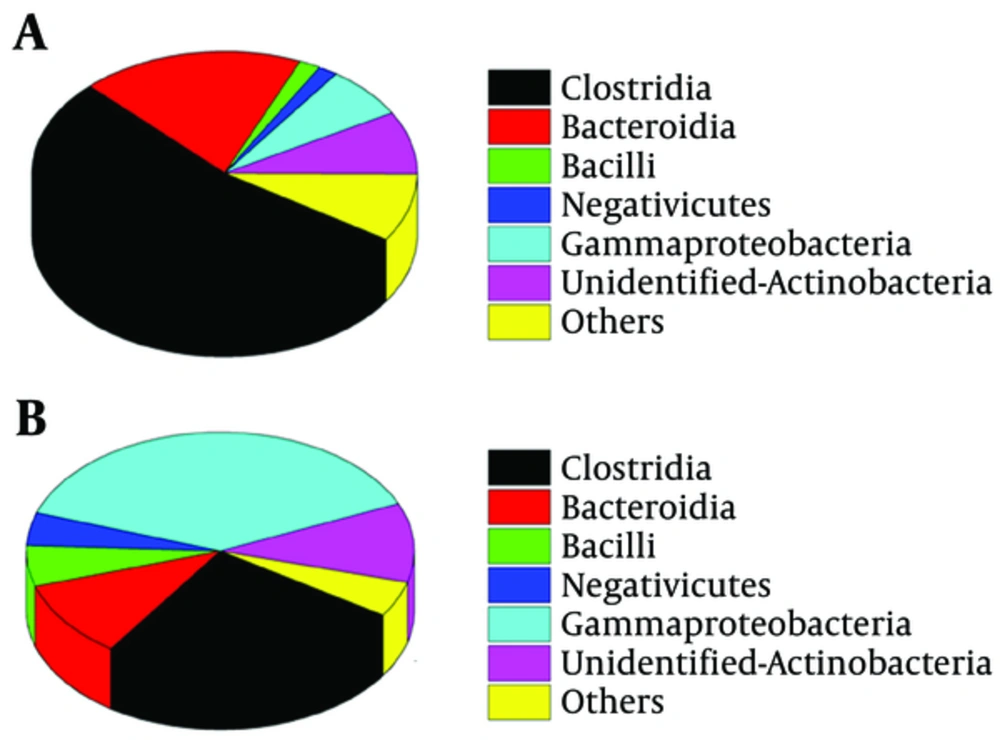
Among the total classes identified in the fecal microbiota, six predominant bacterial classes were detected in two groups. Predominant classes were defined as those accounting for > 1% of the total DNA sequences (Figure 2). The class Clostridia was more dominant in the fecal microbiota of CMPA children (53.50%), Gammaproteobacteria was more dominant in the fecal microbiota of healthy children (38.28%). Compared with group H, the Clostridia class had a significant increment in group C (P < 0.05).
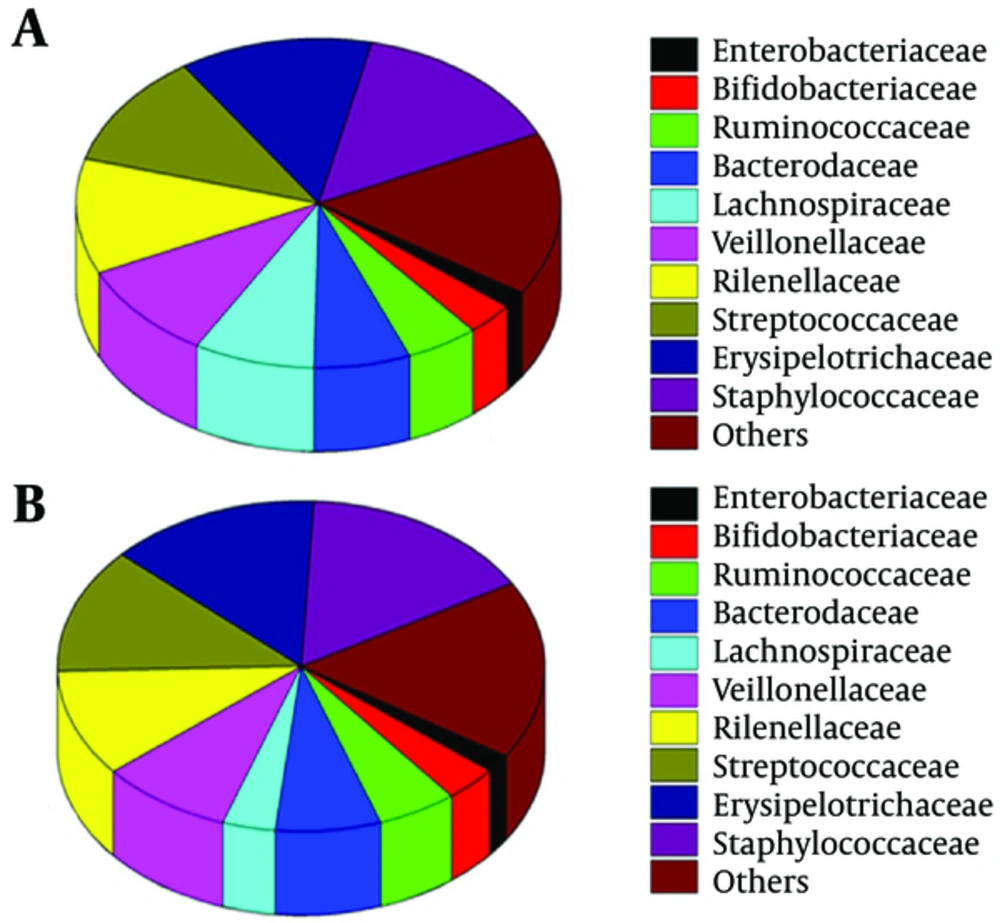
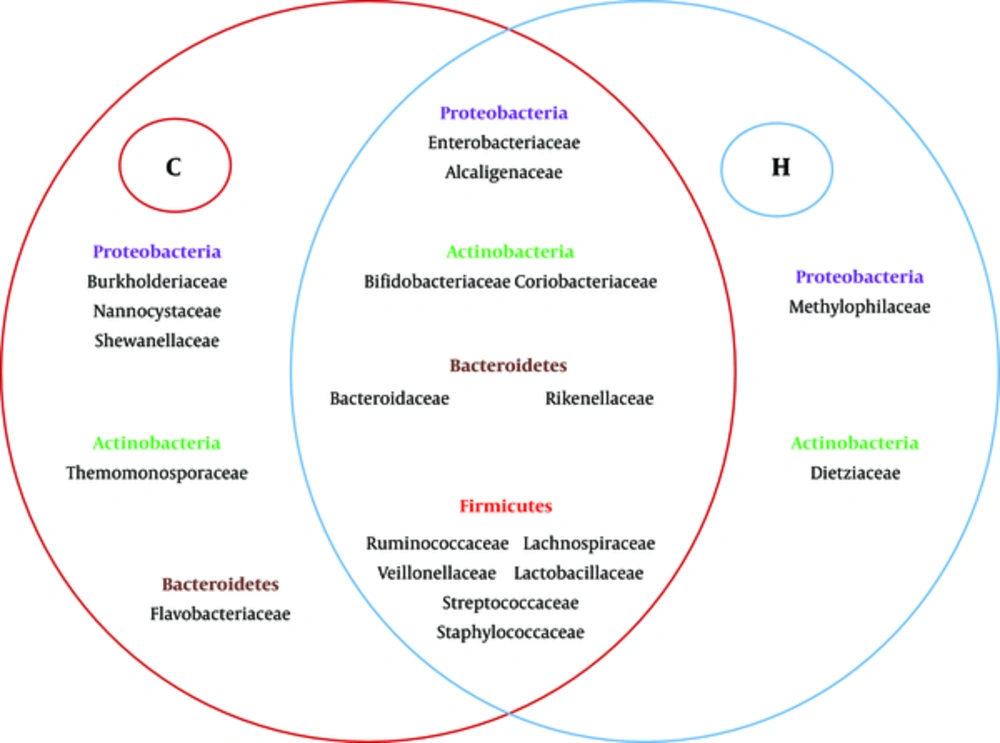
The study also found some differences in abundance at the family level between the two groups (Figure 3) Ruminococcaceae (38.01%) were the dominant bacteria in the group C, while Enterobacteriaceae and Streptococcaceae were the dominant bacteria in the group H (28.97% and 25.56%). The percentages of Veillonellaceae and Rikenellaceae were very low (3.38% vs 1.37%, 1.37% vs. 1.01%) in the two groups. Group C had significantly higher numbers of Ruminococcaceae compared with the group H (38.01% vs 10.33%; P = 0.015). Furthermore, Burkholderiaceae, Nannocystaceae, Shewanellaceae, Thermomonosporaceae and Flavobacteriaceae were present exclusively in the group C, but vadinBB60, Methylophilaceae and Dietziaceae were only found in the group H (Figure 4).
There were 11 genera which accounted for more than 2% in each group (Table 2). In the group C, Bacteroides (15.84%, belong to Bacteroidetes) was predominant followed by Subdoligranulum (12.39%, belong to Firmicutes), Faecalibacterium (11.15%, belong to Firmicutes), Bifidobacterium (8.27%, belong to Actinobacteria) and others. In the feces of the healthy children, Escherichia-Shigella (28.78%, belong to Proteobacteria) was predominant followed by Bifidobacterium (10.47%, belong to Actinobacteria), Bacteroides (8.27%, belong to Bacteroidetes), Klebsiella (5.4 %, belong to Proteobacteria) and others. Subdoligranulum (Firmicutes) found in the feces of the group C was more abundant compared with group H (12.39% vs. 2.71%, P < 0.05).
| Genus | Group C | Group H |
|---|---|---|
| Escherichia-Shigella | 2.86 | 28.78 |
| Bifidobacterium | 8.27 | 10.47 |
| Bacteroides | 15.84 | 8.27 |
| Klebsiella | 2.60 | 5.40 |
| Lachnoclostridium | 5.42 | 4.03 |
| Faecalibacterium | 11.15 | 2.78 |
| Ruminococcus_2 | 5.59 | 3.16 |
| Subdoligranulum | 12.39 | 2.71 |
| Coprostanoligenes_group | 3.46 | 2.12 |
| Pseudobutyrivibrio | 3.76 | - |
| Ruminococcus_1 | 2.36 | - |
| Enterobacter | - | 2.76 |
| Streptococcus | - | 3.32 |
Abbreviation: CMPA, Cow milk protein allergy.
aValues are presented as (%).
4.4. Comparison of Relative Abundance Through LDA Score and Cladogram Analysis
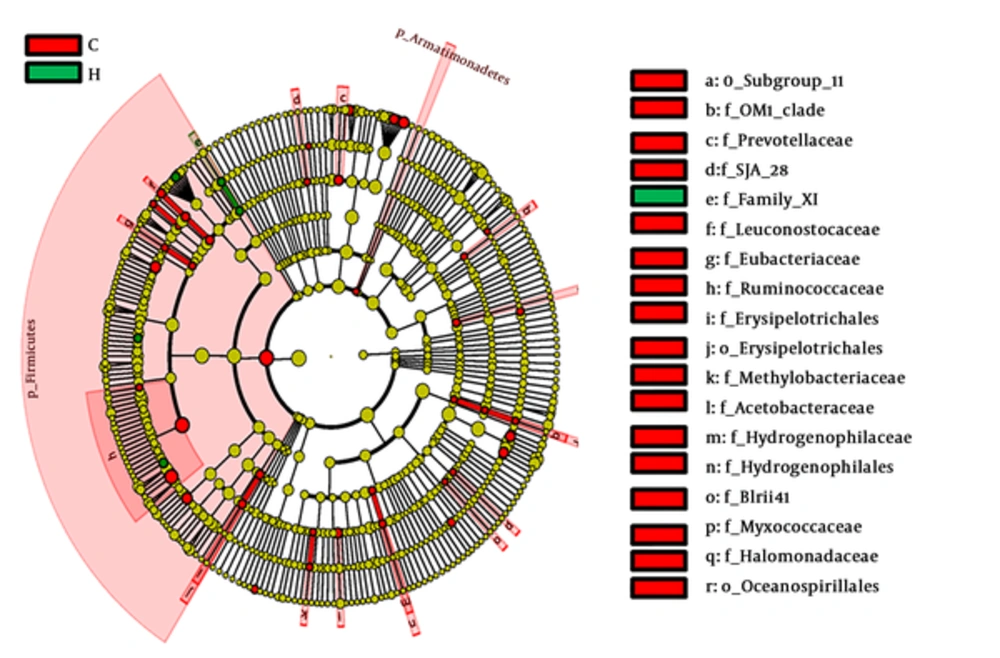
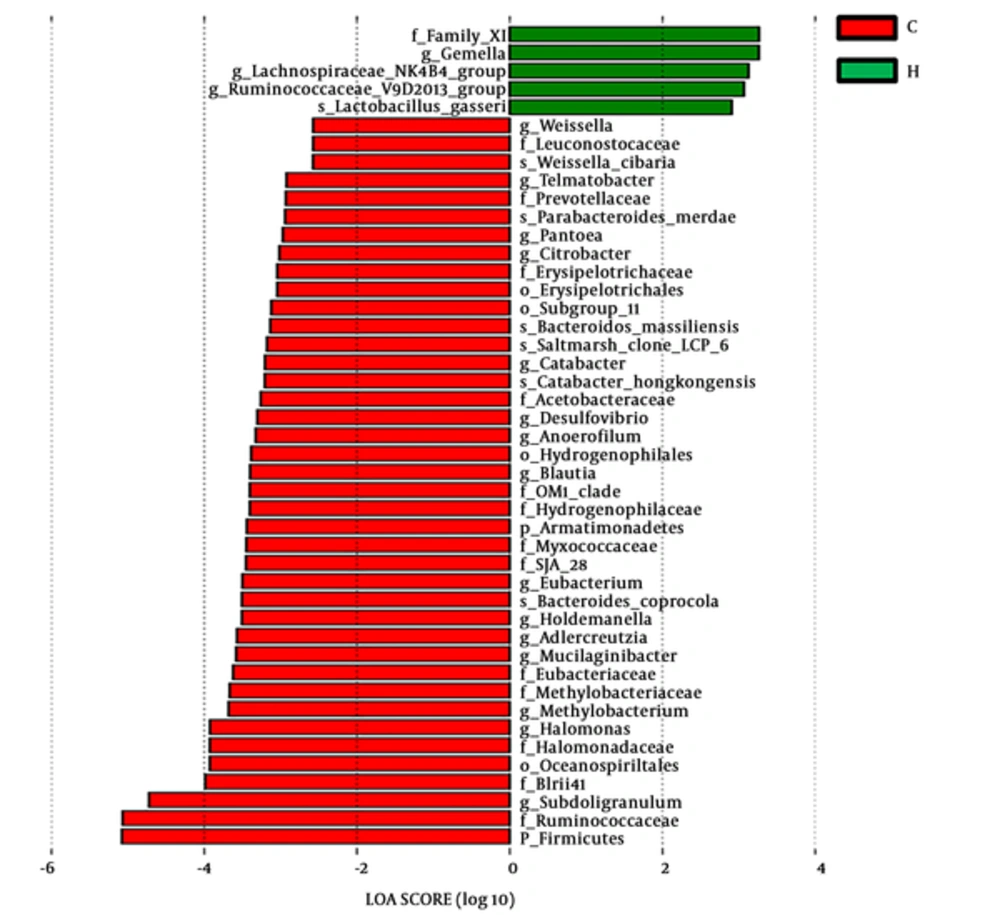
To identify the effect size of different abundant taxa between group C and group H, a metagenomic biomarker discovery approach (LEfSe) was utilized to analyze (29). The cladogram (Figure 5) showed that many co-exist taxa (shown in yellow) in two groups, and specific bacterial taxa were highlighted by colored circles and shaded areas (CMPA samples were shown in red and healthy samples were shown in green). The predominant taxa (LDA values > 2) of the two groups were displayed in Figure 6. The distribution histogram of LDA values showed 45 significantly enriched taxa, 40 and 5 taxa enriched in the feces microbiota of group C and group H respectively. Firmicute, Ruminococcaceae, and Subdoligranulum were mainly enriched taxa in group C. Family XI and Gemella were mainly enriched taxa in group H.
Linear discriminant analysis of effect size (LEfSe) identifies the most differentially abundant taxons between group C and group H (The enriched taxa in group C are indicated with a negative LDA score (red), and the enriched taxa in group H are indicated with a positive linear discriminant analysis (LDA) score (green). Only taxa meeting an LDA significant threshold of > 2 are shown).
4.5. Analysis of Fecal Lactic Acid and SCFAs
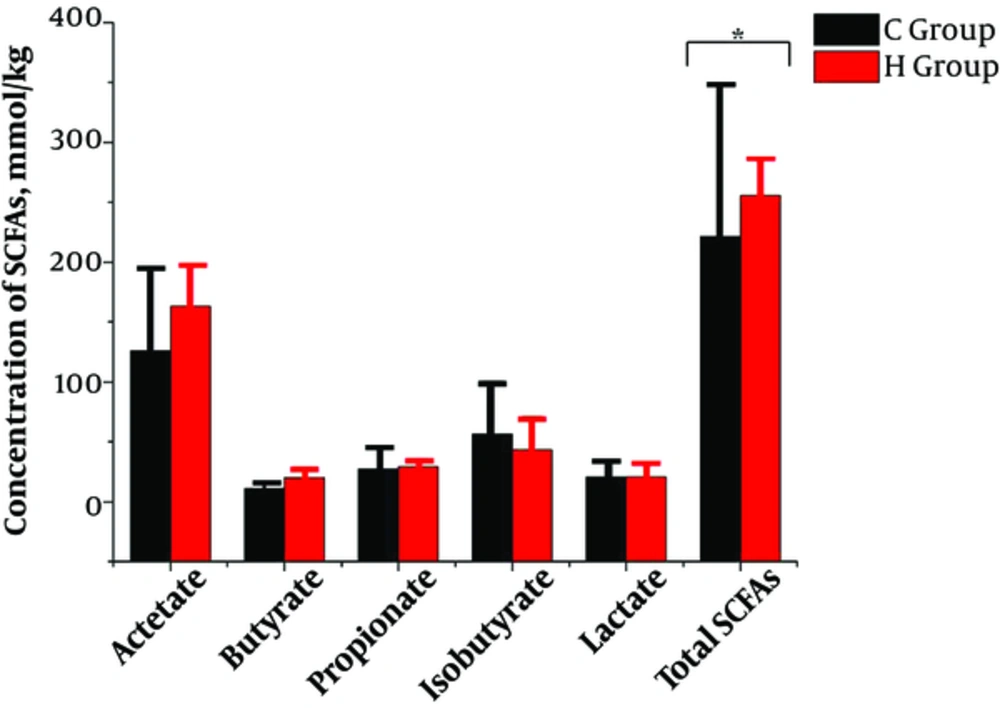
Total SCFAs in feces contents in group C was significantly decreased than in group H (221.33 mmol/kg vs. 255.95 mmol/kg), shown in Figure 7. Acetic acid was the dominant SCFA, followed by isobutyric and propionic acids. However, the difference between each of the SCFA and lactic acid in the two groups was not significant.
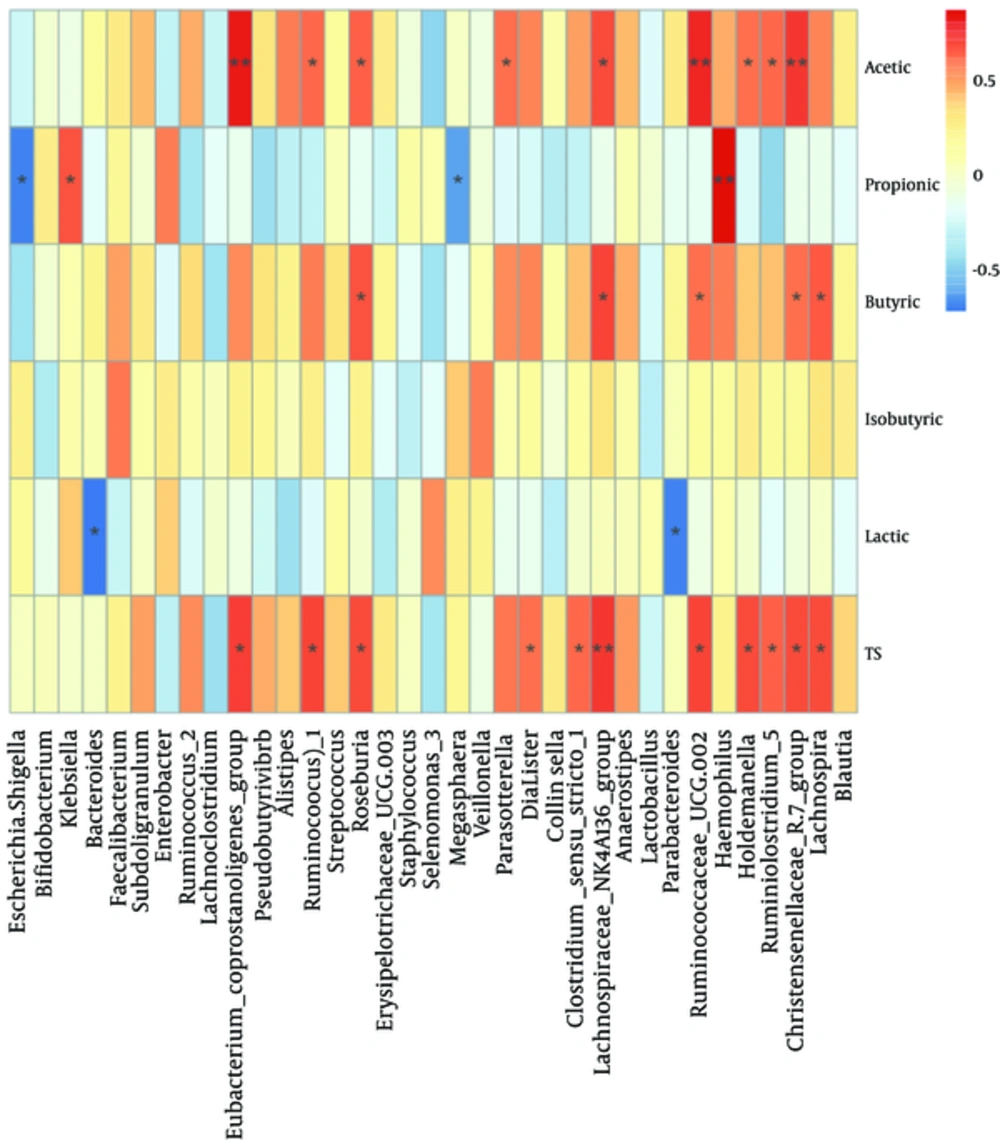
The relationship between the composition and abundance of fecal microbiota and SCFAs and lactic acid was analyzed. At family level (Appendix 2 in supplementary file), Lachnospiraceae 1 and Christensenellaceae were positively correlated with acetic acid, butyric acids and total SCFAs. Thermotogaceae were positively correlated with butyric acid, isobutyric acid and total SCFAs. Ruminococcaceae were positively correlated with acetic acid and Pasteurellaceae were significantly and positively correlated with negatively correlated with lactic acid (P < 0.01). Bacteroidaceae were negatively correlated with lactic acid. At genus level (Figure 8), Ruseburia, Christensenellaceae R-7 group, Lachnospiraceae NK4A136 group, and Ruminococcaceae UCG-002 were positively correlated with acetic acid, butyric acid and total SCFAs. Haemophilus was positively correlated with propionic acid, but Escherichia-Shigella was negatively correlated with propionic acids. Moreover, it was noteworthy that there was a negative relationship between Bacteroides and lactic acid.
5. Discussion
The majority of bacteria in human gut microbiota come from Proteobacteria, Firmicutes, Actinobacteria and Bacteroidetes (30), which was consistent with our study. The two groups of the research showed that most of sequences belong to the four most populated bacterial phyla mentioned above. Importantly, we found a significant increment of Firmicutes and depletion of Proteobacteria in fecal microbiota of CMPA children (P < 0.05). The facts are consistent with the results of a previous study showing that the high levels of Firmicutes in fecal microbiota of children with other food allergies such as egg allergy, wheat allergy, and peanut allergy (13). Moreover, Bunyavanich et al. found that gut microbiome composition in infancy (3 - 6 months) was associated with CMPA resolution, and the high abundance of Firmicutes was linked to immune tolerance in allergy (31).
The Clostridia class was found to be more enriched in group C than in group H in the present study. The high abundance of Clostridia was previously detected in a culture-based study, in which Clostridia had a connection with the development of allergy (32). Compared with germ-free mice, mice colonized with Clostridia had higher concentrations of fecal IgA. The colonization of Clostridia in gut microbiota reduced IL-22 production, which reduced the concentration of serum allergen (33). These conclusions may suggest that Clostridia took a vital part in the regulation of food allergy.
In a case-control PCR-DGGE-based study, Guo et al. found a lower degree of diversity of Bifidobacterium group in the feces of children with CMPA. Meanwhile, Bacteroides, Clostridium, and Escherichia coli were detected to be more abundant in the fecal microbiota of CMPA children than in healthy controls (14). In an elegant FISH-FC-based study, significantly higher proportions of the Clostridium coccoides group and Atopobium cluster were found in CMPA infant feces (21). However, these bacterial genera to be mentioned in the above studies had no significant difference between group C and group H in the study. The genus, Subdoligranulum, which belongs to the class Clostridia, was more abundant in the CMPA children than in the healthy children. The result implied that Clostridia played an important role in allergy maybe due to the presence of Subdoligranulum.
There was a lower concentration of total SCFAs in CMPA children than in control children in the study. SCFAs were mainly produced by bacteria in the intestine (19). The pattern of SCFAs will be changed with the altered gut microbiota (34). Changes in the fecal microbiota of CMPA children may be one of the reasons leading to a lower concentration of total SCFAs. Therefore, increasing the concentrations of SCFAs may be carried out by changing the composition of gut microbiota.
To our knowledge, some researches analyzed the correlation between gut microbiota and SCFAs, especially in allergy diseases (21, 35). The relationship between some special strains in the gut and SCFAs were clarified. Bacteroides are relatively sensitive to acidic pH, which grow poorly at pH 5.5 but grow well at pH 6.7 (36). An increase in lactic acid will lower the pH and may thus affect the growth of the Bacteroides. So it is reasonable to find that Bacteroides was negatively related to lactic acid in the study. In addition, the results also showed the correlation between SCFAs and bacteria at each taxonomic level of the intestine. Obviously, SCFAs and fecal microbiota were closely related and had a role to play in the remission of allergic diseases. Thus, the treatment that combined increased SCFAs and altered gut microbiota may be more helpful to the resolution of CMPA, and the further research on this may be needed.
5.1. Conclusion
The results of the study revealed the alterations of fecal microbiota in the CMPA of 5 - 8 years old children according to the culture-independent method. The fact that the concentration of total SCFAs was significantly decreased in the feces of CMPA children enriched our knowledge of the relationship between gut microorganisms and their metabolic productions. Furthermore, lactic acid was found to correlate negatively with Bacteroides. The results provide a possible basis for the further study of the relationship between CMPA and gut microbiota in 5 - 8-year-old children.

