


1. Background
Anthropometric parameters and their derived indices are commonly used by pediatricians in order to define the nutritional status and to assess the growth and development of children. Among these parameters, measurement of head circumference (HdC) has a crucial role in the pediatric clinical examination. The HdC is used for growth monitoring of the brain because cognitive functions, intra cranial volume and brain volume all are closely related to the magnitude of HdC (1-3). Rapid increase in the HdC is usually observed within the first few years of life which marks histological changes in the brain. Thus, it is suggested that the HdC measurement in children should be performed with care and should be recorded regularly.
The use of standard HdC charts is of paramount importance for any country. Over the last few decades, numerous studies with different populations have reported these charts e.g., Centers for Disease Control and Prevention (CDC) (4) and Rollins et al. (5) developed the HdC growth charts for the US population. Similarly, Kara et al. (6) and Elmali et al. (7) developed the HdC growth charts for the Turkish population and Ishikawa et al. (8) did for the Japanese children etc.
2. Objectives
In Pakistan, there is no local study that provides the HdC reference values. For clinical evaluations of the Pakistani children, such kind of data are needed. We therefore, designed the present study. Major purpose of the study is to develop the HdC growth references charts of the Pakistani children, aged 2 to 5 years. These reference values would be particularly useful for the child neurologists in Pakistan.
3. Methods
3.1. Study Population and Design
The present cross-sectional study of 1474 children, aged 2 - 5 years, was performed in the most populated province Punjab, Pakistan. Three major cities Lahore (a capital city of the Punjab), Multan (located in south of Punjab and is also identified at central point of Pakistan’s map), Rawalpindi and Islamabad (the capital city of Pakistan) were purposively selected. Because of good health care, educational facilities and job opportunities related to industrialization and public sector, the residents of Punjab are mostly migrants from the other regions of Pakistan. Therefore, the population pattern in Punjab is considered to be a good representative of the entire population of Pakistan.
Briefly, the studied children (under age of three years) were sampled from different public places like, markets, parks and transport stands etc. However, children of age 4 and 5 years were sampled from different public and private primary schools of the respective cities. The complete list of primary schools was taken from Punjab and Federal Department of Education (schools). A date for an educational institute visit was scheduled. The permission was granted from the school’s head, if any school’s administration refused to participate, next school was selected from the respective list. We also tried to ensure that our study sample could cover all the socio-demographic (economic) class of people and ethnicities of Pakistan. Some other details for the participants’ selection can be found in Asif et al. (9).
3.2. Ethical Concerns
After complete explanation of the objectives of the study to the schools’ heads and children’s parents or guardians, a written consent from each school’s head and a verbal consent was taken from each child’s parents or guardians. They had the right to voluntarily participate in or withdraw from the study. The study was approved by the Departmental Ethics Committee of Bahauddin Zakariya University, Multan, Pakistan.
3.3. Data Collection
The data collection activity was completed during March to June, 2016 by three well-trained data collection teams, supervised by the principal investigator. The required information was taken through a self-administered questionnaire. The demographic information like gender status (boys/girls) and age (rounded to next year) of children were recorded from school register with the assistance of class teacher. The ages of the children whose measurements were taken from public places, were confirmed from their parents or guardians at the time of interview. Following the available standard techniques (10), the measurement of HdC (to the nearest 0.1 cm) was made using a non-stretch tape. The tape was carefully wrapped on a line passing over the glabella to the area near the top of the occipital bone as to get maximum circumference. During these measurements, the participated child was in standing position and was asked to look straight ahead with shoulders in normal position.
3.4. Inclusion Criteria
All the normal children 2 - 5 years old, who were not taking any medicines and having no physical disability or fever were included in the study. All the children who did not meet these criteria were excluded.
3.5. Statistical Analysis
For the descriptive analysis, mean ± standard deviation (SD) of HdC were computed for each sex, varying at different ages. Two-sample independent t-test was used to test the mean HdC difference between boys and girls. For computation of the reference values of HdC, internationally accepted statistical method, called “the LMS method” developed by Cole (11, 12), was used. This method uses three quantities; the power (L), median (M) and co-efficient of variation (S) calculated for each age and the method is based on the assumption that after applying the Box-Cox transformation, the data at each age are normally distributed. After getting the smoothed values of L, M, and S by using a cubic spline function for each age, a required percentile value (C) was calculated by using the equation C = M (1 + LSZ)1/L. where Z is the Z-score of the normalized distribution e.g., for the 3rd, 50th and 97th percentile values, Z was substituted as -1.88, 0.00 and 1.88, respectively (11). The software, “Statistical Package for Social Sciences (SPSS)” version 21.0 was used for computing the descriptive statistics and for applying t-test. However, R-language version 3.4.0 was used for estimating L, M and S values. A P value < 0.05 was considered as statistically significant in the analyses.
4. Results
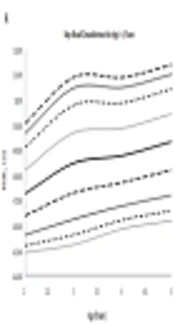
In the present study, a total of 1474 children (38.5% boys and 61.5% girls), aged 2 to 5 years, were participated. The mean ± 1SD HdC of the total subjects was 48.51 ± 1.79 cm and the mean values were significantly higher for the boys (P < 0.01) than for the girls at each age. The mean, SD and smoothed percentile values of HdC for the Pakistani boys and girls are presented in Table 1 and their curves are presented in Figure 1A and B, respectively. There were some notable differences in shapes of the HdC curves for both sexes. For the boys, the upper percentile values start with sharp increase from the starting age of 2 years and with little increase after 3 years age. For the girls, these upper values tend to be more increasing after the age of 3 years. We also compared the 50th percentile of our cross-sectional data with data from the World Health Organization (WHO) (13) and Neyzi et al. (14) in Figure 2A and B. The HdC for the Pakistani children for both boys and girls, was lower than the reference values from the latter stated studies.
| Age, y | Smoothed Percentiles | Mean ± SD | ||||||||
|---|---|---|---|---|---|---|---|---|---|---|
| 3rd | 5th | 10th | 25th | 50th | 75th | 90th | 95th | 97th | ||
| Male | ||||||||||
| 2 | 44.90 | 45.17 | 45.60 | 46.36 | 47.24 | 48.18 | 49.08 | 49.65 | 50.03 | 47.40 ± 1.36 |
| 3 | 45.21 | 45.61 | 46.22 | 47.27 | 48.45 | 49.65 | 50.76 | 51.43 | 51.86 | 48.47 ± 1.77 |
| 4 | 45.84 | 46.20 | 46.75 | 47.68 | 48.75 | 49.84 | 50.84 | 51.45 | 51.86 | 48.78 ± 1.60 |
| 5 | 46.16 | 46.56 | 47.17 | 48.18 | 49.30 | 50.40 | 51.39 | 51.97 | 52.35 | 49.28 ± 1.64 |
| Female | ||||||||||
| 2 | 44.74 | 45.11 | 45.67 | 46.50 | 47.27 | 48.15 | 49.07 | 49.70 | 50.15 | 47.38 ± 1.23 |
| 3 | 45.15 | 45.47 | 45.89 | 46.63 | 47.68 | 48.73 | 49.69 | 50.25 | 50.62 | 47.68 ± 1.56 |
| 4 | 45.35 | 45.56 | 46.00 | 46.94 | 48.10 | 49.40 | 50.72 | 51.58 | 52.19 | 48.25 ± 1.90 |
| 5 | 45.51 | 45.86 | 46.42 | 47.40 | 48.56 | 49.80 | 51.00 | 51.75 | 52.26 | 48.65 ± 1.80 |
Mean ± SD and Smoothed Percentile Values (3rd to 97th Percentiles) of the HdC (cm)

Growth curves for head circumference percentiles for both boys and girls using the LMS method
, Neyzi et al. (<a href=\"#A84970REF14\">14</a>) and this study")
5. Discussion
Child growth monitoring during early ages, especially from birth to 5 years, is very crucial. The HdC in this age-group is potentially considered as one of the most significant markers of normal growth and development and a powerful predictor of total brain volume in children (15). Some pediatric investigators (16, 17) also used HdC measurement for screening the nutritional status of children under five years of age. Therefore, some suitable knowledge of normal growth of HdC is essential to detecting and preventing pathological conditions. We designed this cross-sectional study for the Pakistani children to evaluate HdC growth using a standardized measurement technique.
To the best of our knowledge, there are no data available about the reference values of HdC for under five year aged children in the developing countries including Pakistan. We therefore, try to compare the obtained results with some foreign researches (6, 7, 13, 14, 18). Our study results showed that the mean HdC values of the boys were significantly higher than those of the girls at all ages. The most recent study with the Turkish children (6) also observed the similar results for the mean values of HdC.
In the present study, the percentile values (3rd to 97th) of HdC were moving upward in both sexes with age. The boys had more increase in HdC for the 3rd, 5th, and 50th percentiles than the girls had and for the upper percentiles, the similar patterns were also observed except for the 95th and 97th percentiles. These findings were consistent with a study (7) of the Turkish children, aged 0 - 84 months.
A study about the US children (18) showed that for the age of 2 to 5 years, the total increase in boys’ HdC for the 5th, 50th and 95th percentiles were 1.71 cm, 1.8 cm and 1.75 cm, respectively and in girls’ HdC were 2.0 cm, 2.03 cm and 2.34 cm, respectively. In our study, the total increase in boys’ HdC for the same percentiles were higher (except for the 5th percentile) i.e., 1.39 cm, 2.06 cm and 2.32 cm, respectively and in girls’ HdC were lower i.e., 0.75 cm, 1.29 cm and 2.05 cm, respectively.
The 50th percentile values for the HdC were also compared with the data from WHO (13) and with a Turkish study (14). The results indicated that the HdC reference values for the Pakistani children were greatly smaller than the corresponding international values. A study by Mushtaq et al. (19) also gave the comparison of height, weight and BMI percentiles with the WHO sample (13) and reported the major disparity in somatic growth of the Pakistani children. These low HdC percentile values are of great concern and it is mandatory to discuss such large difference here. Firstly, over the globe, children grow differently due to the differences in genetics and environmental factors (20). Therefore, the HdC growth in children may differ considerably, from country to country. Several studies (21, 22) also demonstrated the differences in the HdC among countries and between different ethnic groups of the same country. Present difference in the HdC values of our study may due to these visible factors. Secondly, Pakistan is also an improvised and underdeveloped country. Children in Pakistan are not growing satisfactorily due to poverty and lack of education in females. In addition, among various families in Pakistan, mothers do not have any knowledge about the importance of breast feeding, weaning diet, proper age of weaning or concept of balance diet and basic concepts of hygiene and prevention of diseases. Consequently, their children do not approach the normal growth level. These might be the reasons for the Pakistani children in this study for not meeting the same growth of HdC as mentioned in the WHO reference data.
5.1. Study Limitations
Firstly, the current study did not include the HdC data of children under the age of two years and the results of this study suggest that this gap might be filled. Secondly, the age of the children in this study was recorded in years. On the other hand, three months interval in early ages has great importance for growth monitoring in children. Therefore, age should be recorded and reported in months in future studies.
5.2. Conclusions
In this research, we presented HdC reference values and growth charts, based on a cross-sectional sample of 1474 Pakistani children, aged 2 - 5 years. It was reported that the boys had significantly larger mean HdC values as the girls had. The results showed that the reference values for HdC were smaller than the corresponding reference values provided by WHO. It is suggested that each country should produce its own HdC growth charts because the charts of other countries, used as standards may provide misleading information of the children population under study. Furthermore, due to the some inconsistencies between the present results with the other studies, we recommend that some more extensive and longitudinally studies covering a wider age range should be designed for the Pakistani children in order to determine the standard HdC charts.
