


1. Background
Lead is one of the dangerous heavy metals unnecessary for the human body (1). It is hazardous at any level and can cause many neurodevelopmental deficits in children (2). If lead is found in the body at any amount, it suggests contamination. The children’s bodies absorb heavy metals even more than adults (3, 4). The most common cause of lead poisoning in children is hand-mouth contact and the gastrointestinal tract is the greatest entrance of lead into the body (2, 5). Children may also be poisoned through inhalation, toys, painted surfaces, water contaminated with lead, cigarette smoke, cosmetic and makeup material (3, 4, 6). Lead poisoning in children can cause different gastrointestinal problems (7). The measurement of blood lead level (BLL) is the gold standard method for evaluation of lead poisoning (7). According to Centers for Disease Control and prevention (CDC) and American Academy of Pediatrics (AAP) lead poisoning is considered when BLLs are ≥ 5 μg/dL (1). On the other hand, lead screening levels ≥ 2μg/dL indicate significant lead exposure (8, 9). About 99% of children with lead poisoning are identified by screening methods (7). Increasing BLL in children has a negative impact on their behavioral (7). Functional gastrointestinal disorders (FGID), especially constipation and abdominal pain, are the most common pediatric problems (10-12). Organic disorders include those secondary to anatomical anomalies, physiological problems, inflammation, tissue damage or malignancy. Non-organic or functional disorders are diseases that have no known cause (12). According to the Rome III criteria (13), functional gastrointestinal disorders (FGID) can be classified into several categories. Particularly, chronic functional abdominal pain and chronic functional constipation based on this classification have diagnostic relevance (13). There is a persistent or episodic abdominal pain that could not be categorized in other FGIDs, so that the cause remains unknown (11, 13). The criteria for chronic functional constipation include defecation less than two or fewer times a week, history of withholding posturing, painful defecation, hard fecal defecation, huge fecal impaction in the rectum, large diameter fecal, that could not be categorized in Irritable bowel syndrome (IBS) (11, 13).
2. Objectives
The aim of this study was to compare BLLs in children with chronic non-organic abdominal pain, chronic non-organic constipation and non-organic growth retardation with healthy children and also whether there is a connection between BLLs and these functional disorders.
3. Methods
This is a cross-sectional study. The population consisted in a case group of children aged 2 - 14 years affected with non-organic chronic constipation, non-organic chronic abdominal pain or non-organic growth retardation. All cases were handled by the Besat Hospital, Pediatric Gastrointestinal Clinic, Sanandaj (Iran) during 2013 - 2014. The control group was recruited from the healthy children referred to the pediatric clinic for routine examinations. Both groups were matched for age and sex. These disorders were non-organic and therefore were collected in a group and compared with the control group consisting of healthy children. The previous studies had suggested that lead toxicity may be involved in the non-organic gastrointestinal disorders. In this study, any exposure to lead has been considered, including direct contact with painted surfaces, toys, water contaminated with lead, inhalation due to cigarette smoke, cosmetic and makeup material. The sample size was fifty-five in each group and the sampling method was objective but non-probable. This means that the samples have not been randomly selected; children with gastrointestinal disorders have been selected as the case group and healthy children as the control group. The history, physical examination, and paraclinical evaluations (including tests and imaging) have been used to distinguish organic causes of disorders from non-organic. A young age had no conflict with functional causes but required more evaluation.
The inclusion criteria were: children aged 2 - 14 years with non-organic chronic constipation (painful defecation with huge stool volume lasting for two or more weeks (12)), non-organic chronic abdominal pain (at least one pain attack per month for three consecutive months, with interference in daily routine (12)) or non-organic underweight (weight for age less than -2 standard deviation (14)). The exclusion criteria were: children with known organic causes of abdominal pain [including: gastroesophageal reflux disease (GERD), peptic disease, cholecystitis, cholelithiasis (gallstones), pancreatitis, appendicitis, renal stones (nephrolithiasis), peritonitis, inflammatory bowel disease (IBD) and gastroenteritis], known organic causes of chronic constipation (including Hirschsprung’s disease, bowel obstruction, congenital anatomical stenosis, anal stenosis, imperforate anus, anterior displacement of the anus, hypothyroidism) and known organic causes of growth retardation [including: celiac disease, hypothyroidism, hyperthyroidism, hypopituitarism, short stature, cystic fibrosis (CF), chronic infection, Metabolic disorders, genetic abnormalities]. History of abdominal trauma and surgery, medications used in the past months (including anti-epileptics, laxatives, anti-cholinergic, antibiotics, appetizers, corticosteroids), abnormal paraclinical evaluations (complete blood count, urinalysis, stool examination, biochemistry, liver function tests, serum amylase and lipase, thyroid function tests, abdominal ultrasound). Patients with anemia were not excluded from the study, as it can be caused by lead poisoning. The normal range of hemoglobin in childhood varies by age and sex and anemia is considered if hemoglobin concentration is less than 2 standard deviations (SD) for mean of age and sex (15). A written conscious consent was obtained from the patients and their parents. Then a questionnaire was used to collect the demographic characteristics. Some variables were considered in this study including: qualitative nominal variables (such as: sex, gastrointestinal disorders, anemia and living in old houses), qualitative ratio variables (such as: level of parental education), quantitative relative variables (such as: blood lead level and family income) and quantitative interval variables (such as: age). Afterwards, 3 ml heparinized venous blood sample was taken for measuring the BLL. Measurement of lead was performed by atomic absorption spectrophotometer of 3030 PERKIN ELMER with HCG. The lead was calculated based on the micrograms per deciliter.
These disorders were evaluated with following methods: constipation was determined by electing information on frequency of bowel movements, stool consistency and stool volume. Abdominal pain was also determined by questioning about the intensity of pain assessed according to the Wong-Baker face scale system (16) (Figure 1). Weight was measured by scale, and growth retardation (weight for age) was determined by growth chart. The study protocol was approved by the ethics committee of Kurdistan University of Medical Sciences (approval number: 14/16183/4112-93/7/21).

The Wong-Baker faces scale systems
3.1. Statistical Analysis
The data were analyzed by SPSS version 20 software. The absolute and relative frequency, mean and standard deviation were used to interpret descriptive data. Independent t-test was used to compare quantitative variables including lead levels between the groups. We also used chi-squire and Fisher tests to analyze the qualitative variables. Odds ratio (OR) and confidence interval of 95% were calculated to determine the relationship between the BLLs with gastrointestinal disorders. The P value less than 0.05 was considered statistically significant.
4. Results
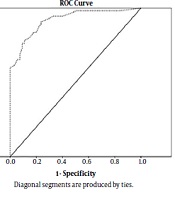
This study was performed on two groups of 55 children each, matched for age and sex. Twenty-three patients had BLLs above 5 μg/dL, all of them being in the case group. In this group, only one patient had BLL greater than 10 μg/dL. The most common complaints are shown in Table 1. Among them, chronic constipation (21 cases 38.2%) is at the top. The mean BLLs was different in both groups (4.34 µg/dL vs. 1.19 µg/dL) and this difference according to the independent t-test was statistically significant (P = 0.0001), with OR = 35.63 (95% CI 9.78: 129.81). There was no statistically significant relationship between sex and age with BLLs (P = 0.47 vs. P = 0.21). Table 2 summarizes the sensitivity and specificity values of different BLLs in the diagnosis of gastrointestinal disorders. The sensitivity and specificity of BLLs at the 1.25 µg/dL for diagnosis of gastrointestinal disorders was 94.5 and 66.3 respectively, and positive and negative predictive value was 74.3 and 92.5 respectively. Figure 2 is a ROC curve demonstrating the diagnostic value of BLLs in pediatric gastrointestinal disorders. The ROC curve allows the comparison of the actual positive and false positive results at each point on the curve. In this figure the area under the curve for BLLs was calculated at 0.785 (95% of confidence interval was 0.721 - 0.849) (P < 0.001). The best diagnostic point for BLLs was 0.325. At this level, the sensitivity, specificity, positive predictive value and the negative predictive value were 94.5%, 67.3%, 74.3% and 92.5%, respectively. The most common level of parental education in both groups was high school diploma. The education level of parents in both groups was not significantly different by using the Fisher’s test: P = 0.27, (father’s education) and P = 0.56, (mother’s education). Most of these families had an income below 400 USD per month. According to chi-square test, there was no significant difference between family income levels in both groups. (P = 0.051) Anemia was observed in 17 (73.9%) vs. 11 (12.6%) patients of case and control groups with OR = 19.5 (95% CI 6.35: 60.3). That difference was statistically significant according to chi-square test (P = 0.0001). Ten (18%) children in the case group and fourteen (25.4%) of the control group lived in old houses with OR = 4 (95% CI 1.47: 10.93). This difference was statistically significant too (P = 0.005).
| Symptoms | No. (%) | Total N |
|---|---|---|
| Constipation | 21 (38.2) | 21 |
| Weight gain disorders | 7 (12.7) | 7 |
| Abdominal pain | 8 (14.5) | 8 |
| Constipation + weight gain disorders | 7 (12.7) | 7 |
| Constipation + abdominal pain | 10 (18.2) | 10 |
| Weight gain disorders + abdominal pain | 1 (1.8) | 1 |
| Constipation + weight gain disorders + abdominal pain | 1 (1.8) | 1 |
| Total | 55 (100) | 55 |
Frequency of Symptoms in Case Group (with Gastrointestinal Disorder)
| Lead Level | Sensitivity | Specificity |
|---|---|---|
| 0.500 | 1.000 | 1.000 |
| 0.550 | 0.982 | 0.174 |
| 0.650 | 0.982 | 0.246 |
| 0.750 | 0.982 | 0.345 |
| 0.850 | 0.982 | 0.418 |
| 0.950 | 0.982 | 0.491 |
| 1.050 | 0.945 | 0.600 |
| 1.150 | 0.945 | 0.655 |
| 1.250 | 0.945 | 0.673 |
| 1.400 | 0.927 | 0.709 |
| 1.550 | 0.909 | 0.754 |
| 1.650 | 0.891 | 0.754 |
| 1.750 | 0.873 | 0.782 |
| 1.850 | 0.836 | 0.800 |
| 1.950 | 0.836 | 0.818 |
| 2.050 | 0.800 | 0.855 |
| 2.150 | 0.782 | 0.891 |
| 2.250 | 0.764 | 0.891 |
| 2.350 | 0.764 | 0.909 |
| 2.450 | 0.727 | 0.909 |
| 2.550 | 0.691 | 0.927 |
| 2.650 | 0.673 | 0.927 |
| 2.750 | 0.655 | 0.927 |
| 2.850 | 0.655 | 0.945 |
| 2.950 | 0.618 | 0.964 |
| 3.050 | 0.600 | 1 |
| 3.350 | 0.582 | 1 |
| 3.650 | 0.564 | 1 |
| 4.100 | 0.545 | 1 |
| 4.550 | 0.491 | 1 |
| 4.750 | 0.455 | 1 |
| 4.950 | 0.436 | 1 |
| 5.050 | 0.418 | 1 |
| 5.450 | 0.364 | 1 |
| 5.850 | 0.345 | 1 |
| 5.950 | 0.291 | 1 |
| 6.150 | 0.236 | 1 |
| 6.400 | 0.218 | 1 |
| 6.550 | 0.182 | 1 |
| 6.800 | 0.164 | 1 |
| 7.350 | 0.127 | 1 |
| 7.900 | 0.109 | 1 |
| 8.300 | 0.091 | 1 |
| 8.550 | 0.055 | 1 |
| 8.850 | 0.036 | 1 |
| 11.550 | 0.018 | 1 |
| 15.000 | 0.000 | 1 |
Sensitivity and Specificity of Different Levels of Lead in the Diagnosis of Gastrointestinal Disorders in Children

ROC curve to investigate the diagnostic value of lead level in the recognition of pediatric gastrointestinal disorders
5. Discussion
Increasing BLLs in children has a negative effect on their behavioral, social and intellectual well-being. BLLs in the first year of life are predictive of the cognitive level in the coming years. On the other hand, the mood and hyperactivity are also affected by the high lead exposure (7). These effects are irreversible. Consequently, control and monitoring of environmental lead is fundamental for reducing the risk of exposure ro it (17). In general, studies in Iranian children are much more limited than other countries. In fact, the main source of lead contamination is still unclear in Iranian children (18).
Constipation was the most common complaint among our patients. Zaman and Hoseinzadeh (19) (Tehran) showed that constipation was the most common (37.4%) gastrointestinal disorder in students with a lead level > 10 μg/dL and that is consistent with our study. Unlike the results of Olewe et al. (Nairobi), we did not find a significant relationship between the levels of parental education in case and control groups (20). This difference is probably due to the patient selection in a particular city area. Kumar and Kesaree (21) (India) could not find a significant difference in the level of family income between the groups either. We recorded a significant difference in anemia. The odds ratio (OR) of anemia in the case group was 5.8-fold higher than in the control group. Among the previous studies, there are not many suggesting the difference in hemoglobin levels in children with lead poisoning. Only one study in China from 1994 to 2004 concluded that anemia was found in 47.8% of children with lead levels > 10 μg/dL (22). Queirolo et al. (Uruguay) demonstrated that 32.9% of children had lead levels ≥ 10μg/dL (23). Also showed that there is a significant relationship between BLLs and hematocrit (23). In our study, 10 (43.5%) children in the case group (patients with GI disorders) were living in old houses, while only 14 (16.1%) in the control group (patients without any GI disorders) lived in old houses, which was statistically significant. This could indirectly indicate the relationship between lead levels and living in old housing. The levels of lead in children who lived in an old house were significantly higher. This finding was consistent with Olewe et al.’s study (20). Jain (USA) showed that children who lived in rented homes had a higher BLLs (2). In our study, although the BLLs in the case group were higher than those in the control group (4.34 vs. 1.19 µg/dL), the mean BLLs were significantly different in both groups (P = 0.0001). Olewe also observed that the mean BLLs were significantly different in the case and control groups (8.6 vs. 1.9 μg/dL) (20). Gastrointestinal symptoms in the case group were present despite that BLLs were less than 10 μg/dL. It was different from the cut-off point of lead level (≥ 10 µg/dL) defined in the various referrals (1). We measured different thresholds of BLLs in patients with different sensitivity and specificity (Table 2). The BLLs of 2 μg/dL had a specificity of 85.5% and a sensitivity of 80%. This lead level, according to the literature, is equivalent to lead exposure (10). There is a significant difference between the groups in the BLLs 1.25 μg/dL. In our study, based on the ROC curve, the 1.25 μg/dL was obtained instead of 5 μg/dL. At this level, the sensitivity is 94.5%. Therefore, in our study, a value about 1.25 μg/dL had more sensitivity. According to some references (7-9), BLLs more than 2 μg/dL are indicative of exposure. On the other hand lead poisoning is expected to occur at BLLs higher than 5 μg/dL. It is important to note that lead poisoning at BLLs less than 5 μg/dL is also seen (7).
We found that the BLLs in children with chronic non-organic gastrointestinal disorders are higher than in the healthy children. There were also significant differences between the groups, in terms of anemia and living in old housing, which may be associated with higher lead levels in the case group. However, lower BLLs (less than 5 μg/dL) and the presence of gastrointestinal disorders reinforce the hypothesis that lower serum lead level may does not rule out lead poisoning in children. This study shows the importance of assessing BLLs in children with gastrointestinal problems with unknown causes. We suggest that more extensive and long-term studies be conducted to assess the level of lead poisoning.
One of the most important limitations of the study was the small number of cases, which led to prolongation of the study period. A wide diagnostic evaluation was necessary to rule out underlying causes and establish the functional disorders, and for this reason, the sample size of our study was small. The behavioral disorders (e.g. pica) were the most important confounding factors. Pica is characterized by tendency of the patient to eat a variety of non-nutritional materials such as soil, wall plaster, wall paint, etc. This can increase the risk of lead poisoning. These children were excluded from the study.
