

1. Background
Cytitis is the inflammation of bladder which occurs most commonly by bacteria. It is usually presented with suprapubic pain, dysuria and a burning sensation on urination. While diagnosis is made by the detection of leukocytes and bacteria in urine, bladder wall thickening and fine nodule-shaped echoes within the bladder are the sonographic findings of cystitis (1, 2).
As the lower urinary tract infection is more common and clinical findings are less helpfull in children.
2. Objectives
In this study we aimed to compare the diagnostic values of sonographic findings of cytitis in infants by correlating it with urinalysis results.
3. Methods
Medical records of a total of 2215 infants between 2 and 24 months old who underwent an ultrasound examination of urinary tract and urinalysis at the same day in a tertiary pediatric hospital between March 2016 and August 2017, were retrospectively screened. The patients with congenital urinary tract abnormalities or urinary calculus or increased renal echogenicity or recently (closer than 2 weeks prior to the ultrasound examination and urinalysis) antibiotic consumption history or recently (closer than 2 weeks prior to ultrasound examination and urinalysis) trauma-dehydration history or free intraperitoneal/periovarian fluid or a body temperature higher than 38 Celcius degrees measured with an ear thermometer, also patients in whom the bladder was empty and was not evaluated by ultrasound examination, were excluded from the study. Because echogenic foci may also result from many other conditions including dehydration, hemorrhage and multiple diseases (3), patients with such conditions were excluded from the study as well. Finally a total of 1094 patients (11.98 ± 6.73 (2 - 24) months old were included in the study. Male/female rate was 0.90 (517/577).
All the patients underwent an urinary system ultrasound imaging by using a 12 MHz linear probe (Aplio 500, Toshiba Medical Systems, Tochigi-Ken, Japan) in supine position. Ultrasound images were interpreted by two radiologists blinded to urinalysis results who had 4 years of experience in pediatric urology. At the same day of ultrasound imaging, a complete urinalysis was performed.
3.1. Assessement of the Bladder Wall Thickness
Because bladder wall thickness changes with distention, we assessed all the bladders when they were filled. Measurement was performed at the most thickened point, away from the trigone because trigone musculature increases the wall thickness in this region (4). Patients were classified as the groups as with a thickness < 3.9 mm (normal bladder wall) and thickness ≥ 3.9 mm (thickened bladder wall).
3.2. Assessement of the Bladder Lumen
The content of urine filled normal bladder must be seen anechoic by ultrasound imaging (5). The most common causes of presence of internal echoes in the lumen of bladder are dehydration, urinary tract infection, hemorrhage or frank pus (4). According to the presence of echogenic material in a filled bladder lumen, patients were classified as the groups with homogeneous anechoic bladder (normal) and heterogeneous bladder with multiple internal echogenic foci.
3.3. Assessement of Perivesical Fluid Collection
Free fluid formation in paravesical space may be due to trauma/hemorrhage and inflammation/peritonitis (2). Perivesical fluid collection was defined as the presence of anechoic fluid close to bladder walls. Also patients with fluid in periovarian region or free intraperitoneal fluid were excluded from the study. Patients with a recent trauma history were excluded from the study as well. The patients were classified as those with perivesical fluid collection and as those with no perivesical fluid collection
3.4. Assessement of Urinalysis
Analysis of the urine was performed with a complete urinalysis which included both rapid dipstick method and urine macroscopic examination. All the urinalyses were performed by using fresh urine with maintenance at room temperature < 1 hour after urine collection or < 4 hours at refrigeration. The automatic urine dipstick test detected the presence of leukocytes, nitrite and leukocyte esterase. Microscopic evaluation also detected presence of white blood cells (WBC) and bacteria. Pyuria was defined as detection of WBC ≥ 5/hpf by microscopy using centrifuged urine. The patients were classified as the group with pathological urinalysis results with pyuria and/or bacteriuria and/or positive nitrite test and/or positive leukocyte esterase test and the group with normal urinalysis results.
3.5. Statistical Analysis
SPSS 25.0 program was used for statistical analysis. Qualitative variables were presented as counts and percentages. Quantitative variables were presented as mean, standard deviation, minimum and maximum values. The differences between exact test results of the groups and subgroups which were classified according to ultrasound findings was compared by column proportions tests.
4. Results
Control group (N) consisted of 713 patients whose ultrasound examination was normal (no bladder wall thickening and no echoes in the lumen of bladder and no perivesical fluid). Among these 713 patients, 98 had pathological urinalysis results. The pathological urinalysis rate was 13.7%. In this group sensitivity was 0.597, and specificity was 0.723 for pathological urinalysis results.
Perivesical fluid group (P1) consisted of 43 patients whose ultrasound examination revealed only perivesical fluid without either bladder wall thickness or echoes in the lumen of bladder. Among these 43 patients, 8 had pathological urinalysis results. The pathological urinalysis rate was 18.6%. When compared with control group, pathological urinalysis rate was higher but it was not statistically significant. In this group sensitivity was 0.033, and specificity was 0.959 for pathological urinalysis results.
Bladder wall thickness group (P2) consisted of 170 patients whose ultrasound examination detected only thickened bladder wall (≥ 3.9 mm) without either perivesical fluid or echoes in the lumen of bladder. Among these 170 patients, 62 had pathological urinalysis results. The pathological urinalysis rate was 36.5%. When compared with control group (N) pathological urinalysis rate was higher and this difference was statistically significant (P < 0.05). In this group, sensitivity was 0.255 and specificity 0.873 for pathological urinalysis results.
The lumen group (P3) consisted of 116 patients whose ultrasound examination showed only echoes within the bladder lumen without either perivesical fluid or thickened bladder wall. Among these 116 patients, 48 had pathological urinalysis results. The pathological urinalysis rate was 41.4%. When compared with control group (N) pathological urinalysis rate was higher and this difference was statistically significant (P < 0.05). In this group, sensitivity was 0.198 and specificity 0.920 for pathological urinalysis results.
Fluid or thickened wall or echoes group (P4) consisted of 319 patients whose ultrasound examination detected perivesical fluid or thickened bladder wall or echoes in the lumen of bladder. Among these 319 patients, 118 had pathological urinalysis results. The pathological urinalysis rate was 37.0%. When compared with control group (N) pathological urinalysis rate was higher and this difference was statistically significant (P < 0.05). In this group, sensitivity was 0.481 and specificity 0.764 for pathological urinalysis results.
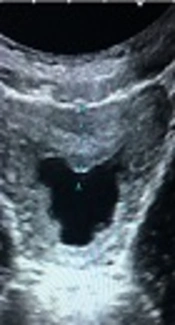
Fluid and thickened wall group (P5) consisted of 11 patients whose ultrasound examination detected perivesical fluid and thickened bladder wall without echoes in the lumen of bladder (Figure 1). Among these 11 patients 5 had pathological urinalysis results. The pathological urinalysis rate was 45.5%. When compared with control group (N) pathological urinalysis rate was higher and this difference was statistically significant (P < 0.05). In this group, sensitivity was 0.021 and specificity 0.993 for pathological urinalysis results.
 and perivesical fluid (arrows) are seen")
Bladder wall thickening (5, 7 mm) and perivesical fluid (arrows) are seen
Fluid and echoes group (P6) consisted of 9 patients whose ultrasound examination detected perivesical fluid and echoes in the lumen of bladder without thickened wall of bladder (Figure 2). Among these 9 patients, 4 had pathological urinalysis results. The pathological urinalysis rate was 44.4%. When compared with control group (N) pathological urinalysis rate was higher and this difference was statistically significant (P < 0.05). In this group, sensitivity was 0.016 and specificity 0.994.
. Perivesical fluid is seen (arrows)")
Internal echoes within the bladder which has normal wall thickness (3.0 mm). Perivesical fluid is seen (arrows)
Thickened wall and echoes group (P7) consisted of 22 patients whose ultrasound examination detected thickened bladder wall and echoes in the lumen of bladder without perivesical fluid (Figure 3). Among these 22 patients, 12 had pathological urinalysis results. The pathological urinalysis rate was 54.5%. When compared with control group (N) pathological urinalysis rate was higher and this difference was statistically significant (P < 0.05). In this group sensitivity, was 0.049 and specificity 0.988 for pathological urinalysis results.
")
Internal echoes in the lumen of bladder with thickened wall (4.5 mm)
Thickened wall and echoes and fluid group (P8) consisted of 10 patients whose ultrasound examination detected thickened bladder wall and echoes in the lumen of bladder and perivesical fluid (Figure 4). Among these 10 patients, 6 had pathological urinalysis results. The pathological urinalysis rate was 60.0%. When compared with control group (N) pathological urinalysis rate was higher and this difference was statistically significant (P < 0.05). In this group sensitivity was 0.025 and specificity 0.995 for pathological urinalysis results. Statistical analysis results of all groups are detailed in Table 1.
. Also perivesical fluid is seen (arrows)")
Internal echoes in the lumen of bladder with thickened wall (4.1 mm). Also perivesical fluid is seen (arrows)
| Finding | N | P1 | P2 | P3 | P4 | P5 | P6 | P7 | P8 | Total |
|---|---|---|---|---|---|---|---|---|---|---|
| Control Group | Perivesical Fluid | Thickened Bladder Wall | Echoes in the Lumen | Fluid or Thickened Wall or Echoes In the Lumen | Perivesical Fluid and Thickened Bladder Wall | Perivesical Fluid and Echoes in the Lumen | Thickened Bladder Wall and Echoes in the Lumen | Thickened Wall and Echoes in Lumen and Perivesical Fluid | ||
| Patients | 713 | 43 | 170 | 116 | 319 | 11 | 9 | 22 | 10 | 1094 |
| Pathological urinalysis | 98 | 8 | 62 | 48 | 118 | 5 | 4 | 12 | 6 | 253 |
| Pathological urinalysis ratio, % | 13.7 | 18.6 | 36.5 | 41.4 | 37.0 | 45.5 | 44.4 | 54.5 | 60.0 | 23.1 |
| Sensitivity | 0.597 | 0.033 | 0.255 | 0.198 | 0.486 | 0.021 | 0.016 | 0.049 | 0.025 | |
| Specificity | 0.723 | 0.959 | 0.873 | 0.920 | 0.764 | 0.993 | 0.994 | 0.988 | 0.995 | |
| False negative rate | 0.403 | 0.967 | 0.745 | 0.802 | 0.514 | 0.979 | 0.984 | 0.951 | 0.975 | |
| False positive rate | 0.277 | 0.041 | 0.127 | 0.0080 | 0.236 | 0.007 | 0.006 | 0.012 | 0.005 | |
| Accuracy | 0.695 | 0.753 | 0.736 | 0.760 | 0.702 | 0.777 | 0.777 | 0.780 | 0.780 | |
| Positive predictive value | 0.381 | 0.186 | 0.365 | 0.414 | 0.370 | 0.455 | 0.444 | 0.545 | 0.600 | |
| Negative predictive value | 0.863 | 0.776 | 0.804 | 0.801 | 0.839 | 0.780 | 0.780 | 0.785 | 0.781 | |
| Positive hjlikehood ratio | 2.152 | 0.800 | 2.010 | 2.472 | 2.056 | 2.918 | 2.802 | 4.202 | 5.253 | |
| Negative likehood ratio | 0.558 | 1.009 | 0.853 | 0.872 | 0.673 | 0.986 | 0.989 | 0.962 | 0.980 |
Also patients in thickened wall group (P3) were classified to 3 subgroups according to their bladder wall thicknesses. The first subgroup (SG1) consisted of 92 patients whose ultrasound examination detected a bladder wall thickness between 3.9 and 4.9 mm. Among these 92 patients 31 had pathological urinalysis results. The pathological urinalysis rate was 33.6%. When compared with control group (N) (13.7%) pathological urinalysis rate was significantly higher (P < 0.05).
The second subgroup (SG2) consisted of 54 patients whose ultrasound examination detected a bladder wall thickness between 5.0 and 6.0 mm. Among these 54 patients, 19 had pathological urinalysis results. The pathological urinalysis rate was 35.1%.When compared with control group (N) (13.7%) pathological urinalysis rate was significantly higher (P < 0.05). However when compared with subgroup 1, pathological urinalysis rate was higher but this difference was not statistically significant (P > 0.05).
The third subgroup (SG3) consisted of 24 patients whose ultrasound examination detected a bladder wall thickness > 6 mm (Figure 5). Among these 24 patients, 12 had pathological urinalysis results. The pathological urinalysis rate was 50.0%.When compared with control group (N) (13.7%) pathological urinalysis rate was higher and this difference was statistically significant (P < 0.05). Also when compared with both subgroups 1 and 2, pathological urinalysis rate of subgroup 3 was higher and these differences were statistically significant (P < 0.05 for both). Pathological urinalysis rates of subgroups are summarized in Table 2.
 (subgroup 3) is seen")
Markedly thickened bladder wall (9.1 mm) (subgroup 3) is seen
| Bladder Wall Thickness 3.9 - 4.9 mm (SG1) | Bladder Wall Thickness 5.0 - 6.0 mm (SG2) | Bladder Wall Thickness > 6 mm (SG3) | |
|---|---|---|---|
| Pathological urinalysis numbers | 31 | 19 | 12 |
| Total cases number | n: 92 | n: 54 | n: 24 |
| Pathological urinalysis rate | 0.336 | 0.351 | 0.500 |
Also we compared the pathological urinalysis rates of males and females for each group. In all the groups pathological urinalysis rates of females was found to be higher than rates of males. The pathological urinalysis results of males and females are documented in Table 3.
| N | P1 | P2 | P3 | P4 | P5 | P6 | P7 | P8 | |
|---|---|---|---|---|---|---|---|---|---|
| Control | Perivesical fluid | Thickened bladder wall | Echoes in the lumen | Fluid or thickened wall or echoes in the lumen | Perivesical fluid and thickened bladder wall | Perivesical fluid and echoes in the lumen | Thickened bladder wall and echoes in the lumen | Thickened wall and echoes in lumen and periveical fluid | |
| Pathological male urinalysis | 23 | 2 | 13 | 13 | 28 | 1 | 1 | 3 | 2 |
| Total male patients | 371 | 12 | 75 | 39 | 126 | 4 | 4 | 8 | 4 |
| Pathological male urinalysis rate, % | 6.2 | 16.7 | 17.3 | 33.3 | 22.2 | 25.0 | 25.0 | 37.5 | 50.0 |
| Pathological female urinalysis | 75 | 6 | 49 | 35 | 90 | 4 | 3 | 9 | 4 |
| Total female patients | 342 | 31 | 95 | 77 | 193 | 7 | 5 | 14 | 6 |
| Pathological female urinalysis rate, % | 21.9 | 19.4 | 51.6 | 45.4 | 46.6 | 54.5 | 60.0 | 64.3 | 66.7 |
5. Discussion
Acute bacterial cystitis is the infection of bladder which usually occurs via ascending pathway. Rarely descending, hematogenous and contagious spread of the bacteria cause cystitis. The most common agents causing bacterial cystitis are E. coli and the other Enterobacteriaceae such as Enterobacter, Proteus mirabilis, Streptococcus, Klebsiella. Sonographic findings of cystitis includes fine nodule shaped echoes within the bladder and thickening of the bladder wall. But these findings are unreliable and can also be seen with other conditions (1).
Previous studies suggested a mean bladder wall thickness < 2 mm in healthy children by ultrasound imaging (6-8). Jeguier and Rousseau measured bladder wall in 410 children without complaints related to urinary system and they concluded that there is a linear relationship between bladder fullness and bladder wall thickness. They suggested the upper limits of a mean thickness of 3 mm when the bladder is full-filled and 5 mm when the bladder is empty (9). Because of the difficulties for assessment of a full distended bladder in infants, we examined all the bladders when they are moderately distended for standardization and defined a cut-off at 3.9 mm. Milosevic et al. investigated bladder wall thickness measurement in diagnosis of recurrent urinary tract infections and cystitis cystica in prepubertal girls. Also they defined 3.9 mm as optimum cut-off value for the bladder wall thickness. They detected 100% negative predictive value for the diagnosis of cystitis cystica with bladder wall thickness < 3.9 mm. Also they found 95.2% positive predictive results for the diagnosis of cystitis cystica in the patients with bladder wall thickness ≥ 3.9 mm (10).
Presence of leukocyte esterase and nitrite in dip-stick urinalysis, pyuria and bacteriuria in microscopic analysis are laboratory findings which suggest urinary tract infection (11). Also bacteriuria and pathological urinalysis can result from upper urinary tract infections/acute pyelonephritis. For differentiation between upper urinary tract infections/acute pyelonephritis and cystitis/lower urinary tract infection, infants presenting with a fever of 38°C and loin pain/tenderness and bacteriuria should be considered to have upper urinary tract infections/acute pyelonephritis (12). For this reason we excluded all the patients with fever higher than 38°C and also with systemic symptoms and signs.
Wilches et al. analyzed the correlation between presence or absence particulate echoes within the bladder on ultrasound images and confirmed urinary tract infections diagnosed by a positive urinalysis according to criteria established by the Colombian Society of Urology in their guidelines for urinary tract infection. In their study population which was composed of both pediatric and adult patients, they detected particulate echoes within the bladder on ultrasound with a sensitivity of 72.22% and a specificity of 48.28% for the diagnosis of urinary tract infection. Their pathological urinalysis ratio was 56.5% (13). When compared with our internal echoes group (P2) (41.4%) their pathological urinalysis rate was higher. Also in all of our patients with bladder wall thickness [only bladder wall thickness group (P3) + perivesical fluid and internal echoes group (P6) + wall thickness and internal echoes group (P7) + wall thickness, internal echoes group and perivesical fluid group (P8)] pathological urinalysis rate was 44.5%. (70 of 157 patients). Our pathological urinalysis rate was lower than theirs, probably because we excluded all complicated patients which had tendency to have urinary tract infection.
In literature there is no study about the comparison of presence of internal echoes in bladder lumen and thickened bladder volume for predicting pathological urinalysis results which suggest lower urinary tract infection in children. Also perivesical fluid collection which may be reactive to the bladder wall inflammation, was not previously investigated as a possible sonographic finding of lower urinary tract infection.
We found statistically significant difference for detecting pathological urinalysis results in all groups except perivesical fluid group (P1) when compared with control group (N). Especially thickened wall and echoes in lumen and perivesical fluid group (P8) and thickened bladder wall and echoes in the lumen group (P7) had highest pathological urinalysis rates (60% and 54.5%, respectively).
Also we compared pathological urinalysis results of the three subgroups of thickened wall group (P3) which was classified according to thickness size of bladder wall. All three subgroups had significantly (P < 0.005) higher pathological urinalysis results when compared with control group (N). But when subgroups 1 and 2 for detecting pathological urinalysis results were compared, no statistically significant difference was found. However pathological urinalysis rate of subgroup 3 was statistically significantly higher than both subgroup 1 and subgroup 2. So we can suggest that, pathological urinalysis rate increases as the wall thickness increases especially when the thickness is more than 6 mm.
We investigate a possible association with perivesical fluid and pathological urinalysis results with the hypothesis that reactive fluid formation may occur secondary to an inflamed bladder wall. Perivesical free fluid formation is suggested to occur secondary to trauma/hemorrhage and inflammation/peritonitis (2). We think that similar to pericholecystic fluid formation in cholecystitis (14), perivesical fluid may be seen in cystitis, although we did not detect statistically significant correlation between perivesical fluid collection and pathological urinalysis rates. But when compared with control group, perivesical fluid group had non-significantly higher pathological urinalysis rate. Also pathological urinalysis rates increased when perivesical fluid accompanied thickening bladder wall or presence of internal echoes within the bladder wall. So we recommend that isolated perivesical fluid collection with the lack of evidence of ovarian cysts and periovarian or intraperitoneal fluid must be carefully examined especially in the patients with internal echoes in bladder lumen or thickened bladder wall.
In all the groups pathological urinalysis rate was higher among females when compared with males. Except for perivesical fluid group (P1) (P > 0.05) in all the groups the difference in urinalysis rates was statistically significant between males and females (P < 0.05). Also in control group pathological urinalysis rate was statistically higher in females than males (21.9% vs 6.2%, respectively). These differences are probably due to the more tendency of females than males for urinary tract infection because of anatomical reasons.
Generally the groups had high specificity but low sensitivity rates. These rates especially in the groups of P1, P6, P7, and P8 may be due to smaller patient numbers. Also for example sensitivity rates for bladder wall thickness will be relatively higher than that for only wall thickness group (P2) when considering the patients with wall thickness in the other groups (P2 + P5 + P7 + P8).
Despite the low sensitivity rates, we suggest that perivesical fluid, bladder wall thickening and presence of internal echoes in the lumen of bladder are associated with pathological urinalysis results. Especially when one or more of these processes accompany the other one, pathological urinalysis rate and specificity rate markedly increase. Also the pathological urinalysis rate increases with thickness size of bladder wall. Finally we think that concomitants of these findings must be described and also the bladder thickness must be reported as millimeter in case of thickened bladder wall in ultrasound reports.
