1. Context
Children constitute a significant percentage of the world population and the provision and promotion of their health are among the first health priorities in societies. Due to special dietary needs for their growth, children are significantly at risk of malnutrition (1). Malnutrition is a state in which a deficiency, excess or imbalance of energy, protein and other nutrients causes adverse effects on body form or performance and clinical outcomes (2). Malnutrition affects all population groups, but is more common in infants and children due to their rapid linear growth (3). Hence, reducing malnutrition has been considered across two of the millennium development goals (MDGs) by the world health organization (WHO); the first was related to eradication of extreme poverty and hunger and the other was related to reduction of child mortality (4, 5).
The first effect of malnutrition is on growth, including weight loss, arm circumference reduction, delays in completion of bone growth, reduction in weight to height ratio and reduction in natural skin-folds (6). In addition, in the first years of life, malnutrition is a cause of slow body growth, short stature and reduction of intellectual development of children that leads to recurrent and treatment-resistant infections (7). Marasmus and Kwashiorkor, as examples, both forms of severe malnutrition, end with high rates of mortality (8, 9).
To calculate the anthropometric index in order to determine malnutrition status in children, height, weight and age are traditionally used (6). Stunting (low height for age), wasting (low weight for height) and underweight (low weight for age) are main indicators which can be calculated using these items. Stunting associated with malnutrition in children represents chronic malnutrition or a long-term illness, while wasting is an indication of severe acute malnutrition that a disease or inadequate intake of food can cause. Underweight also reflects a combination of acute and chronic malnutrition (10). According to the UNICEF annual report 2014 regarding these indicators, the prevalence of underweight, stunting, wasting and moderate and severe overweight in the world have been 15, 25, 8 and 7 percent respectively (11). Statistics show that the highest prevalence of malnutrition exists in infants and pre-school children, and malnutrition plays a significant role in the mortality of children under 5 years old. About 45 percent of child mortality was estimated to be attributable to malnutrition in 2011 (12). Also, global estimates showed that there were 51 million wasted, 162 million stunted and 99 million underweight children in the world (13). The result of other studies in developing nations also showed that despite socio-economic developments, malnutrition in children still exists as a significant health issue (14, 15).
In Iran, results of a study on a sample of 34200 children across 28 provinces of the country showed that 4.7, 2.5 and 3.7 percent of children suffered from stunting, underweight and wasting in 2008, respectively (16). Although recent studies indicate tangible reduction in the percentage of children suffering from malnutrition, this issue in some areas is still considered as a major health problem (17). Nevertheless, there is no recent and precise estimation of malnutrition across Iranian children. The aim of this study was to develop such estimate through a systematic review and meta-analysis and review the causes of malnutrition in Iran’s under five-year-old children.
2. Methods
We conducted a systematic review and meta-analysis in 2015 according to the preferred reporting items for systematic reviews and meta-analyses (PRISMA) statement (18, 19).
2.1. Search Strategy
The search was conducted on October 2015 and no restriction was placed on studies’ publication date. We searched PubMed, Google Scholar, Scopus, Index Copernicus, DOAJ, EBSCO-CINAHL, Iranmedex, SID, and Magiran. The electronic search strategy included the following keywords: nutrition, malnutrition, child malnutrition, under-nutrition, prevalence, epidemiology, etiology, occurrence and Iran. The electronic searches were independently conducted by two authors (MM, and AA), plus hand-searching of relevant journals and looking at references lists of the retrieved papers. A reference management software (Endnote X5) was used to export and manage the retrieved documents.
2.2. Study Selection
Two reviewers (MM and AA) independently screened the titles and abstracts to find potentially eligible studies for the full text review. The kappa coefficient which shows the agreement rate between two reviewers on the included papers was 0.801. In cases that two reviewers disagreed, the third author was consulted. The inclusion criteria were the originality of research (primary data), and reporting prevalence of malnutrition (of any indicators of stunt, waste or underweight), among under 5 years population based on NCHS/WHO standard. The exclusion criterion was publication languages other than English or Persian. The primarily included studies’ quality was examined by ‘strengthening the reporting of observational studies in epidemiology’ (STROBE) checklist (20).
2.3. Data Extraction
Using a data collection form, with same column titles included in Table 1, data were extracted from the included articles. The following information was extracted for each study.
2.4. Data Analysis
Computer software CMA:2 (Comprehensive Meta-Analysis) was applied for meta-analysis. The Cochrane Q statistic was calculated to assess the heterogeneity of data. The random effects model was used with 95% confidence interval to estimate the malnutrition prevalence. Publication bias was investigated using funnel plots. Microsoft Office Excel 2010 was used for drawing the graphs.
3. Results
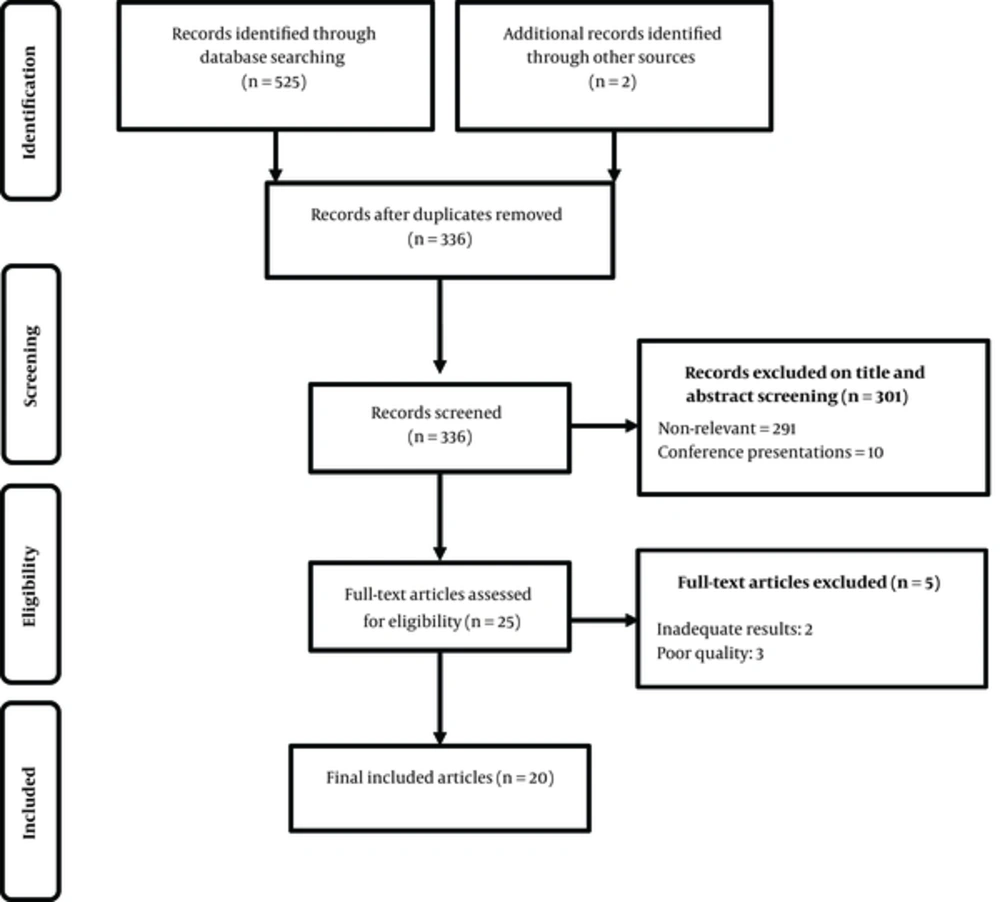
Twenty articles out of 527 primarily retrieved studies were entered for the final analysis (see Table 1). The articles were published between 1999 and 2014, of which 17 studies reported about wasting, 18 reported stunting and 19 of the included studies reported underweight rates. The pooled samples for each of wasting, stunting and underweight were 53612, 54312 and 55012 respectively. The results showed that the prevalence of each type of malnutrition, in terms of wasting, stunting and underweight were 7.8 (95% CI: 4.8% - 12.6%), 12.4% (95% CI: 8.3% - 18.5%) and 10.5% (95% CI: 7.1% - 15.4%) respectively. Parents’ educational level, in particular mothers’ educational level, place of residence, gender, employment status of mother, birth weight of less than 2500 grams, birth order, medical history, household socioeconomic status and family size were mentioned as important factors resulting in malnutrition.
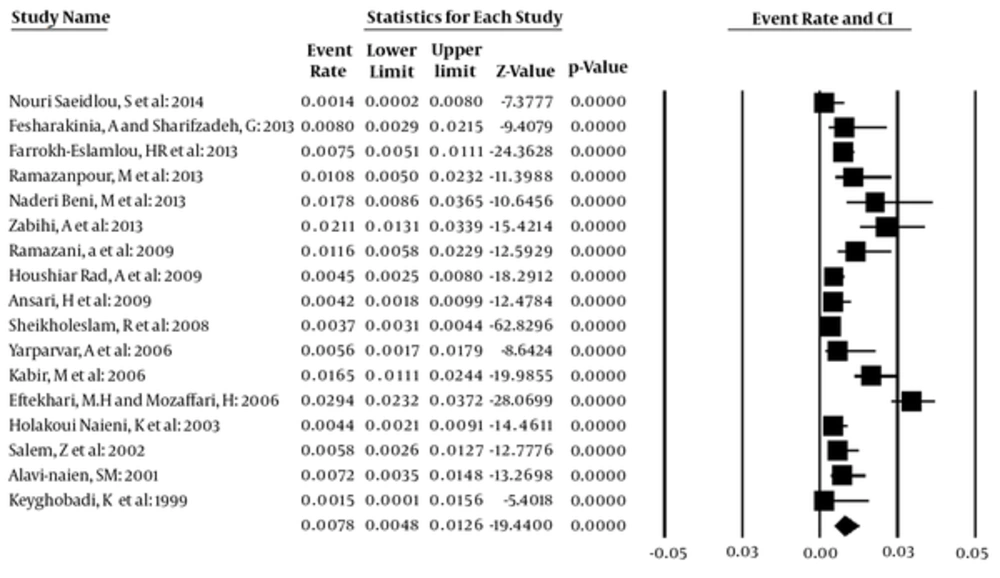
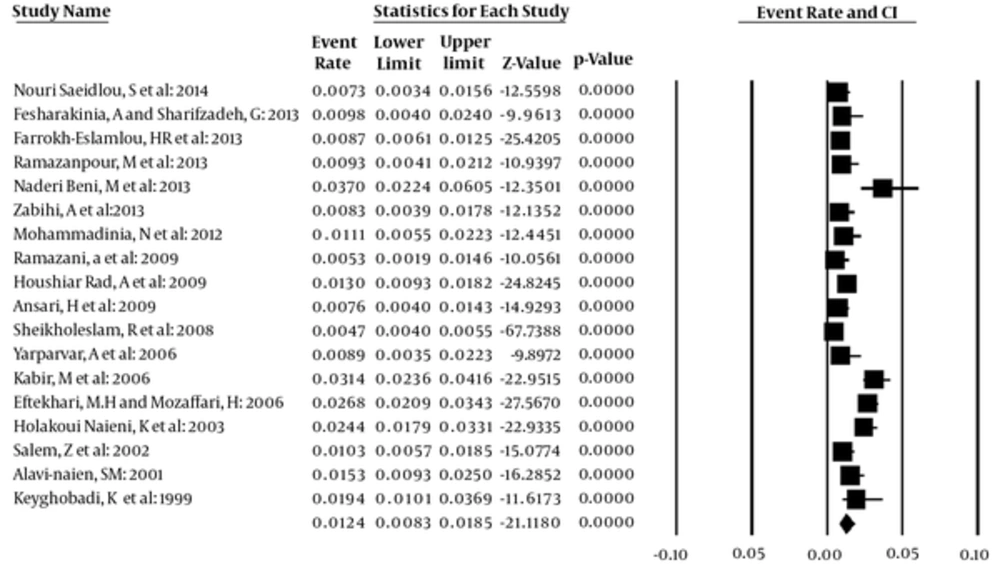
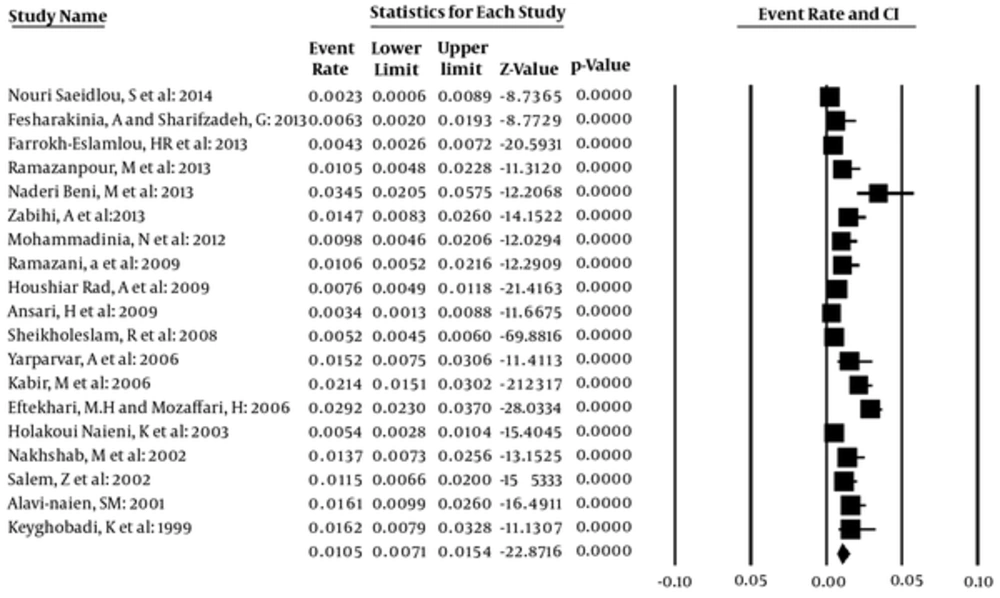
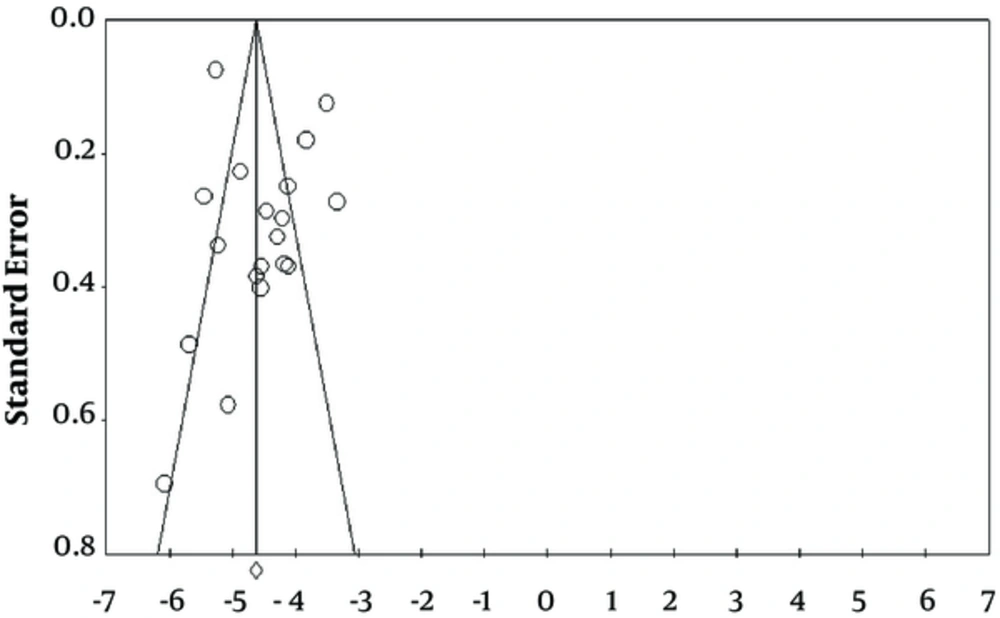
The prevalence of malnutrition for all studies based on the random effects model was calculated. The overall prevalence of wasting was determined to be 7.8% (95% CI: 4.8 - 12.6), Q = 238.8, df = 16, P < 0.001, I2 = 93.30 (Figure 2). The overall prevalence of stunting in under 5 year old children in Iran based on the random effect model was determined to be 12.4% (95% CI: 8.3 - 18.5), Q = 276.9, df = 17, P < 0.001, I2 = 93.86 (Figure 3). The overall prevalence of underweight was determined to be 10.5% (95% CI: 7.1 - 15.4), Q = 227.50, df = 18, P < 0. 001, I2 = 92.08 (Figure 4). The probability of publication bias was investigated just for stunting data (Figure 5), where there are some signs of bias.
According to Table 1 parents’ educational level, in particular mothers’ educational level can play a significant role. The results of the assessment at the country level in Iran also indicate a declining trend of the nutritional underweight prevalence in children under five years of age in recent years. This rate decreased from 15.5 to 4.7 percent between 1995 and 2004 (21). Also place of residence (urban or rural areas), gender of child, employment status of mother, and birth weight were mentioned as factors affecting malnutrition.
4. Discussion
The results showed that the prevalence of each type of malnutrition, in terms of wasting, stunting and underweight were 7.8, 12.4 and 10.5 percent, respectively. One reason for the rather high overall prevalence of all three indicators in this review is that the majority of studies were conducted in the cities or provinces in which socioeconomic status was middle or low and we know that health and economic differences across Iranian provinces are very wide (22, 23). The household socioeconomic status has been reported as one of the main factors of children malnutrition. Generally, it seems that there is more willing to study the prevalence in areas where prevalence of the desired factor or disease is higher. However, the overall prevalence of each of three indicators is in a good status compared to global statistics; UNICEF’s annual report in 2014 showed that the prevalence of wasting, stunting and underweight in the world were 8, 25 and 15 percent, respectively (11). The global statistics about wasting in 2014 show that almost one out of every 13 children in the world suffer from wasting and one third of all children suffer from severe wasting (16 out of the 50 million with a global prevalence of 4.2%) (13). Of course, low wasting prevalence in a society does not mean the absence of malnutrition (24). The global statistics about stunting show that the number of stunted children decreased from 255 million to 159 million children between 1990 and 2014 (13).
According to the 2014 World Bank report, Iran was ranked among countries with low prevalence stunting (4 percent). The indicator across Middle East and North Africa was 32 percent and 48 in South Asia (25). Also, results of a study conducted in Nairobi on 5156 children under 42 months old showed that 40% of children suffered from stunting (26). Results of a study conducted in Indonesia on children under five showed that 38.4% and 18.4% of children suffered from stunting and severe stunting, respectively. In Bangladesh, the prevalence of underweight, stunting and wasting in children under five were 41, 43 and 17 percent respectively (27). Cultural and economic status can be mentioned as factors contributing to stunting. Also, underweight reflects a combination of acute and chronic malnutrition (10). This means that short-term factors gradually provide ground for underweight and if the improper nutritional status or disease continues for any reason, it can in suffering children lead to wasting.
Parents’, in particular mothers’ educational level, place of residence, gender of child, employment status of mother, and birth weight were mentioned as factors affecting malnutrition. In line with the findings of the current study, in the study conducted in Nairobi there was a significant correlation between stunting and the masculine gender of child, mother educational level and birth weight (26). Low birth weight was also reported as one important reason for underweight in children in Bangladesh, its main cause being intrauterine growth restriction (27). Furthermore, among children under five in Indonesia, there was a significant correlation between stunting and the household income level, the employment status of father, the masculine gender of child and age of child (28). Mothers’ educational level can play a significant role in the incidence or absence of malnutrition in children. Lack of mothers’ awareness of how to use complementary foods properly, the way of preparing them and how to start complementary feeding can result in underweight and wasting in the children after 6 months of age (29). Also, lack of mothers’ awareness of children’s nutritional needs while breastfeeding withdrawal and financial ability to prepare complementary food are important factors affecting adequacy and appropriateness of children’s diet in accordance with their nutritional needs (30).
The results of studies conducted in Iran also showed that the age for starting complementary feeding can be considered as a factors of the incidence of malnutrition and children may suffer from nutrient shortages when switching from breastfeeding to complementary food. So it can be said that the most common starting point of malnutrition and growth retardation in children can occur from the age of 6 months onward. In this regard, parents’ educational needs should be met through implementing educational programs. Also the economic status of households with children in the growth stage should be responsive to basic nutritional needs of children.
Our review had some limitations. As mentioned earlier, the selected studies were generally conducted in rather deprived regions of the country and not all provinces were included in the final pooling of the malnutrition indicators. Only two studies were conducted nationwide. Hence we expect that the pooled data in the meta-analysis are overestimated. Moreover, the included data ranged 1999 to 2014. Pooling such longitudinal data can cause regression to mean, blurring any possible improvement in the studied indicators. Another cause of concern was about the heterogeneity of the pooled data. As the findings show the heterogeneity of pooled data was statistically significant (P = 0.001) and severe (I2 = 90) in all malnutrition indicators.
5. Conclusion
Effective solutions exist for reducing malnutrition in children. Increasing health literacy and promoting the culture of proper nutrition, equitable distribution of health care and services, solving economic obstacles, regular monthly weighting and growth monitoring for children, emphasizing on the importance of breastfeeding and the proper use of complementary feeding and finally the principled spacing between births and improving the quality of maternal care are matters of great importance for the prevention of malnutrition. The findings of this review reflect the importance of nutrition in under-five-year children and proper policy making in this area.
| Author, Year of Publication | City | Sample | Sample Size | Prevalence of Malnutrition ,% | Associated Risk Factors | ||
|---|---|---|---|---|---|---|---|
| Wasting | Underweight | Stunting | |||||
| Keyghobadi, K et al.: 1999 (31) | Khoramabad | 461 | 2 - 5 years old children | 1.5 | 16.2 | 19.4 | - Between underweight with the nutritional status of mothers based on BMI (P < 0.001), previous birth interval (P = 0.05) and Father’s education (P = 0.05) was a positive significant correlation. |
| - Between stunting with the nutritional status of mothers based on BMI (P < 0.01) and previous birth interval (P = 0.05) was a positive significant correlation. | |||||||
| - Between wasting with the nutritional status of mothers based on BMI was a positive significant correlation (P < 0.01) | |||||||
| Alavi Naien, S M: 2001 (32) | Kerman | 1015 | children under 5 years old | 7.2 | 16.1 | 15.6 | - Mothers’ educational level has significant correlation with prevalence of Underweight (P < 0.001) and wasting (P < 0.001), and fathers’ educational level has significant correlation with prevalence of wasting (P < 0.001). |
| - The prevalence of stunting has significant correlation with father’s job (P = 0.025) and household income (P < 0.001). | |||||||
| Nakhshab, M et al.: 2002 (33) | Sari | 700 | children under two years old | 13.7 | - The rate of malnutrition in children with educated mother was less as compare to children with uneducated mother (P < 0.0001). | ||
| - There was significant dependence between malnutrition and breast-feeding variables (P < 0.02), the history of hospitalization (P < 0.004), family members (P < 0.02) and regular consumption of multivitamins (P < 0.0001). | |||||||
| Salem, Z et al.: 2002 (34) | Rafsanjan | 1070 | 1 - 5 years old children | 5.8 | 11.5 | 10.3 | |
| Holakoui Naieni, K et al.: 2003 (35) | Islamshahr, Rey, Qom | 1624 | children under 5 years old | 4.4 | 5.4 | 24.4 | - There was a significant correlation between underweight with the number that growth curve was fell (P = 0.01), the frequency of constant growth curve (P = 0.003), birth rank (P = 0.009), duration of breastfeeding (P = 0.0005). |
| Yarparvar, A et al.: 2006 (36) | Bam | 500 | 6 - 59 month old children | 5.6 | 15.2 | 8.9 | - Low birth weight children were 7.5 times more likely to suffer from wasting (P = 0.001) and 4.5 times more likely to suffer from underweight (P < 0.001). |
| - Children who were breast-fed more than 18 months were 2.5 times more likely to be at risk of stunting (P = 0.023) than other children. | |||||||
| Kabir, M et al.: 2006 (37) | Golestan | 1473 | 0 - 24 month old children | 16.5 | 21.4 | 31.4 | - The prevalence of under-weight, wasting and stunting are positively correlated with increasing the children’s age. |
| - The under-weight and stunting linear trend was significant (P < 0.05). | |||||||
| - The risk of under-weight children were 2.8 fold in illiterate mothers relative to mothers with high school diploma. The risk was 1.5 fold in stunting. | |||||||
| Eftekhari, M H and Mozaffari, H: 2006 (38) | Lar and its outskirts | 2258 | children under five years old | 29.4 | 29.2 | 26.8 | - The results also indicated that the prevalence of malnutrition was significantly related to level of mothers’ education and family spacing. |
| Sheikholeslam, R et al.:: 2008 (16) | Children under 5 years in Iran | 34200 | children under 5 years old | 3.7 | 5.2 | 4.7 | - The prevalence of stunting among urban children is significantly less than rural children. |
| - The prevalence of underweight was 5.2% in the country (95% CI: 5.1% - 5.4% while the prevalence of this type of malnutrition was significantly less among urban children than those in rural ones. | |||||||
| -There was a significant difference in wasting between the urban and rural children. | |||||||
| Ramazani, a et al.: 2009 (39) | South Khorasan | 700 | 0 - 24 Months Old Children | 11.6 | 10.6 | 5.3 | - Malnutrition in children under one years old was more than children over one years old (P = 0.001). |
| - Prevalence of malnutrition in children who were breastfed were less than other children. (P = 0.001). | |||||||
| Houshiar Rad, A et al.: 2009 (40) | Iran | 2562 | children under 5 years old | 4.5 | 7.6 | 13.0 | - The prevalence of stunting and underweight in rural areas was more than twice the urban. |
| Ansari, H et al.: 2009 (41) | Zahedan | 1245 | 2 - 5 years old children | 4.2 | 3.4 | 7.6 | - There was a significant correlation between birth weight with stunting (P < 0.001). |
| - The prevalence of wasting in children who were born with low birth weight more than children with normal weight (P < 0.05). | |||||||
| - There was a significant correlation between wasting with birth interval (P < 0.05). | |||||||
| - There was a significant correlation between stunting and underweight with birth interval and its prevalence in children with 9 - 18 months were higher (P < 0.05). | |||||||
| - The correlation between stunting and mother’s education level was significant (P < 0.05). | |||||||
| - The highest prevalence of stunting was in children with unemployed fathers (P < 0.01) | |||||||
| - The correlation between stunting and underweight with type of nutrition during infancy was significant (P < 0.05) | |||||||
| - Between having a history of infection with stunting (P < 0.01) and underweight (P < 0.05) was a significant correlation. | |||||||
| - Between underweight with gender was a significant correlation and Underweight in girls higher than boys (P < 0.05). | |||||||
| - Between underweight with Age of mother was a significant correlation (P < 0.001). | |||||||
| Ansari, H et al.: 2009 (41) | Zahedan | 1245 | 2 - 5 years | 4.2 | 3.4 | 7.6 | - Univariate analysis showed that wasting had a significant relation with birth weight and birth interval. |
| - In addition stunting had relation with birth weight mothers’ educational level fathers’ job nutritional status infection history birth interval and mothers’ age. | |||||||
| - Underweight showed significant relation with sex birth weight nutritional status infection history birth interval and mothers’ age (P < 0.05). | |||||||
| Mohammadinia, N et al.: 2012 (42) | Iranshahr | 700 | children under 5 years old | 9.8 | 11.1 | - Malnutrition has significant association with birth grade, delivery type, hospitalization history, educational level of parents, parents’ job, birth weight, vaccination and the regular consumption of supplementary vitamins (P < 0.05). | |
| Fesharakinia, A and Sharifzadeh, G: 2013 (43) | Birjand | 480 | children under 5 years old | 0.8 | 6.3 | 9.8 | - Prevalence of underweight and stunting was significantly higher in children with birth weight under 2500 gr (P < 0.001) |
| Farrokh-Eslamlou, HR et al.: 2013 (21) | West Azerbaijan | 3341 | children under 5 years old | 7.5 | 4.3 | 8.7 | - The prevalence of stunting significantly higher among rural vs. urban children (P < 0.05). |
| - There is no significant difference between wasting and underweight among rural vs. urban areas (P > 0.05) | |||||||
| Ramazanpour, M et al.: 2013 (3) | Maneh-Semelghan city | 596 | children under 5 years old | 10.8 | 10.5 | 9.3 | - The predisposing factors of children malnutrition (parent education level, father’s job, child’s weight at the moment of being born) were significantly related to the issue. |
| Naderi Beni, M et al.: 2013 (29) | Chadegan | 403 | children under 5 years old | 17.8 | 34.5 | 37 | - The main contributing factors for wasting were found to be child’s age, habitat, onset of complementary food, history of disease, hospitalization (P < 0.05). |
| Zabihi, A et al.: 2013 (44) | Babol | 782 | Infants | 21.1 | 14.7 | 8.3 | - There was a significant correlation between gender with underweight (P < 0.001), wasting (P < 0.001) and stunting (P = 0.002) |
| - There was a significant correlation between Birth weight with underweight (P < 0.006), and stunting (P = 0.001) | |||||||
| Nouri Saeidlou, S et al.: 2014 (45) | Salmas | 902 | children under 5 years old | 1.4 | 2.3 | 7.3 | - The results showed that the prevalence of stunting in rural areas was higher than in urban areas, and this difference was significant (P < 0.001). |
Summary of the Included Papers
