1. Background
Obsessive-compulsive disorder (OCD) is a prevalent and incapacitating psychiatric disorder. Obsessions are repetitive and disturbing thoughts, impulses, and pictures against the will (1). Compulsions also include repeated thoughts. Obsessive-compulsive disorder affects 2 - 3% of adults globally over their lifetimes, but despite how severely it interferes with daily functioning, it is frequently both underdiagnosed and undertreated (2).
The first-line treatments for OCD include cognitive-behavioral therapy (CBT) and selective serotonin reuptake inhibitors (SSRIs) (3). However, 40 - 60% of patients who receive these treatments do not respond to treatment appropriately, categorized as non-responders (4).
Adjunctive medication is widely used for non-responding patients. However, over half of these patients remain non-responding (5). Novel treatments for non-responders are in the first stages of development. For example, deep brain stimulation (DBS) treats moderate and severe forms of treatment-resistant OCD. Nonetheless, it has some limitations, as it requires chronic implantation of hardware and carries the associated risk of complications. Furthermore, de novo obsessions are possible after implementing this treatment (6).
Due to the limitations of available treatments, researchers are trying to identify predictors of treatment response or resistance in patients with OCD. Recent studies showed that psychiatric comorbidities are significantly higher in treatment-resistant patients than in responders. The research found that attention-deficit hyperactivity disorder (ADHD), bipolar disorder, trauma and posttraumatic stress, and major depressive disorder (MDD) were associated with poorer outcomes in patients with OCD (7-10).
However, these results have some limitations. First and foremost, OCD is considered a heterogeneous psychiatric disorder. It consists of various dimensions, such as contamination/cleaning, danger/checking, sexual/religious, arranging/counting, aggressive, and somatic obsessions and compulsions. These different OCD dimensions are distinguished by further genetic transmission, psychiatric comorbidities, and treatment response (11-13). However, most studies do not consider these heterogeneities in highlighting treatment outcome predictors, while every OCD dimension (subtype) has a different pattern in psychiatric comorbidities. Second, most studies have examined single components rather than complicated relationships when determining how treatment response in OCD may be affected. As treatment response results from the interaction of many components, understanding the interactions between distinct symptom clusters and risk factors associated with OCD is vital to identifying the symptoms that influence treatment outcomes.
Network analysis provides a complete perspective on these interactions by quantifying and visualizing diverse components and associations among psychiatric comorbidities. With an innovative style, this approach can determine the essential interplays in psychiatric disorders pathology. As a result of network theory, it has been found that (a) psychopathology is characterized by a multifactorial background, (b) mental disorders are maintained by a variety of mechanisms, and (c) psychopathological phenomena require pluralistic explanations (14, 15).
Recently, the network perspective has been used to predict treatment outcomes. For example, Zhou et al. used a network perspective to determine changes in major depressive disorder network structure over a 12-week SSRI trial. They found that pre-test network structure and connectivity differed between treatment responders and non-responders (16). To the best of our knowledge, there is only one study about predicting treatment outcomes for OCD. In that study, researchers found that non-responders demonstrated a more robust connection in specific nodes and edges than responders in the baseline (17).
However, there are still several issues that have not been addressed. First, no study has investigated the predictive role of comorbid psychiatric symptoms in predicting treatment response in the network analysis framework. Second, differences between subtypes in psychiatric comorbidities and treatment response have not been established. In the present study, an attempt was made to add new results to the existing literature regarding the prediction of treatment response in patients with OCD.
Since this study was carried out during the COVID-19 pandemic, the contamination/cleaning and check/danger subtypes were highly correlated with the psychological aspects of such diseases (18, 19). So, we selected these two OCD subtypes to determine differences in their network structure.
2. Objectives
The present study applied network analysis to investigate the interrelations among psychiatric symptoms in contamination/cleaning and danger/check OCD subtypes before and after an SSRI treatment course to predict treatment response by psychiatric comorbidities in a dynamic network structure.
3. Methods
3.1. Study Design
The present study utilized a 12-week, single-blinded design using data from baseline and after treatment in patients with OCD. The current study design was approved by the Research Ethics Committee of the University of Social Welfare and Rehabilitation Sciences, Tehran, Iran on October 20, 2021 (approval code: IR.USWR.REC.1400.150). The researchers compared the baseline's network structure with the patients' post-test based on treatment response. The primary goal was to determine the network structure of treatment-resistant patients in the pre-test (retrospectively) to provide insights for predicting the treatment response of patients. A non-random convenience sampling method was applied. The following subsection (Participants and Procedures) provides comprehensive details about the sample and participants.
3.2. Participants and Procedure
The participants were recruited from private practices in Isfahan and Tehran cities, Iran, and outpatient psychiatric wards of clinics affiliated with the University of Social Welfare and Rehabilitation Sciences (USWR), Tehran, Iran, from November 12, 2021, to February 9, 2023.
Patients who met the inclusion criteria were invited to participate in the study. The inclusion criteria included (a) receiving an OCD diagnosis according to the Diagnostic and Statistical Manual of Mental Disorders, Fifth Edition (DSM-5), (b) being categorized as contamination/cleaning or danger/checking OCD subtype, (c) having more than 18 years old, (d) being drug-naive, and (e) providing written informed consent.
The Persian version of the Structural Clinical Interview for DSM-5-Research Version (SCID-5-RV) was used for OCD diagnosis. Also, the OCD subtype was evaluated by SCID-5-RV; then, blinded psychologists used The Yale-Brown Obsessive-Compulsive Scale (YBOCS) to confirm this categorizing.
Participants who met the inclusion criteria based on their OCD subtype were placed in danger/checking and contamination/cleaning subtypes, so randomization was not applicable in this stage.
Analysis using G*Power software showed that a sample size of 120 participants would be needed to obtain a statistical power of 95% (α = 0.05), assuming a moderate effect size (0.25). A total sample of 140 participants was recruited to account for potential attrition.
Both groups were evaluated before the intervention. The pre-test evaluation included psychiatric symptoms (using SCID-5-RV), the Yale-Brown Obsessive-Compulsive Scale (Y-BOCS) severity section, the demographic characteristics questionnaire, and the clinical variables checklist. We used SCID-5-RV and Y-BOCS for network estimation and determining treatment response (in post-test), respectively.
After the pre-test, patients received the intervention under the supervision of psychiatrists or neurologists blinded to the present research aims. The choice between fluoxetine or fluvoxamine was left to the psychiatrist/neurologist based on the patient's history and other considerations.
The exclusion criteria included: (1) having a current disease with possible interference with treatment procedure, (2) getting pregnant during research, (3) experiencing psychotic disorder/episode, (4) not willing to continue research participation, (5) receiving any parallel psychotherapy during the trial, and (6) experiencing an unexpected event affecting the life process (such as severe illness, death of the family member, or divorce).
One of the most accepted treatment-resistance criteria for OCD definitions is "the presence of a score higher than 16 in the Y-BOCS after at least 12 weeks of an adequate dose of SRIs" (20, 21). So, after 12 weeks of treatment, we categorized patients into responding and resistant according to the Y-BOCS scores. After this categorizing, we had four groups:
(A) Treatment responders with danger/checking subtype
(B) Treatment responders with contamination/cleaning subtype
(C) Treatment-resistant with danger/checking subtype
(D) Treatment-resistant with contamination/cleaning subtype
So, we used a network perspective to determine differences among these groups. Comprehensive details about the analytic plan regarding these groups are provided in the "statistical analysis" subsection.
Regarding ethical considerations, an individual session (by the first author of the current study) was held for each eligible patient willing to participate in the research. The patients were informed that participation in the survey was voluntary and they could leave the study anytime. Medicines had been approved by the Ministry of Health of Iran. All patient information was collected confidentially and was not shared with third parties. Unwillingness to continue participating in the research had no effect on the treatment process of patients and their health insurance. Finally, the participants could contact the researchers anytime and raise their questions and concerns.
3.3. Network Estimation of Psychiatric Symptoms
The SCID-5-RV was used to estimate the network of psychiatric symptoms. Primary and optional disorders were examined clinically and sub-clinically. First, each disorder's symptoms were examined, and each symptom was scored between 0 and 10. The scores of each disorder were then summed and divided by the number of symptoms to obtain a final score of 0 to 10 for each disorder. This process eliminated artificial inflation in disorders with the highest symptoms. For each patient, two experienced clinical psychologists with a Ph.D. degree individually performed the SCID-5-RV to determine whether inter-rater differences in scores were less than 1 for all disorders. Then, the scores of both evaluators were added and divided by two. The third evaluator assessed the patient for any subject profile if the score differences for at least one disorder were higher than 1.
3.4. Treatment
All patients received fluoxetine with an initial dose of 20 mg/day or fluvoxamine with an initial dose of 50 to 100 mg/day. The drug dosage increased according to the patient's therapeutic response. It should be noted that the choice of fluvoxamine or fluoxetine was based on the opinion of the psychiatrist/neurologist regarding demographic considerations, disease history, duration of the disorder, and the patient's living conditions.
3.5. Measures
3.5.1. The Yale-Brown Obsessive-Compulsive Scale
A semi-structured interview with a graded scale administered by a clinician was utilized to assess the severity of the symptoms and identify the types of obsessions. There were five items in the YBOCS for compulsions and five for obsessions. Suitable scores in split-half reliability (0.89), internal consistency (0.95), and test-retest reliability (0.99) were calculated in the Persian version of this scale (22).
3.5.2. Demographic and Clinical Variables
A researcher-made scale included demographic (e.g., age, gender, educational status, and economic status) and clinical (e.g., age of onset and OCD diagnosis duration) data used in the present study.
3.5.3. The Structural Clinical Interview for DSM-5-Research Version
This manual is a semi-structured interview guide for making the primary DSM-5 diagnoses. The SCID-5-RV is normally administered in a single 45 - 90-minute session. The Persian version of this manual has suitable psychometric properties (for more information, see 29)).
3.6. Statistical Analysis
Data management, descriptive analyses, and network estimation were executed using R-Studio (Desktop Version 4.2.1). Data analysis was done in four steps, as follows:
3.6.1. Step 1: Descriptive Statistics
Data were summarized as numbers (percentages) and mean (standard deviation) for categorical and continuous variables. Independent-sample t-test was used to compare the means between OCD subtypes in continuous variables (e.g., age and age of onset). Also, the comparison between categorical variables (e.g., gender) was made by χ2 test.
3.6.2. Step 2: Comparison of OCD subtypes in Baseline
A network comparison test (NCT) package was utilized to determine whether the networks for contamination/cleaning and danger/checking samples significantly differed in the baseline. The NCT calculates both network invariance (i.e., significant differences in the structure of the networks) and global strength invariance (i.e., significant differences in the global strength [sum of the strength of all of the edges] of the networks). Finally, the results of this comparison indicated whether OCD subtypes should be evaluated separately or combined.
3.6.3. Step 3: Network Estimation of Contamination/Cleaning Subtypes
First, the patients were categorized as treatment-resistant or responders according to the Y-BOCS scores at post-test (for more details about this categorizing, see the "participants and procedure" section). Second, a partial correlation was estimated separately for treatment-resistant and responder groups at baseline (The qgraph package with “qgraph" and “EBICglasso" functions visualized and calculated partial correlation networks).
An undirected Gaussian network's structure was learned by the graphical least absolute shrinkage and selection operator (LASSO) algorithm. By reducing less significant edge weights in the network to 0, LASSO uses L1 regularization to produce a sparse network (23). As the default for EBICglasso, we utilized an extended bayesian information criterion (EBIC) hyperparameter of gamma = 0.5, which errs on the side of excluding spurious edges (24).
Third, centrality measures were estimated by betweenness, strength, and closeness of nodes (or psychiatric symptoms) at baseline. Then, the edge weights were measured for accuracy by obtaining 95% confidence intervals (CIs) using the “bootnet" R package; narrower CIs indicate greater accuracy. The centrality indices were also tested for stability using a case-dropping bootstrapping procedure to assess their stability. With the R-package "bootnet" (25), we calculated the correlation stability coefficient by comparing indices sampled from networks with progressively fewer cases and indices tested from networks sampled from progressively smaller networks. To verify whether two edge weights or two node strengths significantly differed, we used 1,000 bootstrapped samples with a P-value of 0.05.
Finally, we evaluated the network's structure to compare baselines and endpoints and determine whether the connectivity of symptoms varied over time. For example, nodes with the highest connectivity levels at baseline could become poorly connected at endpoints, indicating a significant structural change. Additionally, we evaluated the network's global strength by comparing all edges with the baseline and endpoint. Utilizing the R package “network comparison test," we used a two-tailed permutation test with 5,000 iterations for assessing repeated measurements (26). Consequently, a difference of P < 0.05 demonstrated a significant difference.
3.6.4. Step 4: Network Estimation of Danger/Checking Subtypes
This step was done in the same way as step 3. All stage 3 analyses were also performed for this subtype.
4. Results
4.1. Clinical and Demographic Characteristics
One hundred thirty-six patients completed treatment and were included in the data analysis. Among them, 69 were categorized as contamination/cleaning, and 67 as danger/checking. Table 1 presents the demographic and clinical characteristics of patients at baseline. The results showed no significant difference in age between the groups. In “age of onset," the patients in contamination/cleaning showed significantly higher scores than patients in the danger/checking subtype.
| Variables | Contamination | Checking | P Value |
|---|---|---|---|
| Age | 30.08 ± 5.11 | 30.94 ± 5.39 | > 0.5 |
| Age of onset | 20.76 ± 4.59 | 18.68 ± 3.90 | < 0.5 b |
| Gender | > 0.5 | ||
| Male | 30 (43.47) | 28 (41.79) | |
| Female | 39 (56.53) | 39 (58.21) | |
| Educational status | > 0.5 | ||
| Under diploma | 8 (11.59) | 5 (7.46) | |
| Diploma | 29 (42.02) | 31 (46.26) | |
| B.Sc. | 31 (44.92) | 30 (44.77) | |
| M.Sc. | 1 (1.44) | 1 (1.49) | |
| Economic status | > 0.5 | ||
| Low | 26 (37.68) | 25 (37.31) | |
| Medium | 17 (24.63) | 22 (32.83) | |
| High | 26 (37.69) | 20 (29.86) |
a Values are expressed as Mean ± SD or No. (%).
b Significant in 0.05 level.
4.2. Comparison of Obsessive-Compulsive Disorder Subtypes at Baseline
In the contamination/cleaning group, 30 (43.5%) patients were in the responder group; the rest [39 (56.5%)] were placed in the resistant group. In the first step, the network structure of both subtypes was estimated at the baseline. In this step, we evaluated the network estimation at baseline, so we did not consider the treatment outcome. This evaluation aimed to determine whether the two groups could be merged or had different network structures. The NCT results showed a difference between contamination/cleaning and danger/checking groups in network structure [M = 0.58, P < 0.5]. Moreover, the global strength values in the two groups [S = 6.055 for danger/checking, S = 10.852 for contamination/cleaning, P < 0.05] revealed that the contamination/cleaning group had significantly more strength structure in network formation than the danger/checking group [strength difference between the two networks was 3.079945].
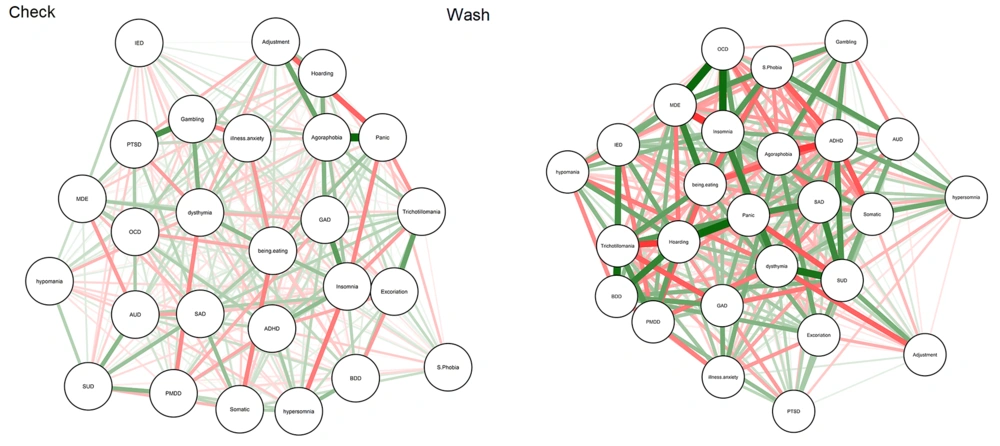
In the second step, we estimated the network structure for OCD subtypes. As shown in Figure 1, the baseline network of participants in the contamination/cleaning group was more strongly connected than those in the danger/checking group. Centrality measures in two forms (visualized and numeric) show the centrality values (e.g., strength, betweenness, and closeness) in the supplementary files (Appendices 1 - 3). As shown in Appendices 2 and 3, in the baseline of the danger/checking group, most strength nodes directly connected to other nodes were dysthymia and binge eating. In contrast, most strength nodes for the contamination/cleaning group were hoarding and panic. Also, the most central nodes in danger/checking network structure at baseline were binge eating and dysthymia.
In contrast, the most central nodes in the contamination/cleaning group were panic, hoarding, and ADHD. Finally, based on the “expected influence" measures for each group, the results showed that agoraphobia and MDE significantly influenced network structure in the danger/checking group. In contrast, insomnia and panic had the most influence on network structure in the contamination/cleaning group (For more details, see Appendices 2 and 3).
4.3. Network Analysis of Contamination Group
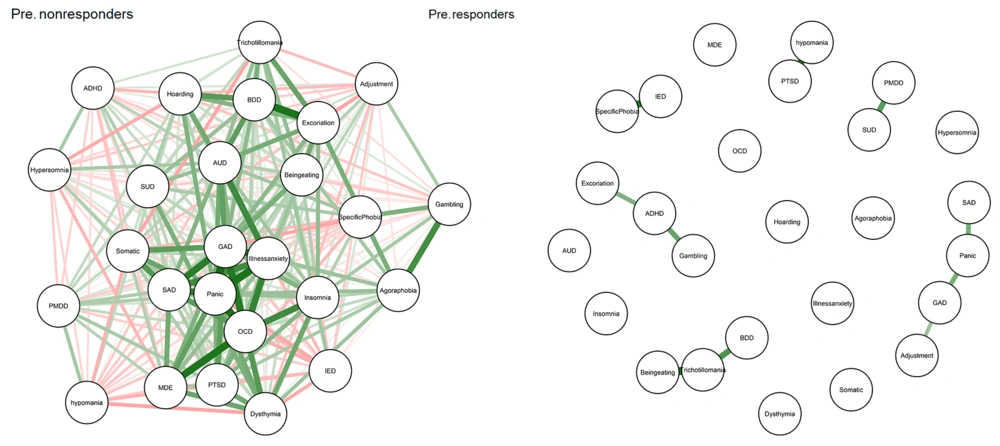
As shown in Figure 2, the network structure of participants in the resistant group was more strongly connected than that of participants who showed improvement in the baseline. Also, Appendix 4 visualized the centrality measures of responders and resistant patients (at baseline) separately. For details about centrality measures, we present the exact number for every centrality measure for resistant and responder groups (at baseline) separately in Appendices 5 and 6.
The case-dropping bootstrap results for the centrality measures are shown in Appendices 7 and 8 for responders and resistant patients, respectively. In these figures, the Y-axis depicts the average correlation between the original and case-dropped samples, retaining the percentage of individuals depicted on the X-axis. Notably, if dropping only a relatively small percentage of individuals would alter the correlation significantly, we could not consider centrality measures in the manuscript as very robust (27).
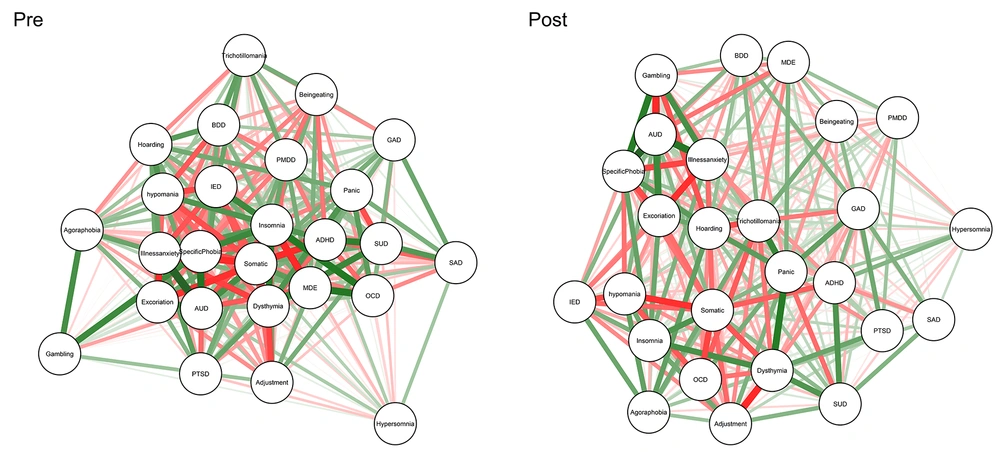
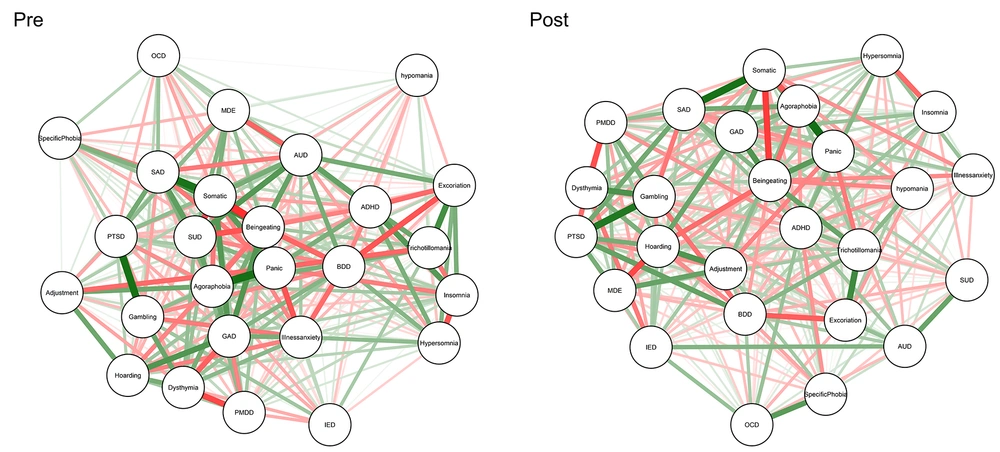
About the post-test, Figure 3 presents dynamic changes before and after treatment courses in the contamination/cleaning subtype. Also, we compared centrality measures in baseline and post-test for the resistant group (Appendix 9). Appendices 5 and 10 provide exact numbers for centrality measures of treatment-resistant patients at baseline and post-test, respectively. Finally, the NCT showed no differences in connectivity for global strength (global strength measures were 82.65 and 67.85 in baseline and post-test, respectively; Test statistic S: 14.80, P > 0.5) and network invariance (M: 0.74, P > 0.5). According to Appendix 11, network structure and global strength did not change significantly from baseline to post-test (P < 0.05), suggesting that symptom connectivity did not change over time in non-responders.
Network showing associations among study variables at baseline (right) and post-test (left) for non-responding participants in the contamination/cleaning group. Green edges indicate positive (partial) associations; red edges indicate negative associations. Thicker lines indicate stronger associations.
4.4. Network Analysis of Danger/Checking Group
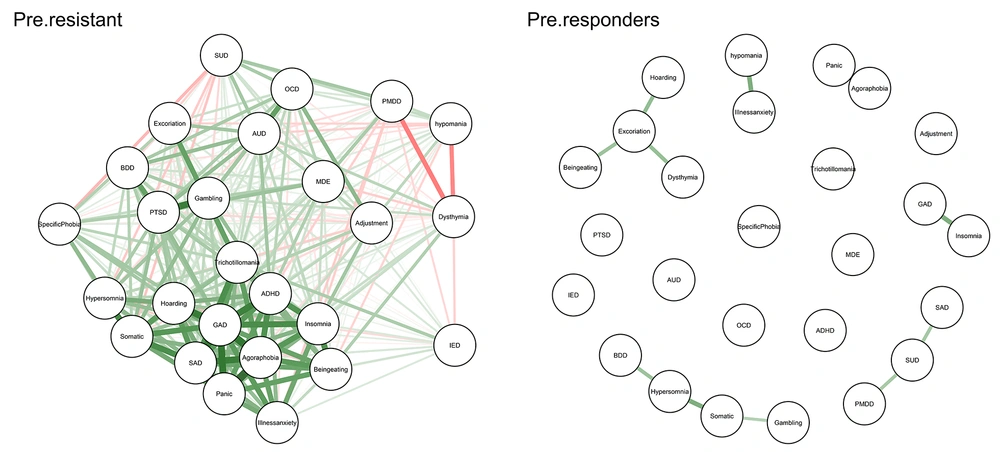
In the danger/checking group, 26 (38.8%) participants were in the responder group, and 41 (61.2%) were in the treatment-resistant group. As shown in Figure 4, the network structure of treatment-resistant patients was more strongly connected than participants who showed improvement at the baseline (for the danger/checking subtype). Also, Appendix 12 visualizes the centrality measures of responders and resistant patients (at baseline) separately. For details about centrality measures, we present the exact number for each centrality measure for resistant and responder groups (at baseline) separately in Appendices 13 and 14.
The case-dropping bootstrap results for the centrality measures are shown in Appendices 15 and 16 for responders and resistant participants, respectively. In these figures, the Y-axis depicts the average correlation between the original and case-dropped samples, retaining the percentage of individuals depicted on the X-axis. Notably, if dropping only a relatively small percentage of individuals would alter the correlation significantly, we could not consider centrality measures in the manuscript as very robust.
Figure 5 presented dynamic changes before and after the treatment course in the danger/checking subtype of the post-test course. Also, we compared centrality measures in baseline and post-test for the resistant group (Appendix 17). Appendices 14 and 18 provide exact numbers for centrality measures of treatment-resistant patients at baseline and post-test in the danger/checking subtype, respectively.
Network showing associations among study variables at baseline (right) and post-test (left) for non-responding participants in the checking/danger group. Green edges indicate positive (partial) associations; red edges indicate negative associations. Thicker lines indicate stronger associations.
Finally, the NCT showed no differences in connectivity for global strength (global strength measures were 81.01 and 80.59 at baseline and post-test, respectively; test statistic S: 0424, P > 0.5) or network invariance (M: 0.71, P > 0.5). According to these results, neither network structure nor global strength changed significantly from baseline to post-test (P < 0.05), suggesting that symptom connectivity did not change over time in resistant patients.
5. Discussion
This study examined the network structure of psychiatric symptoms over time in two OCD subtypes. Dysthymia, panic, agoraphobia, insomnia, and binge eating were the most central (important) nodes in danger/checking at baseline. About the contamination/cleaning group, depression, panic, hoarding, insomnia, and ADHD were the most central nodes in the baseline. Despite the similarity between danger/checking and contamination/cleaning network structures in depression, panic, and insomnia nodes, there were different network structures between groups at baseline.
This study is the first to examine the difference between the network structure of psychiatric symptoms in OCD subtypes. Therefore, no similar study was found to compare with the present findings. However, relatively similar studies (using traditional analysis methods) have been conducted. Regarding insomnia, results showed that this symptom played an essential role in both networks. These results align with previous studies. A recent review conducted by Cox et al. found that OCD has an independent association with sleep problems (especially insomnia) (28). Also, insomnia is generally linked to psychopathology, higher symptom severity, and lower levels of emotional functioning and quality of life. For OCD, there have been found both subjective and objective alterations in sleep patterns (22). Another common node between OCD subtypes was depression. This result is also in line with previous studies. According to an epidemiological study, the lifetime prevalence of major depression in patients with OCD was more than 75% (29).
Eating was one of the central nodes in the danger/checking OCD subtype. As the present study was the first research regarding the network structure of psychiatric symptoms in OCD subtypes, we found no similar study to compare the results. However, some previous studies have limited results similar to the present study. According to one study, there are clear and distinct links between OCD and two types of ED pathology: limiting (which involves reducing compulsions and rigidity surrounding food) and binge eating (which involves hoarding and binge eating symptoms) (30). In another study, results showed that obsessive-compulsive symptoms were modest with agoraphobia (31).
According to the Y-BOCS scores, patients are categorized as responders and resistant in both subtypes. In the contamination/cleaning subtype, the network connectivity of patients in the resistant group was more strongly connected than those categorized as responders in the baseline. Results showed that insomnia was the most significant predictor for response type in contamination/cleaning according to centrality measures. This result is in line with previous studies.
Insomnia is generally linked to psychopathology, higher symptom severity, and lower levels of emotional functioning and quality of life (32, 33). So, it can have a potential role in treatment outcomes. For OCD, there have been found both subjective and objective alterations in sleep patterns (34). Research suggests reduced sleep time and sleep efficiency in OCD (35). Later bedtime also predicts a future increase in OCD symptoms (36). Some studies have found that comorbid sleep disturbance in OCD is accounted for by other factors, such as depressive symptoms (37). However, a recent review argues that OCD has a unique relation to sleep disturbance that is not better accounted for by negative affect (36).
Underlying explanatory mechanisms in the link between obsessions and insomnia may involve dysfunctional beliefs associated explicitly with OCD (e.g., over the importance of thoughts) (38). Factors underlying mood regulation may also play a role in explaining the OCD-sleep relationship. This is consistent with emerging findings in the basic sciences regarding the functional role of sleep in emotional information processing. Both experimental and non-experimental research suggest that impaired emotional processing is predicted by sleep deprivation in vitro and fragmented sleep among healthy adults. Also, sleep deprivation affects cognition and may lead to negative attentional bias and possibly altered amygdala function (39).
In the danger/checking subtype, panic and binge eating were significant predictors of treatment-resistant outcomes. In fact, patients with OCD (categorized as danger/checking) who showed panic and binge eating comorbidity in baseline might not respond to SSRIs and be classified as treatment-resistant. There is no similar study for comparing the results. However, risky decision-making, impulsivity, and impaired reward systems were shared between OCD and binge eating (40, 41). Therefore, these cognitive aspects can also be relevant to developing compulsive dependence. However, it is necessary to conduct similar studies to compare the results more confidently.
5.1. Limitations and Future Directions
Despite the promising results of the present study, this study also faced limitations. First, since the research was conducted during the COVID-19 pandemic, the authors were given limited financial resources to conduct the research at the university. So, the authors conducted this study with a low sample size. Second, we used patient reports about drug compliance, but this method does not provide confidential information. Future studies can examine the network of psychiatric symptoms of individuals after receiving mediation and CBT and compare the results between groups. Second, other subtypes of OCD, such as sexual, aggressive, and relationship OCD (R-OCD), should also be investigated, and the results obtained from all subtypes should be compared. Finally, in future studies, a follow-up period can be added to the research plan to check the stability of symptoms.
5.2. Conclusions
The results showed that each subtype of OCD has a unique network structure. Therefore, it is necessary to develop a particular protocol for each of these subtypes. It is also possible to predict treatment response in each subtype of OCD based on their network of psychiatric symptoms. Health policymakers can use the current findings to identify the patients at risk of treatment resistance. They can provide the budget for developing protocols to reduce treatment-resistant rates in patients with OCD.
