


1. Context
Psychogenic nonepileptic seizures (PNES) represent a complex clinical entity, often manifesting in a manner indistinguishable from epileptic seizures (ES) but with distinct etiological underpinnings. They are events resembling ES and were historically referred to as 'pseudoseizures, hysterical seizures, or psychogenic seizures'; however, the currently accepted nomenclature is 'psychogenic nonepileptic seizures'. The PNES are not characterized by the abnormal, excessive synchronous cortical activity typical of ES. Rather, these events, originating from psychiatric causes, are distinct from epilepsy. Some experts propose alternate terms like psychogenic functional spells or psychogenic nonepileptic events, emphasizing their non-epileptic nature (1-5). A retrospective analysis over several years revealed a diverse array of diagnostic terms used to describe these occurrences, highlighting the need for standardized terminology (5).
The bedside distinction between PNES and ES can be challenging, even for experienced clinicians. Theoretically, a wide range of recurrent behaviors could indicate ES. The development of epilepsy monitoring units, allowing for the integration of video with EEG recordings, has become crucial for accurate diagnosis (6, 7). Video-EEG recording of an event, demonstrating the absence of epileptiform activity during the episode and aligned with patient history, is considered the diagnostic gold standard for PNES (8). It's common to encounter significant diagnostic delays in identifying PNES (9).
Recent research has increasingly focused on the potential role of mild traumatic brain injury (mTBI) as a contributing factor in the development of PNES (10-12). In examining the co-occurrence of traumatic brain injury (TBI) and PNES, it's important to contextualize it within the broader prevalence of these individual conditions. Research has shown that approximately 12% of the population in developed nations report a history of TBI, predominantly mild cases, with a notably higher incidence in men than in women (13). The rate of hospital-treated mTBI cases ranges from about 100 to 300 per 100,000 people (14). The PNES, on the other hand, is diagnosed at a yearly rate of 1.4 to 4.9 per 100,000, with a prevalence estimated at 2 to 33 per 100,000. Notably, there is a significant predominance of PNES diagnoses among women (15).
The purpose of this paper is to meticulously explore and analyze the intersection between mTBI and PNES. By delving into the epidemiological correlation and clinical implications of these co-occurring conditions, this study aims to enhance the understanding of their interrelationship. It seeks to provide a comprehensive review of the existing literature and systematically assess the prevalence, risk factors, and potential underlying mechanisms linking mTBI to PNES. Additionally, the paper endeavors to clarify the diagnostic challenges and treatment considerations associated with this intersection, ultimately contributing to improved clinical approaches and patient outcomes in managing these complex conditions.
2. Evidence Acquisition
2.1. Overview
The methodology of this paper involves a systematic review of existing literature to explore the relationship between mTBI and PNES. The goal is to synthesize current knowledge, identify gaps in research, and provide a comprehensive understanding of these co-occurring conditions.
2.2. Literature Search
2.2.1. Databases Searched
The research was conducted through an extensive search of three major databases: PubMed, Web of Science, and Scopus. These platforms were chosen for their wide coverage of medical and scientific literature.
2.2.2. Search Strategy
We employed a comprehensive search strategy that included both keywords and Medical Subject Headings (MeSH) related to mTBI and PNES. The keywords included terms such as 'mild traumatic brain injury', 'concussion', 'psychogenic nonepileptic seizures', and 'PNES', along with their synonyms and variations (e.g., 'head injury', 'non-epileptic seizures'). The MeSH terms were used to capture relevant medical literature more effectively, ensuring the inclusion of articles indexed under specific categories related to these topics.
To enhance search precision, we employed Boolean operators: The operator 'AND' was used to combine different concepts (e.g., mTBI AND PNES), ensuring that articles included both terms. The operator 'OR' was used to include alternative terms or synonyms (e.g., 'concussion OR mild traumatic brain injury'), broadening the search to capture a wider range of relevant studies. Additionally, we applied filters (e.g., by publication date or language) where necessary to refine the search results further.
2.2.3. Time Frame and Language
The search was not restricted by publication date to ensure the inclusion of all relevant studies. However, due to the research team's language proficiency constraints, articles were limited to those published in English.
2.3. Inclusion and Exclusion Criteria
2.3.1. Inclusion Criteria
Studies were selected based on their relevance to the topics of mTBI and PNES. Included were original research articles, both quantitative and qualitative, case series, and cohort studies that provided data on the epidemiology, diagnosis, or management of PNES in mTBI.
2.3.2. Exclusion Criteria
Editorials, commentaries, reviews, and studies not directly addressing the co-occurrence of mTBI and PNES were excluded. Articles not available in English or lacking full-text access were also excluded.
2.4. Data Extraction and Analysis
2.4.1. Data Collection Process
A standardized form was used to extract relevant information, including study design, sample size, population characteristics, outcomes measured, and key findings. Although the initial aim was to assess effect sizes such as odds ratios (OR), risk ratios (RR), and standardized mean differences (e.g., Cohen’s d, Hedges’ g), the included studies did not consistently report these measures. As a result, our analysis focused primarily on reported prevalence rates and qualitative synthesis of associations between mTBI and PNES. When studies did not report effect sizes, we calculated them based on the provided data, where feasible, to assess the strength of associations between mTBI and PNES.
2.4.2. Data Synthesis
Data were synthesized qualitatively due to the expected heterogeneity in study designs and measurements. Although effect sizes such as OR, RR, and standardized mean differences (e.g., Cohen’s d) were initially considered for inclusion, the included studies did not consistently report these measures, and the data were insufficient to compute them reliably. Therefore, the synthesis focused on reported prevalence rates and descriptive associations between mTBI and PNES, as well as psychiatric comorbidities.
2.5. Quality Assessment
2.5.1. Evaluation of Studies
The quality of included studies was assessed based on their methodology, sample size, and control of biases. Tools like the Newcastle-Ottawa Scale and the PRISMA checklist were used as guidelines for assessing the quality of observational studies and systematic reviews, respectively.
2.5.2. Bias Assessment
The potential for publication bias, selection bias, and reporting bias was considered in the literature evaluation.
3. Results
3.1. Search Results and Study Selection
The comprehensive search across PubMed, Web of Science, and Scopus initially yielded a total of 1,354 papers. This extensive collection represented a broad spectrum of research pertaining to mTBI and PNES. The initial phase of the selection process involved a meticulous screening to ensure relevance and adherence to our predefined criteria. The first step was to eliminate duplicate records, streamlining the collection for more efficient subsequent analysis. The next phase involved the exclusion of studies that were not directly relevant to our research question. This included:
1. Animal studies: Research conducted on animal models was excluded as our focus was on human studies.
2. Case reports: Single case reports were excluded to concentrate on studies with broader sample sizes that could offer more generalized insights.
3. Studies not meeting criteria: Any studies that did not meet our specific inclusion criteria were carefully filtered out. This ensured that only studies relevant to the intersection of mTBI and PNES were considered.
Following these exclusions, the remaining pool of studies was significantly narrowed down, focusing the review process on the most pertinent and high-quality research available. Of the refined selection, 18 studies were identified as potentially relevant and were subjected to a detailed full-text review. This step was crucial to thoroughly assess each study's adherence to our inclusion criteria and to confirm the presence of data specific to mTBI and PNES. Ultimately, only 7 of these studies provided specific data on the co-occurrence of mTBI and PNES and were thus included in our systematic review. These studies were deemed most relevant for providing insights into the relationship between mTBI and PNES, forming the core of our analysis.
The rigorous and methodical approach to study selection ensured the highest level of relevance and quality in the studies included in our systematic review. The resulting subset of 7 studies offered valuable data and insights, setting the stage for an in-depth analysis of the relationship between mTBI and PNES.
3.1.1 Studies Characteristics and Main Findings
LaFrance et al., in their cross-sectional study involving 255 patients with EEG-confirmed PNES (Table 1) (16), discovered a significant connection between TBI and PNES. They found that 44.6% of PNES patients had a history of TBI, with the majority (73%) being mTBI cases (Table 2). The study highlighted that patients with TBI demonstrated a higher prevalence of mood disorders, increased disability, and lower global functioning compared to their counterparts without TBI. This was further accentuated by notable associations with major depression, post-traumatic stress disorder (PTSD) diagnosis, and a history of trauma or abuse.
Table 1.Study Characteristics
| Study Author and Year | Study Design | Population Characteristics | Diagnostic Criteria for NES |
|---|---|---|---|
| An et al., 2010 (10) | Retrospective review | 64 patients with PNES diagnosis | PNES diagnosed via video/EEG monitoring |
| LaFrance et al., 2013 (16) | Cross-sectional study | 255 patients with EEG-confirmed PNES | PNES confirmed by video EEG |
| Mokleby et al., 2002 (17) | Comparative, cross-sectional study | 23 PNES patients, 23 SD patients, 23 healthy controls | PNES diagnosed based on clinical and EEG criteria |
| Barry et al., 2005 (18) | Retrospective review | 157 patients with NES at a medical center | NES confirmed by video EEG |
| Westbrook et al., 2005 (19) | Retrospective record review | 102 inpatients with NES | NES diagnosed via video EEG and psychiatric interview |
| Pakalnis and Paolicchi, 2000 (20) | Prospective study | 148 pediatric patients with probable seizure disorder | Psychogenic seizures identified by video EEG |
| Salinsky et al., 2015 (21) | Retrospective review | Veterans with PNES or ES diagnosis | PNES and ES diagnosed during epilepsy monitoring |
Abbreviations: PNES, psychogenic nonepileptic seizures; ES, epileptic seizures.
Table 2.Key Findings and Prevalence of Mild Traumatic Brain Injury
| Study Author and Year | Key Findings | Prevalence of mTBI in NES Patients |
|---|---|---|
| An et al., 2010 (10) | 20.3% with head injuries, mostly mild; psychological trauma noted | 20.3% (mostly mild) |
| LaFrance et al., 2013 (16) | 44.6% with TBI, majority mTBI; higher psychiatric comorbidity in TBI group | 44.6% (majority mTBI) |
| Mokleby et al., 2002 (17) | 83% reported minor head traumas; higher levels of psychiatric comorbidity | 83% (minor head traumas) |
| Barry et al., 2005 (18) | 24% with nonepileptic PTS, 78% involving mild HIS; psychiatric problems common | 24% (78% mild HIS) |
| Westbrook et al., 2005 (19) | 32% with head injury, majority minor; high prevalence of psychiatric disorders | 32% (majority minor) |
| Pakalnis and Paolicchi, 2000 (20) | 44% with head injury, more than half mild; focus on pediatric patients | 44% (more than half mild) |
| Salinsky et al., 2015 (21) | 57% with TBI as seizure etiology, 87% mild TBI; significant role of PTSD | 57% (87% mild TBI) |
Abbreviations: mTBI, mild traumatic brain injury; PTS, post-traumatic seizures; PTSD, post-traumatic stress disorder.
An et al. conducted a retrospective review of 64 patients diagnosed with PNES through video/EEG monitoring (Table 1) (10). Their study revealed that 20.3% of these patients had a history of head injuries, most of which were mild (Table 2). Additionally, the study observed that psychological trauma was prevalent in a quarter of the patients, and it categorized the semiology of PNES into three types: Minor motor, major motor, and unresponsive seizures. This research contributed significantly to understanding the prevalence of mTBI in PNES patients, particularly within the Chinese population.
Mokleby et al.'s comparative, cross-sectional study encompassed 23 PNES patients, alongside 23 patients with somatoform disorders and 23 healthy controls (17). The study's striking finding was that 83% of PNES patients reported minor head traumas. It also revealed that PNES patients exhibited significantly higher levels of psychiatric comorbidity, particularly depression and PTSD, and displayed a greater degree of hostility compared to both somatoform disorder patients and healthy controls.
Barry et al. examined the relationship between head injury and nonepileptic seizures in their retrospective review of 157 patients (Table 1) (18). They found that 24% of these patients had nonepileptic post-traumatic seizures (PTS), with a majority (78%) having experienced only mild head injury (Table 2). The study also reported a common occurrence of psychiatric problems among this patient group, which suggested a potential interplay between psychiatric factors and the development of NES following mTBI.
In a retrospective record review of 102 inpatients diagnosed with NES, Westbrook et al. explored the role of head injury as a risk factor for NES (Table 1) (19). They discovered that 32% of these patients had a documented history of head injury, predominantly minor (Table 2). The study also revealed a high prevalence of psychiatric disorders, with the majority diagnosed with conversion disorder, indicating a complex relationship between psychiatric health and NES.
Pakalnis and Paolicchi focused on the pediatric population in their study, using long-term video-EEG telemetry to evaluate 148 patients with a probable seizure disorder (Table 1) (20). Their findings indicated that 11% of these patients had psychogenic seizures, with 44% having a history of head injury, and more than half of these injuries were classified as mild (Table 2). This study was particularly noteworthy for its insights into the prevalence of mTBI in children with psychogenic seizures.
Salinsky et al. conducted a retrospective review to evaluate the role of TBI as a risk factor for PNES among veterans (12). Their study included records from veterans diagnosed with PNES or ES during epilepsy monitoring. The results showed that TBI was the proposed seizure etiology for 57% of PNES patients versus 35% of ES patients, with a significant majority (87%) of PNES cases being mild TBI (Table 2). The study also highlighted the substantial role of PTSD, increasing the likelihood of diagnosing PNES in veterans with a history of mild TBI.
3.1.2. Summary
These studies collectively suggest a notable prevalence of mTBI among patients diagnosed with PNES and underscore the complex interplay between neurological injuries, such as mTBI, and psychiatric factors in the development of PNES. The varied methodologies and population demographics across these studies enrich the understanding of this relationship, highlighting the necessity for comprehensive, integrated approaches in the diagnosis and management of PNES, particularly considering the prominent role of psychiatric comorbidities.
3.2. Comorbidities in Mild Traumatic Brain Injury and Psychogenic Nonepileptic Seizures
The systematic review of studies on the co-occurrence of mTBI and PNES reveals a significant interplay between these conditions and various comorbidities. The presence of comorbid psychiatric disorders and their impact on PNES, particularly in the context of mTBI, emerged as a recurring theme across the studies.
3.3. Psychiatric Comorbidities
3.3.1. Mood Disorders and Depression
Several studies, including those by LaFrance et al. (16) and Mokleby et al. (17), highlighted a higher prevalence of mood disorders, notably major depression, in patients with PNES. This association was more pronounced in patients who had a history of TBI, suggesting that the psychological impact of brain injuries may play a crucial role in the development or exacerbation of these mood disorders.
3.3.2. Post-traumatic Stress Disorder
The study by Salinsky et al., focusing on veterans, provided critical insights into the role of PTSD (12). It indicated that PTSD significantly increased the likelihood of diagnosing PNES in individuals with a history of mTBI. This finding underscores the intricate relationship between traumatic experiences, whether physical or psychological, and the manifestation of PNES.
3.4. History of Trauma and Abuse
The studies also underscored the importance of considering a history of trauma or abuse when evaluating PNES patients. Westbrook et al. reported a notable history of physical or sexual abuse in their patient group, suggesting a complex interplay between various forms of trauma and the development of PNES (19).
3.5. Other Comorbidities
3.5.1. Behavioral Impulsivity and Hostility
3.5.2. Neurological Comorbidities
While the focus was predominantly on psychiatric comorbidities, the potential for co-occurring neurological conditions, albeit not extensively covered in the reviewed studies, should not be overlooked. The relationship between TBI, even when mild, and subsequent neurological sequelae could play a contributing role in the development of PNES.
3.6. Quality Assessment of the Studies
3.6.1. General Approach
The quality assessment of the included studies was conducted to evaluate their reliability, validity, and overall contribution to the research topic of mTBI and PNES. This assessment considered several key factors:
1. Study design and methodology: The appropriateness of the study design for the research question, the clarity in the description of methods, and the adequacy of the statistical analyses performed.
2. Sample size and representativeness: The size of the study population and how representative it is of the broader population affected by mTBI and PNES.
3. Bias and confounders: Identification and control of potential biases and confounding factors that could affect the study outcomes.
4. Reliability and validity of findings: The consistency of the study's findings with existing literature and the robustness of the data collection and analysis methods.
3.6.2. Assessment of Individual Studies
La France et al. utilized a cross-sectional design with a robust sample size and comprehensive diagnostic criteria (16). Potential biases included its retrospective nature and the potential for recall bias (Table 3; Figures 1 and 2). The retrospective design and moderate sample size of the study by An et al. provided valuable insights, particularly for the Chinese population (Table 3; Figures 1 and 2) (10). The study, however, might be limited by cultural and geographic specificities.
Table 3.Bias and Quality Assessment
| Study | Selection Bias | Performance Bias | Detection Bias | Attrition Bias | Reporting Bias | Publication Bias | Confounding Bias | Other Bias | Internal Validity | External Validity |
|---|---|---|---|---|---|---|---|---|---|---|
| LaFrance et al., 2013 (16) | Low | Moderate | Low | Low | Low | Moderate | Moderate | Low | High | Moderate |
| An et al., 2010 (10) | Moderate | Moderate | Low | Moderate | Moderate | Moderate | Moderate | Moderate | Moderate | Moderate |
| Mokleby et al., 2002 (17) | Moderate | Low | Moderate | Low | Moderate | Moderate | High | Low | Moderate | Low |
| Barry et al., 2005 (18) | Moderate | High | Moderate | Moderate | Moderate | Moderate | Moderate | Moderate | Moderate | Low |
| Westbrook et al., 2005 (19) | Moderate | Moderate | Moderate | Moderate | Moderate | Moderate | High | Moderate | Moderate | Moderate |
| Pakalnis and Paolicchi, 2000 (20) | Low | Moderate | Low | Low | Low | Moderate | Moderate | Low | High | High |
| Salinsky et al., 2015 (21) | Moderate | Moderate | Moderate | Moderate | Moderate | Moderate | High | Moderate | - | Moderate |
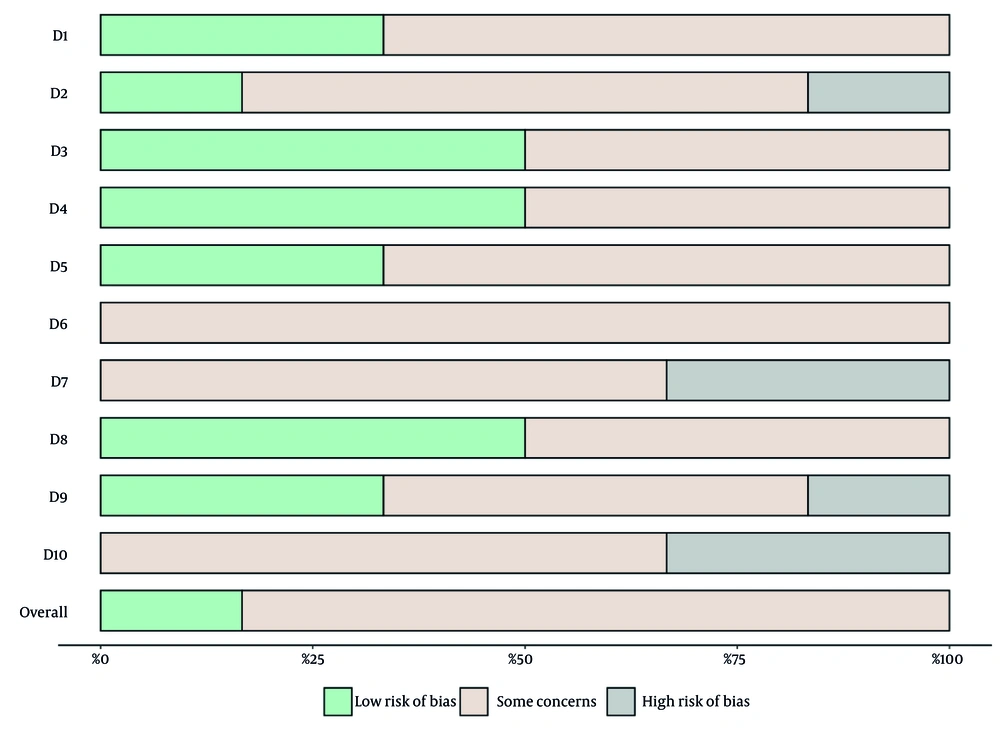
Figure 1.
Risk of bias summary: This bar chart represents a summary of the risk of bias assessment across 10 domains (D1-D10) which are detailed on Table 3 for the studies included in the systematic review.
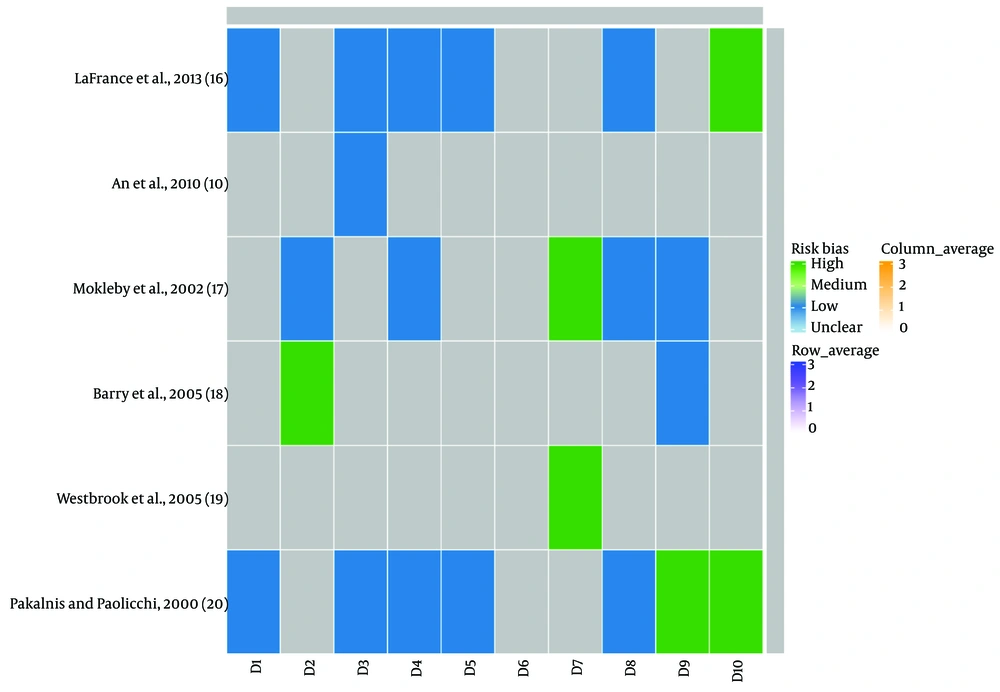
Mokleby et al. conducted a comparative cross-sectional study with a small sample size that offered valuable insights into psychiatric comorbidities in PNES patients (Table 3; Figures 1 and 2) (17). The use of structured psychiatric interviews added methodological strength, though the generalizability might be limited.
The retrospective study design by Barry et al., with a considerable sample size, contributed significantly to understanding NES following head injury (Table 3; Figures 1 and 2) (18). The reliance on medical records might introduce some biases.
The retrospective study by Westbrook et al. provided a comprehensive assessment of NES patients with a history of head injury (Table 3; Figures 1 and 2) (19). The study's reliance on clinical records may limit the depth of information on head injury severity.
4. Discussion
Our systematic review has brought to light the intricate relationship between mTBI and PNES. The studies collectively indicate a notable prevalence of mTBI in PNES patients, often accompanied by a range of psychiatric comorbidities, including mood disorders, PTSD, and histories of trauma or abuse. This association underscores the multifaceted challenges faced by patients with PNES post-mTBI, highlighting the necessity for comprehensive care that addresses not only the seizures but also the broader psychological and neuropsychiatric dimensions of the condition.
The significance of these findings lies in their contribution to a deeper understanding of PNES etiology and manifestation. This enhanced understanding is crucial for developing effective treatment strategies. It suggests that managing PNES, particularly in the context of mTBI, should extend beyond standard neurological care to include psychotherapeutic interventions. Such an integrated approach could lead to improved symptom management, reduced disability, and an overall enhancement in the quality of life for these patients.
While the review has been instrumental in consolidating existing knowledge, the quality and scope of the studies vary. Most are retrospective or cross-sectional, providing substantial correlational data, but their retrospective nature can introduce recall bias and limits the ability to establish causality. The sample sizes and the fact that most studies were conducted in single centers could affect the generalizability of the findings. As a result, these studies may not fully represent diverse populations or healthcare settings, and their applicability to different demographic and cultural contexts might be limited.
Despite these valuable insights, the studies predominantly establish correlations rather than causality. Future research should focus on prospective study designs to elucidate the causal relationships between mTBI and PNES more clearly. Moreover, the role of psychiatric comorbidities, while commonly noted, requires more detailed exploration to understand their exact contribution to the development of PNES following mTBI. Additionally, there is a noticeable gap in research pertaining to pediatric populations, indicating a need for studies focused on younger patients. Our study also highlights the need for continued research into effective treatment strategies that holistically integrate neurological and psychiatric care. Such research is essential for advancing the management of PNES, particularly in patients who have experienced mTBI.
4.1. Proposed Pathogenetic Mechanisms of Psychogenic Nonepileptic Seizures after Mild Traumatic Brain Injury
Previous studies proposed a range of pathogenetic mechanisms potentially linking mTBI to the development of PNES. These mechanisms are multifaceted, involving both non-lesional and lesional phenomena, as well as cognitive-behavioral factors. The correlation between TBI and PNES is complex and influenced by several non-lesional factors. Recall bias and misattribution play a significant role in this context. Patients with PNES, often receiving imprecise explanations for their symptoms, might actively seek plausible causes, leading to the reinterpretation of minor head traumas as significant triggers (21, 22). This phenomenon is particularly notable in the veteran community, where there's a common understanding of the link between TBI and seizures. The implication is that etiological misattributions can foster illness beliefs, influencing symptom expectations and perpetuating dysfunction.
Emotional trauma can act as an affective stressor, inducing long-term changes akin to those observed in PTSD. This includes alterations in stress responsivity and metacognitive function. Maladaptive emotional learning, where acute stress and concussive symptoms lead to neuropsychiatric dysfunction, can create a “seizure scaffold” that responds to emotional, somatic, or trauma-related cues (23, 24).
Lesional factors in PNES post-mTBI revolve around axonal injury and altered global functional connectivity. This disruption or destabilization can predispose individuals to dissociation by affecting metacognitive faculties like cognitive inhibition and self-awareness (25-28). Considering a structural predisposition to PNES after mTBI involves understanding neurobiological commonalities. The PNES, often viewed as dissociative events, entail cognitive deficits like loss of inhibitory control and emotion dysregulation. Studies using Diffusion Tensor Imaging (DTI) and other imaging methods have identified alterations in network connectivity in PNES patients, suggesting these disruptions as a defining feature (29, 33),(34-37), (38-41).
The hypothesis of dissociogenic brain lesions posits that mTBI-related disruptions of long-range connectivity might predispose individuals to dissociative experiences and PNES. Focusing on specific pathways like the uncinate fasciculus, which connects limbic structures to prefrontal cortices, reveals potential biological links. Dissociative symptoms and disorders following mTBI further support this hypothesis, with studies showing an increased reporting of such symptoms post-injury (42-48).
In summary, the pathogenesis of PNES following mTBI is likely multifactorial, encompassing a combination of psychological, behavioral, and neurological factors. These include emotional stress, maladaptive learning processes, and structural changes in brain connectivity. Understanding these mechanisms is crucial for developing comprehensive treatment strategies for PNES post-mTBI, emphasizing the need for a holistic approach that addresses both structural predispositions and functional disturbances in neuropsychiatric disorders.
4.2. Future Directions
4.2.1. Prospective and Longitudinal Studies
To overcome the limitations of retrospective designs, future research should include prospective and longitudinal studies. These studies can provide more robust evidence on causality and the long-term outcomes of patients with PNES following mTBI.
4.2.2. Focus on Pediatric Populations
Given the limited data on pediatric populations, future studies should focus on this group to understand how mTBI impacts the development of PNES in children and adolescents.
4.2.3. Enhanced Treatment Strategies
Research should continue to explore integrated treatment approaches that combine neurological care with psychological and psychiatric interventions. This would involve the development and testing of multidisciplinary treatment models tailored to the needs of individuals with PNES post-mTBI.
4.2.4. Mechanistic Studies
There is a need for mechanistic studies to explore the underlying pathophysiological processes that link mTBI to PNES. This includes research into brain network disruptions, cognitive impairments, and emotional processing alterations following mTBI.
4.2.5. Addressing Comorbidities
Future research should also focus on the role of psychiatric comorbidities in PNES development and management. Understanding these comorbidities is crucial for developing targeted interventions and improving patient outcomes.
4.2.6. Quality of Life Studies
Studies focusing on the quality of life of patients with PNES post-mTBI can provide insights into the everyday challenges faced by these individuals and inform more patient-centered care approaches.
4.2.7. Public Health Implications
Given the prevalence of mTBI and PNES, there is a need for public health initiatives that raise awareness about these conditions, improve early diagnosis, and ensure access to comprehensive care.
In summary, while the systematic review sheds light on the significant association between mTBI and PNES, it also opens avenues for future research. By addressing these gaps, the medical community can enhance the understanding and management of PNES, particularly in the context of mTBI, ultimately improving the care and quality of life for affected individuals.
5. Conclusions
The systematic review provides a nuanced understanding of the relationship between mTBI and PNES. It underscores a significant prevalence of mTBI in individuals with PNES, along with associated psychiatric comorbidities. The findings from the reviewed studies highlight the complex interplay between neurological injuries and psychological factors in the manifestation of PNES, emphasizing the need for a comprehensive approach in both diagnosis and treatment. The intricate correlation between mTBI and PNES suggests that patients benefit most from treatment strategies that address the multifaceted nature of their condition. This involves not only managing the neurological aspects but also considering the psychological impact and potential neuropsychiatric complications. For patients, such a holistic approach could lead to better management of symptoms, reduced disability, and an overall improvement in quality of life.


