1. Background
Experienced duration or interval timing refers to the subjective perception of elapsed time during a specific period (1-3). In experimental studies of time perception, participants in the time reproduction task are presented with a standard interval (encoding phase) and are required to reproduce that interval timing (i.e., by pressing a mouse button or key) (4, 5). Additionally, the participant's performance during reproduction depends on various cognitive functions, including attention, inhibition (6), and preparation (7, 8). These cognitive mechanisms can impact performance at reproduction independently or in harmony with other factors like proceduralization, frequency, and recency of learning trials (9). Multiple factors such as physiological and emotional states (10, 11) or temporal modulations of the sensory stimuli such as repetitive stimuli exposure either before (12) or concurrently with stimulus presentation might also influence time perception (8, 11, 12).
As a classical and cognitive model, the scalar expectancy theory (SET) proposed that the interval timing is estimated by a pacemaker, an accumulator, and a comparator function (13). As neurobiological substrates of basic models such as SET, the striatal-beat frequency (SBF) model postulated that the coincident pattern between cortical oscillatory activity at different frequencies and the detector components of medium spiny neurons (MSNs) results in interval timing encoding. The SBF model assumes that cortical oscillation phases reset when interval timing begins and become asynchronous due to the different frequencies during interval timing. The MSNs detect concurrent cortical oscillations firing at the same frequencies (as input) and convert them into temporal units (as the output) (14, 15).
Studies have utilized repetitive stimuli in the visual (flickers) (16, 17) and auditory (click train) (12, 18) modalities to examine their effects on time perception. In this research, we were interested in click trains compared to constant auditory stimuli.
1.2. Click Train-Induced Time Perception Distortions
Time dilation refers to perceived interval timing exceeding its actual duration (19). According to neural studies, time distortion is based on the relationship between neural response magnitude and perceived interval timing (20). A longer perceived duration results from a higher neural response to a stimulus arriving in phase with neural oscillation. The click train as a rhythmic sound enhances neural response and connection by increasing the frequency of pulses and amplifying the response, resulting in time dilation (13, 18). An alternative explanation for the temporal dilation is that automatic arousal generated by click trains speeds up the rate of the neural timing system and thus significant increases in the estimation of duration (12).
Based on the SBF, the frequency and or amplitude of oscillators are altered by the stimulus rate (21). Consequently, click train-driven oscillators influence time estimation, leading to an overestimation of encoding time by MSNs. The synaptic weight between MSNs and cortical neurons determined the duration encoded by MSNs (14).
Time dilation can be explained by the entrainment of neural activity. Neural entrainment is the phase lock between the frequency of endogenous oscillators and exogenous stimuli (22). This phenomenon was implemented in the SBF model to explain stimulus exposure, and it was hypothesized that neural entrainment induces time dilation at a stimulated frequency by modifying the oscillator and detector firing patterns (19).
In this line, fMRI studies indicated greater brain activity in bilateral superior temporal gyri, insula, basal ganglia, supplementary motor area (SMA), and cuneus during rhythmic auditory stimulus representation (23).
Numerous studies have proposed that the visual flicker and click trains are reliable methods for studying time dilation (13, 20, 24-26). Click trains and flickers are used to assess the effects of pre-stimulus events preceding a comparison interval on reaction time (27), as well as time estimation accuracy, bisection tasks (17, 28), and time reproduction tasks (16).
Tipples et al. indicated that click train induced time dilation in the bisection paradigm in which participants had to distinguish between short (400 ms) and long (1600 ms) durations. They modeled response time using Bayesian hierarchical drift diffusion modeling (HDDM) and proposed it to determine how we perceive time (29). Wearden et al. investigated the click train influence and its residual effects. They demonstrated that the higher the preceding click frequency, the longer the subsequent duration was perceived. In addition, the entrainment effect was examined 8s after hearing clicks, indicating a delay between activation and suspicion of attentional pulses (27).
1.3. Event-Related Potentials Investigation of Click Train Effects
Electroencephalography (EEG) recording during the click train representation might be helpful to distinguish the neural entrainment due to oscillators (16). Electroencephalography recordings show a slow potential contingent negative variation (CNV) during the encoding and reproduction phases (1, 14, 30, 31). Contingent negative variation is an ERP component eliciting in the frontal and central areas and is generated in the SMA (32, 33). It occurs when a participant attends to a stimulus, expects a second stimulus, or is required to respond to an imperative anticipatory stimulus (34). Consequently, cognitive processes, including attention, response inhibition, response preparation, and expectation (35), are reflected in the CNV component. An early CNV component is associated with orienting of attention, arousal and stimulus expectation during the encoding phase of interval timing between 300 and 800 ms after the onset of stimulation (33), and the frontal electrode (Fz) is linked to these functions (4).
Contingent negative variation is related to preparation, planning, decision-making, and movement in reproduction phases and these functions occur in the central area (36). During the reproduction phase two components of the CNV could be differentiated: An early CNV and a late CNV. The early CNV is believed to reflect various processes including attentional processing and arousal (31). The late CNV is considered an indicator of motor preparation required for a response (37). According to reports, the amplitude of the CNV is also related to the accuracy of interval timing (30). Moreover, the flicker stimulus influences the amplitude of CNV in the central electrode (Cz) (25).
Mitsudo et al. examined the neural mechanism involved in the sub-second time reproduction task. During the encoding phase, they used 600 or 800 ms interval timing with three 20 ms sounds between two flashes and found that CNV was larger in the prefrontal area (38). Hashimoto and Yotsumoto combined neural entrainment with a neural model of time perception to illustrate time dilation (19). Neural entrainment occurred after the flicker ended (39). Furthermore, Hashimoto found that a larger amplitude of the ERP component stimulated frequency corresponded to a longer dilation in reproduction (16).
2. Objectives
Since one of the limitations of behavioral studies is that the impact of click trains may only be evaluated during the reproduction phase, it is vital to examine the neural changes that occur during the encoding phase. Thus, it is worthwhile to investigate click trains combined behavioral and physiological effects at various supra-second intervals. This study also investigated whether the click train modulates the CNV differently at various intervals (1400, 1600, 1800, and 2000 ms) at the frontal and central based on cognitive functions. The present study analyzed Event-related potentials (ERPs) for encoding and reproduction durations during click trains and without that. Specifically, we were interested in the click train-induced dilation and isolation of elicited ERPs by stimuli during the time perception and reproduction stages. It was hypothesized that click trains might induce time dilation, and the CNVs in these conditions might be negatively larger.
3. Methods
3.1. Participants
Thirty-three right-handed adults (men = 15, women = 18) between 23 and 35 years (mean = 29.2, SD = 4.4) without neurological or psychiatric disorders participated in this research. Furthermore, they didn’t have any familial history of psychiatric disorders. Participants were asked about smoking or medications and they didn’t use them regularly. Three participants were excluded from analyses due to increased physiological (sweat) and movement artifacts (25% of their trials contained artifacts) (40). We used G Power 3.1.9.7 to estimate the minimum sample size (41) to achieve the desired level of statistical power, considering the effect size (f = 0.25) and alpha level (significance level of 0.05). This sample size is also consistent with previous ERP research in general (42, 43). Participation was voluntary, the task was explained, and subjects were blinded to the study's purpose, hypothesis, and encoding intervals. No feedback was provided throughout the task. This research followed the ethical guidelines of the World Medical Association (Declaration of Helsinki) and was approved by a local committee on human experimental research (IR.TABRIZU.REC.1400.076). All participants signed consent forms.
3.2. Experimental Design
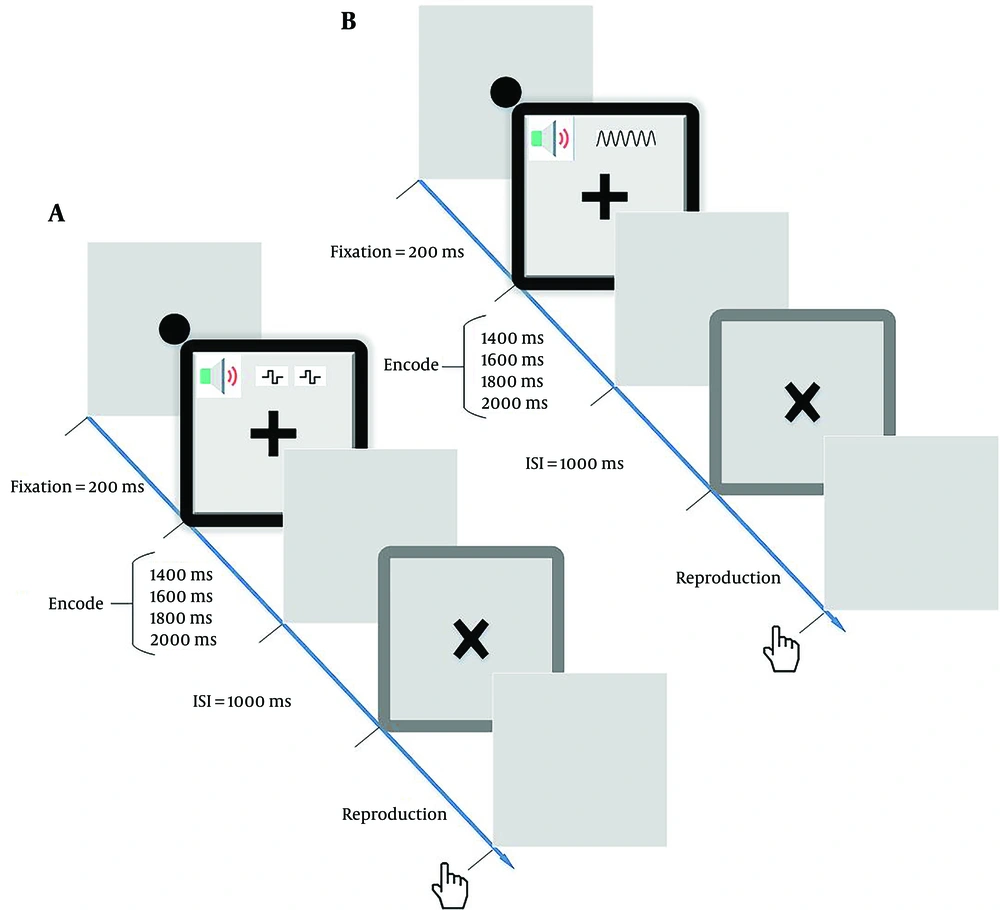
The task comprised two click trains and constant (continuous sound) conditions in different interval timings (1400, 1600, 1800, or 2000 ms). The click train/constant condition was presented concurrently with a continuous visual stimulus ("+” sign) during the encoding phase. According to previous studies, a 10 Hz click train stimulus was presented (16).
In each trial, a black circle in the center of the display served as a fixation point for 200 ms. The encoding duration (a square with a black circumference shown in g. 1) began with a “+” sign (shown continuously) and an auditory stimulus (click train or constant) simultaneously in varying durations (i.e. 1400, 1600, 1800, or 2000 ms). Then, the “+” sign disappeared from the screen, and the gray screen was shown for 1000 ms as an inter-stimulus-interval. Finally, the “×” symbol indicates the beginning of the reproduction duration (a square with a dark gray circumference shown in Figure 1).
Schematic illustration of experimental conditions in the time reproduction task. The encoding and reproduction phases are indicated by a square with a black circumference and a square with a dark gray circumference, respectively. The contingent negative variation (CNV) was computed during both phases: A, click train condition; and B, constant condition.
Participants were instructed to click the right mouse button when they believed the “×” appeared on the screen for the same duration as the “+” symbol (encoding duration). A mouse click was identified as the end of the reproduction phase. The subsequent trial started after showing a gray screen as the inter-trial interval for 1000 ms (Figure 1). Each interval timing (1400, 1600, 1800, and 2000 ms) comprised 25 trials; therefore, each click train and constant condition involved 100 trials. The 200 trials were divided into four blocks of 50, with each block containing at least ten repetitions of each interval timing in a randomized order. Before starting the experiments, the participants were trained via five practice trials.
The auditory stimuli were presented with a sampling rate of 44,100 Hz and 16-bit accuracy binaurally (via two speakers placed on either side of the computer screen) at around 60 dB, based on the average detection thresholds of five normal hearing participants listening to click trains and constant (44). Therefore, the only difference between the conditions was the continuous or repetitive presentation during the encoding phase.
3.3. Electroencephalography Recording
A Mitsar 201 with a 19-channel Electro cap (Electro-cap International Inc.) was used to record EEG signals according to the 10 - 20 international system (Fp1, Fp2, F3, F4, C3, C4, P3, P4, O1, O2, F7, F8, T3, T4, T5, T6, Fz, Cz and, Pz,). Electroencephalography signals were recorded using a linked ear reference montage, wherein the signals from both ears were averaged and used as the reference for all scalp electrodes. All input signals were referenced to connected earlobes, and Afz was designated as the ground electrode. The sampling rate for EEG signals was set to 250 Hz and filtered between 0.5 and 30 Hz. Impedance was maintained at below 10 kOhm. Participants’ EEG signals were recorded during task performance.
3.4. Behavioral Data Processing
The accuracy and consistency of time reproduction were calculated in the statistical analysis. The T-corrected score was used to measure time reproduction accuracy. This score is determined by the proportion of errors in the reproduced interval timing relative to the encoding duration. The T-corrected score = [(reproduction time-encode time)/encode time)]. A zero T-corrected score reflects optimal performance. Positive values indicate over-reproduction, while negative values indicate under-reproduction. The coefficient of variation (CV) indicates a mean standardized measure of variability as a measure of temporal variability and timing sensitivity. This study calculated CV by dividing the reproduced interval timing’s standard deviation by its mean for every participant and condition (8).
Stimulus type and interval timing were considered independent variables and T-corrected scores and CVs (measures of time reproduction) were dependent variables. Two repeated-measures analyses of variance (ANOVA) were used for T-corrected scores and CVs to evaluate the effect of stimulus type and interval timings on time reproduction. Stimulus type (click train vs. constant) and interval timing (1400 vs. 1600 vs. 1800 vs. 2000) were considered within-subject factors. In addition, a post hoc t-test was conducted when applicable, and the effect size was estimated as partial eta. SPSS (v. 22) and Jamovi 1.1.9 software were used for data analysis.
All post hoc tests were corrected for family-wise error rates using the Holm corrections.
3.5. Electroencephalography Data Pre-processing
Win EEG and MATLAB (v. 16) were employed to process EEG signals. To remove out-of-band noise, the EEG time series were low pass-filtered with 30 Hz and high pass-filtered with 1 Hz cut-off frequency with Butterworth 2-order filters. Baseline correction was done, and Independent Component Analysis (ICA) decomposed EEG signals. Eye blinks, horizontal eye movements and muscle artifacts were corrected by zeroing the activation curves of the individual ICA algorithm (45). In addition to rejecting artifacts, EEG signals for slow (0.1 to 1 Hz) and fast (20 to 35 Hz) frequency bands with excessive amplitude ([> 60 μV] and [> 30 μV], respectively) were marked and excluded from further analysis. Finally, the EEG was visually inspected for the remaining artifacts.
3.6. Event-Related Potentials
Event-related potentials for all durations were computed for each click train and constant conditions (encoding and reproduction phase) at the Fz and Cz based on previous works (46). These electrodes were also selected based on the spatial filter that showed the mean difference of CNVs (constant and click train) was significant, and the CNV’s amplitudes were larger in these sites than in the other electrode sites (40). Considering the distinct cognitive functions associated with each condition and the presence of different generators, direct comparison between the encoding and reproduction phases within the same condition may not be necessary. Nevertheless, we conducted correlation analyses between the encoding and reproduction phases within each condition (Appendix 1 in supplementary File).
The mid-frontal CNV amplitude was calculated as the mean ERP amplitude 300 - 800 ms after the stimulus onset (click train/constant coincident with “+”) in the encoding phase and 300 - 500 ms after the “×” onset in the reproduction phase (46). We limited the time-locked ERPs durations to the onset of attentional and arousal allocation. By focusing our analysis in this so-called “initial” CNV or iCNV we were interested in associations with attentional and arousal processes in task engagement. Squares represent these phases in Figure 1 with black circumferences and dark gray circumferences, respectively.
Repeated measures ANOVA was used to evaluate the influence of stimulus type and interval timings on CNV amplitude. Stimulus type (click train vs. constant) and interval timing (1400 vs. 1600 vs. 1800 vs. 2000) were considered within-subject factors.
3.7. Evaluation of the Brain-Behavior Relationship
Linear mixed-effects models (LMEs) were calculated between behavioral (T-corrected scores and CVs) and CNV measures in each condition to investigate the brain-behavior relationship. Linear mixed-effects models are extensions of standard regression models and are particularly useful for ERP studies where both condition differences and individual differences are present (47).
In this study, we focused on evaluating the influence of behavioral predictors (i.e., fixed effects) while accounting for within-subject variation across different conditions. The random effects, which would typically capture individual variation in intercepts or slopes, were not included in our analysis. Therefore, our results and interpretations are based solely on the fixed effects, which are appropriate for the research questions we aimed to address (48).
The CNVs in each phase and condition, as well as the main effect of behavioral scores, were utilized as dependent variables and predictors, respectively. We corrected the family-wise error rate in the LME models, which were calculated using the restricted maximum likelihood (REML) method in SPSS.
3.8. Electroencephalography Amplitude Spectrum Quantification
Amplitude spectra were computed for click train and constant conditions in the encoding and reproduction phases. Fast Fourier transforms (FFTs) were computed using constant epochs, high-pass filtered EEG with 50% overlap, and zero-padded 5-s click train segments based on the study by Luck (40). Separate analyses were conducted for each phase at the identified CNV site. The amplitude spectra were computed for participants and epochs (40). To this end, the Fourier function and relevant scripts added to ERPlab in February 2019 were utilized.
4. Results
4.1. Behavioral Results
The mean of the dependent variables is shown in Table 1. The alpha level was considered 0.05 for all statistical tests.
| Time Interval | Mean Reproduced Time (ms) | T-Corrected Score | CV (ms) | |||
|---|---|---|---|---|---|---|
| Constant | Click Trains | Constant | Click Trains | Constant | Click Trains | |
| 1400 | 1470.32 ± 195.77 | 1573.92 ± 224.16 | 0.05 ± 0.134 | 0.124 ± 0.155 | 19.5 ± 4.953 | 18.8 ± 4.34 |
| 1600 | 1598.25 ± 188.06 | 1664.19 ± 190.5 | -0.001 ± 0.114 | 0.04 ± 0.115 | 19.16 ± 5.385 | 17.9 ± 3.73 |
| 1800 | 1703.28 ± 214.06 | 1745.27 ± 201.02 | -0.053 ± 0.115 | -0.03 ± 0.109 | 17.64 ± 5.322 | 17.07 ± 4.27 |
| 2000 | 1745.71 ± 205.88 | 1850.92 ± 184.41 | -0.127 ± 0.099 | -0.074 ± 0.091 | 18.82 ± 4.654 | 17.17 ± 4.38 |
| Total | 1629.39 ± 200.94 | 1708.57 ± 200.022 | -0.0327 ± 0.115 | 0.015 ± 0.117 | 18.78 ± 5.078 | 17.73 ± 4.18 |
Abbreviation: CV, coefficient of variation.
a Values are presented as mean ± SD.
Repeated measures ANOVA indicated that the main effect of stimulus type on the T-corrected score was significant [F (1, 29) = 23.80, P = 0.001, ηp2 = 0.45], implying longer reproduction time in the click train condition in comparison to the constant condition (Figure 2).
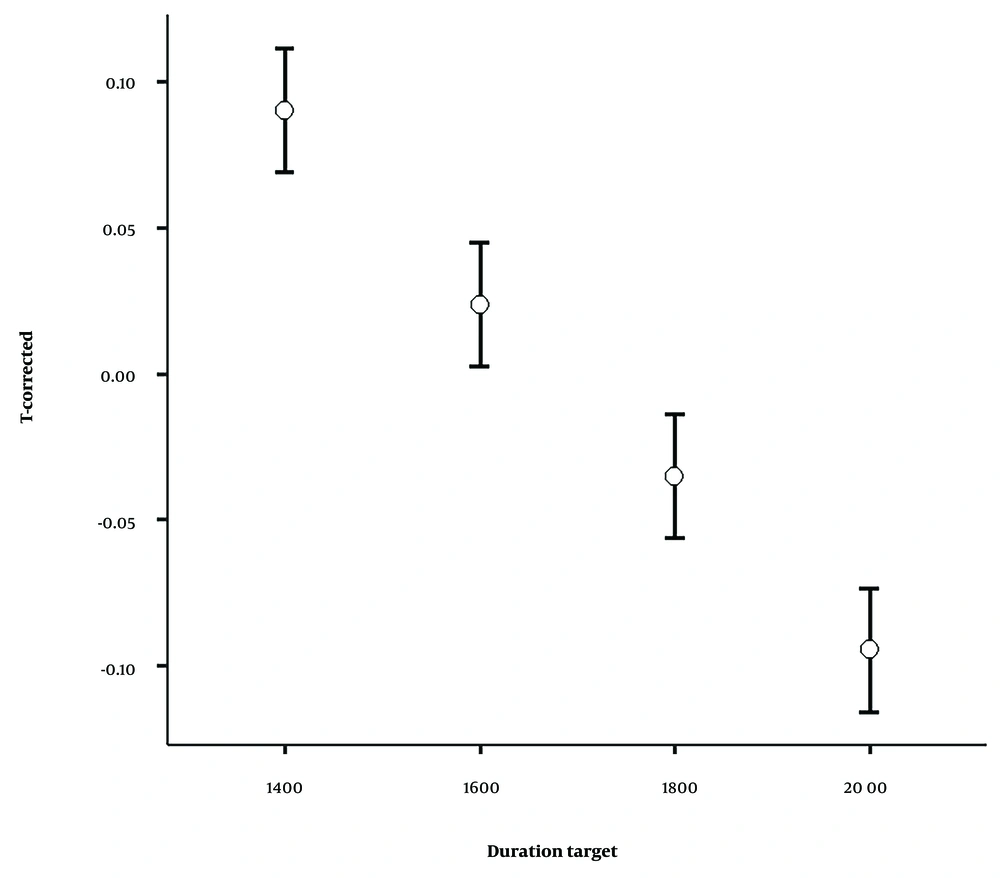
The effect of interval timing was also significant [F (3, 87) = 87.16, P = 0.001, ηp2 = 0.75], indicating that for both stimulus types, extending the interval timings results in increased under-reproduction (Figure 3). A post hoc test was used to evaluate the mean differences of the T-corrected score between interval timing pairs. All comparisons between interval timing pairs were statistically significant (P = 0.001).
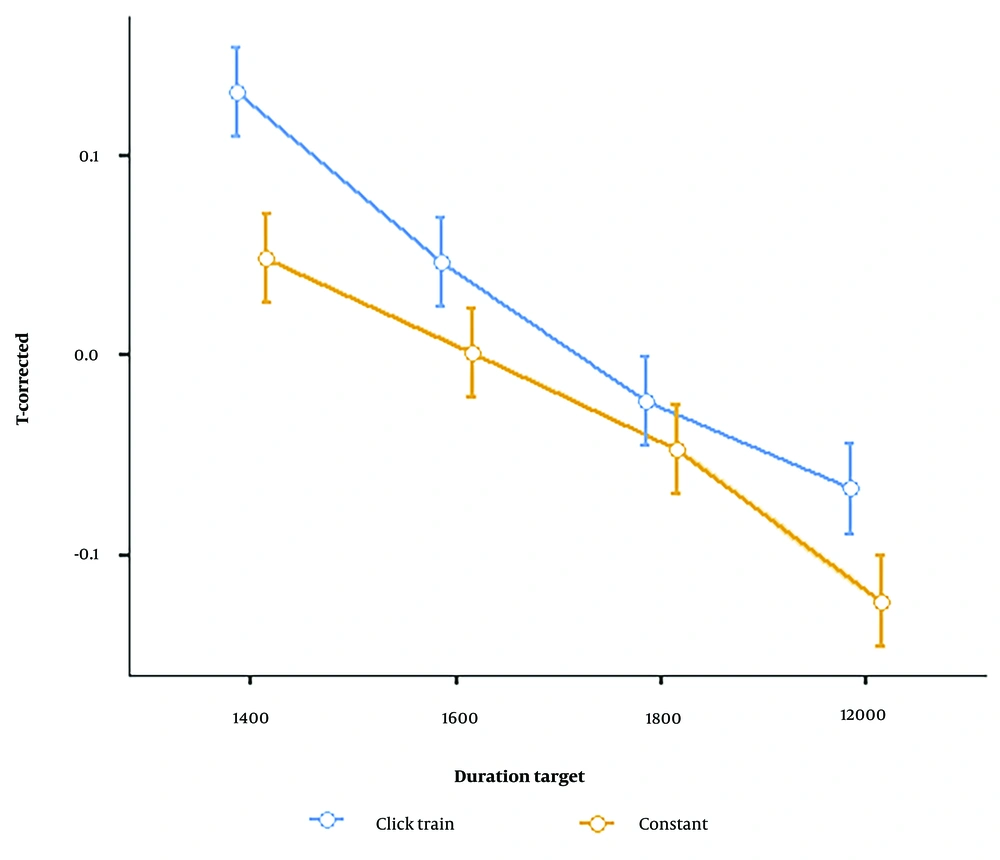
Similarly, the interaction between stimulus type and interval timing was significant [F (3, 87) = 6.65, P = 0.001, ηp2= 0.18], indicating the differences in the reproduction of the various durations are stimulus (condition) dependent (Figure 4). The differences in T-corrected scores induced by each stimulus were calculated at each interval to calculate these results. Then, a post hoc test was conducted to determine the mean differences between pairs of interval timing differences. The differences were subsequently calculated. These were determined by subtracting the click train from the results of the constant conditions, followed by a post hoc test between the interval timings pairs. The comparisons revealed that the mean difference of interval timing pairs was significant (Table 2).
| Interval Timing | Interval Timing | Mean Difference | SE | df | t | pholm |
|---|---|---|---|---|---|---|
| 1400 | 1600 | 0.0664 | 0.0120 | 87.0 | 5.54 | < 0.001 |
| 1800 | 0.1254 | 0.0120 | 87.0 | 10.45 | < 0.001 | |
| 2000 | 0.1848 | 0.0120 | 87.0 | 15.40 | < 0.001 | |
| 1600 | 1800 | 0.0589 | 0.0120 | 87.0 | 4.91 | <0 .001 |
| 2000 | 0.1184 | 0.0120 | 87.0 | 9.86 | < 0.001 |
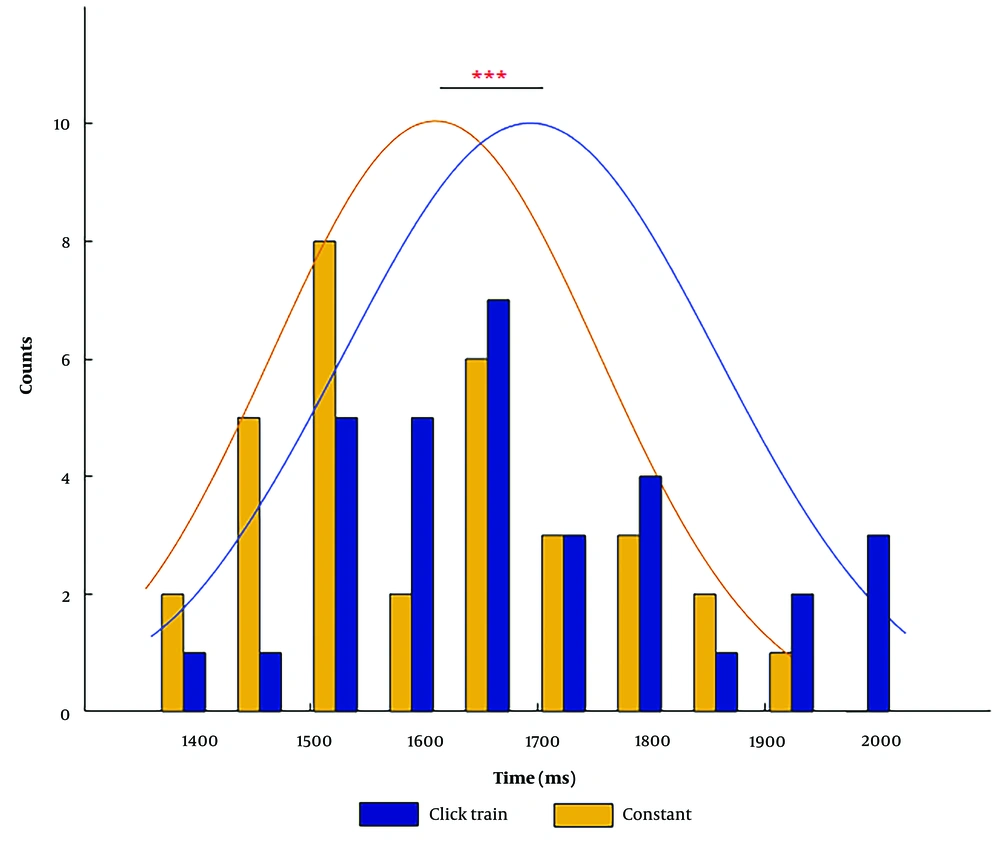
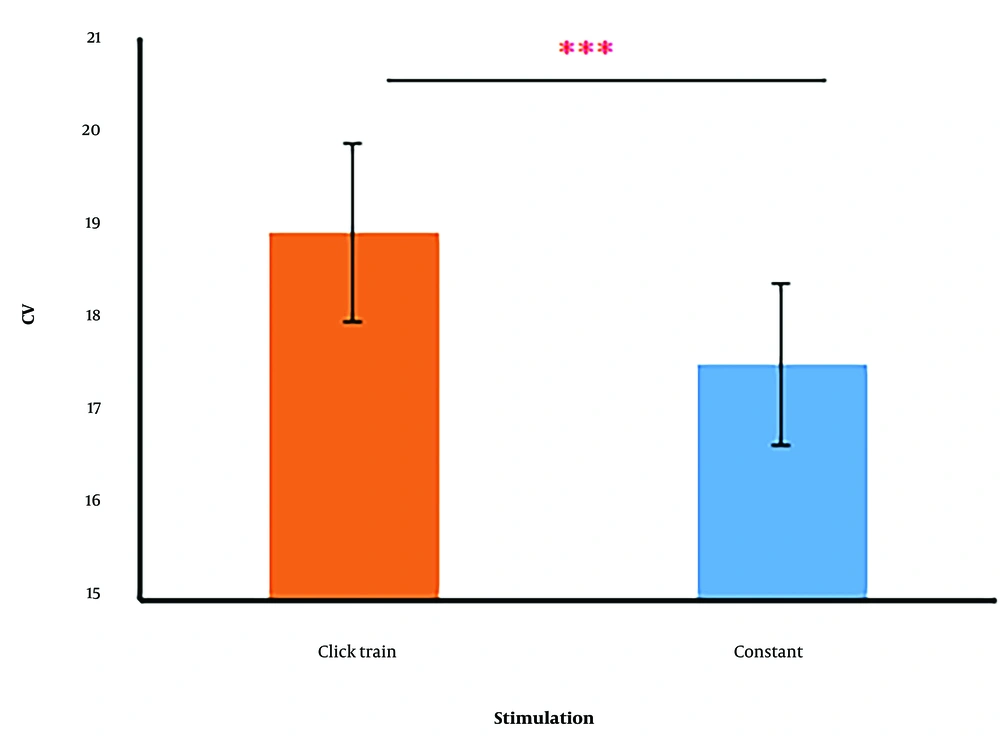
Repeated measure ANOVA for CV revealed a significant stimulus type main effect [F (1, 29) = 5.46, P = 0.027, ηp2 = 0.159]. During the click train stimulus exposure, the variability of reproduced interval timings was reduced, and subjects responded more consistently (Figure 5). Although a significant main effect of interval timing was observed [F (3, 87) = 3.68, P = 0.016, ηp2 = 0.11] based on the family-wise error correction, the post hoc test performed on the mean differences of CV between pairs of interval timings. The comparisons revealed that the mean difference of 1400 vs. 1600 interval timing pairs was significant (mean differences = 1.79, SE = 0.6, t = 2.98, P = 0.02), and the remaining differences were not statistically significant. Finally, there was no significant interaction between stimulus and interval timing.
Bar chart of the reproduced interval timing's coefficient of variation (CV). there is a significant difference in both stimulus types. Click train stimulus led to the dispersion of reproduced interval timings being lower. *** significant difference (P < 0.001) between click train and constant stimuli.
4.2. Event-Related Potential Results
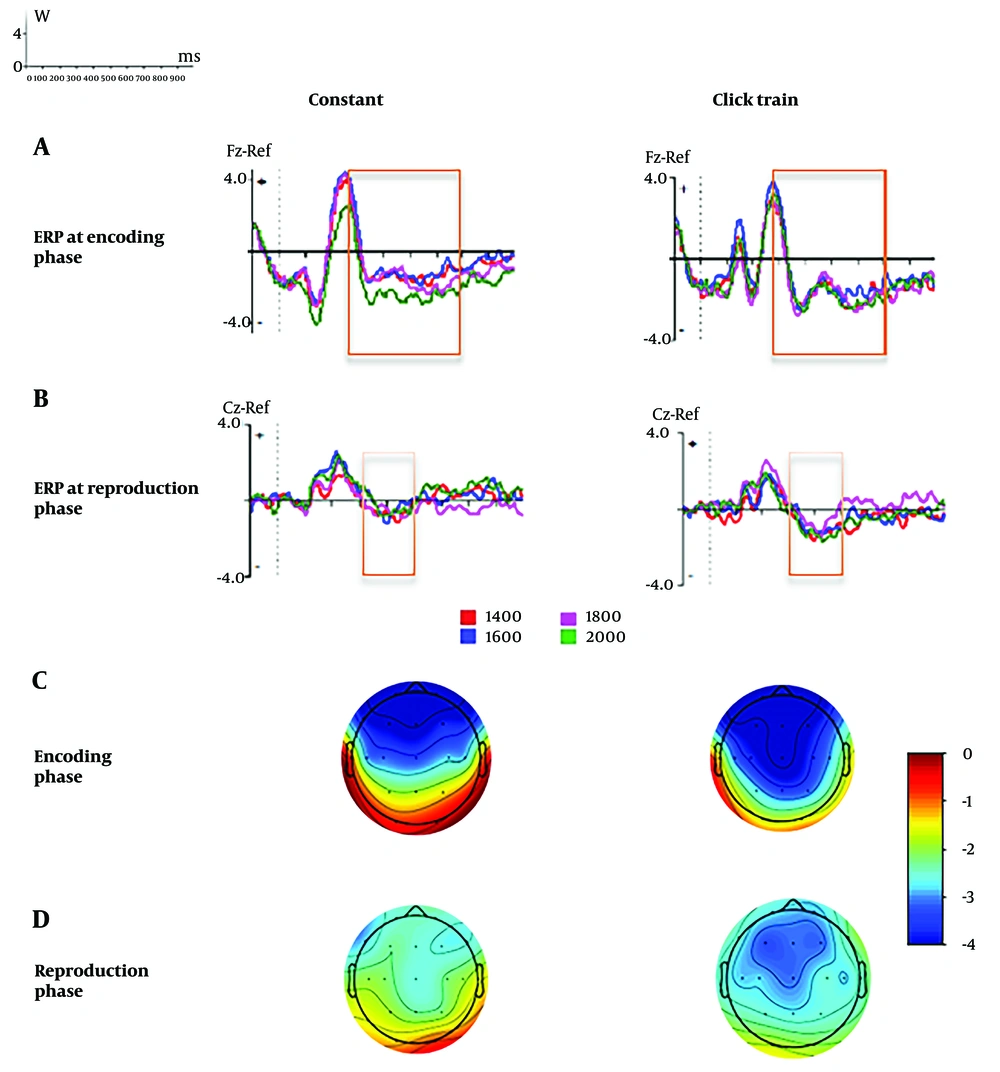
The ERPs and topographical maps across interval times (1400, 1600, 1800, and 2000 ms) for click train and constant conditions (separately) in the encoding and reproduction phases are depicted in Figure 6A, B, C, D respectively.
Event-related potentials (ERPs) in encoding and reproduction phases over the first 1000 ms of encoding and reproduction phases. Y and X-axis indicate the amplitude and the time, respectively. The time axis divides into 100 ms intervals (based on the panel in the upper-left corner). The contingent negative variation (CNV) was computed based on the window between 300 ms and 800 ms after the onset of encoding and between 300 ms and 500 ms reproduction A, ERP at Fz electrode during the encoding phase; B, ERP at the central electrode (Cz) electrode during the reproduction phase. The topographies of the CNV for the constant (left panel) and click train (right panel) are based on the window between 300 ms and 800 ms after the onset of; C, the encoding phase and between 300 ms and 500 ms after the onset; and D, the reproduction phase. In both the encoding and reproduction phases, the CNV in the click train is more negative than the constant condition. The difference in CNV amplitude was significant in the central area during the reproduction phase. The start of the encoding and the reproduction are shown with the “+” and vertical dashed line. In the reproduction phase (after presenting the “×” sign in Figure 1), the CNV was shown before the response.
In the reproduction phase, the repeated-measures ANOVA on mean CNV amplitude revealed a significant main effect of stimulus [F (1, 29) = 7.78, P = 0.010, ηp2 = 0.22], indicating that during reproduction, the CNV amplitude was significantly more negative for the click train stimulus than for the constant stimulus. In our results, there was no significant interval timing difference for CNV amplitude in the reproduction interval timing [F (3, 87) = 0.359, P = 0.158, ηp2 = 0.006]. Similarly, the interaction effect of stimulus × interval time [F (3, 87) = 1.57, P = 0.920, ηp2 = 0.006] was not statistically significant.
The main effect of stimulus [F (1, 29) = 0.001, P = 0.980, ηp2 = 0.00] and the interaction effect of stimulus × interval timing [F (3, 87) = 0.800, P = 0.497, ηp2 = 0.027] were not significant during the encoding phase. However, a significant main effect of interval timing was observed [F (3, 87) = 2.79, P = 0.045, ηp2 = 0.088]. Moreover, according to the post hoc and family-wise error rate, there were no statistically significant differences between interval timings in the mean CNV amplitude.
4.3. Evaluation of the Brain-Behavior Relationship
In the LMEs analysis, the optimal mixed-effects regression model was initially derived using an iterative model selection procedure. The significance of fixed effects included in the best-fitting model was then evaluated.
The CV at 1800 ms predicted the CNV amplitude during the encoding phase when a click train was present. According to the behavioral findings, the effect of click train on the CV was also statistically significant (estimate = 0.385, Std. error = 0.102, df= 29, t = 3.762 P = 0.001). Since an increase in CV indicates a decline in response accuracy and heterogeneity, response accuracy and uniformity are diminished. The reproduction's positive CV estimate indicates that response variability accurately predicted CNV amplitude increases.
In addition, T-corrected at 1400 ms is a significant predictor factor for relationships with CNV during the reproduction phase under a constant stimulus (estimate = -7.041 Std. error = 2.595 df = 29 t = -2.713 P = 0.011). Behavioral data indicate that response accuracy is greater under constant conditions than under click train conditions. The click train augments the CNV's amplitude. As a result, the CNV amplitude was more negative when reproduction was overestimated.
4.4. Electroencephalography Spectral Quantification
The frequency-domain characteristics of EEG were compared in click train and constant conditions to verify the click train effect on EEG oscillation. To this end, the amplitude density ranging from 1 to 60 Hz frequency was calculated (40). Figure 7 indicates this characteristic for each encoding and reproduction phase, averaged across intervals and participants. The amplitude of the 10 Hz was significantly larger in the click train condition than in the constant condition (t = 3.173, P = 0.002) in the encoding phase (Figure 7A). Moreover, while there seemed to be a greater amplitude in the click train condition compared to the constant condition, the observed difference did not reach statistical significance (t = 1.698, P = 0.09, Figure 7B).
Amplitude density as a function of the frequency of the electroencephalography (EEG) signal in each phase and condition averaged across participants: A, amplitude density at egncoding phase (Fz electrode); B, amplitude density at reproduction phase (Cz electrode). There is a larger amplitude at 10 Hz in the click train than in the constant condition in the encoding phase.
5. Discussion
This study examined the behavioral and neurophysiological effects of click trains on time reproduction and demonstrated that click trains induce time dilation of varying durations. We also investigated the changes in neural mechanisms during the encoding phase and reproduction phases by taking into account the CNV component. Although, the CNV is a long-latency fluctuation with cognitive and motor (47), in the current study, the analysis of the CNV was focused on cognitive functions that occur during the attentional processing with regard to the stimulus in the encoding phase rather than motor preparation stages. Findings demonstrated that CNV amplitude was altered during click train exposure in the reproduction phase. In addition, various durations (1400, 1600, 1800, and 2000 ms) were examined in each condition to determine the effect of the click train on the sensitivity and accuracy of time reproduction and modulation of CNVs, which had a different effect during intervals. Finally, the correlation between behavioral and electrophysiological measures was investigated.
Our behavioral findings were consistent with previous reports of click train and flicker-induced time dilation (24, 48, 49), longer reproduced interval timing was observed in the click trains than in the constant condition (Figure 2 and Table 2). moreover, the click train effect persisted for an additional 0.5 seconds after offsetting, this result is in line with the study that indicated the visual flicker effect after the stimulus offset (39).
According to SBF, external click trains entrained intrinsic oscillators. Changes in the oscillator's frequency-modulated timing activated coincidence detector neurons earlier than physical duration, leading to longer time reproduction (22). A reproduction task study revealed that 10 Hz flicker is associated with longer reproduction, indicating that flicker-induced neural entrainment affected time dilation (22). Consequently, the click train had varying effects on interval timings. As shown in Figure 3, the accuracy of interval time reproduction in 1600 ms is superior to that of the other types of stimulus presentation. The neural circuits of relative beat-based timing in the click train are striatal-thalamocortical. Click train influences direct and hyper-direct pathways that connect the cortex to the basal ganglia during time perception. Temporal information is sent throw the direct pathway from the prefrontal cortex via basal ganglia while the click train is reset. Furthermore, between the clicks representation, Hyper direct pathways begin with cortico-subthalamic projections arising in MFC, which activation indicates the inhibition signal that can prevent the execution activate, this activation induced time dilation (50).
The T-corrected value decreased in response to both click train and constant stimuli over longer intervals. A linear relationship was observed between increasing interval timings and decreasing reproduced intervals. This result is consistent with Vierordt's Law (51), which states that relatively long durations reproduced shortened.
The coefficient of variation analysis indicated that participants reproduced interval timing more consistently during a click train than during a constant stimulus. Several studies have observed improved accuracy in the beat-based perception of time (52-54). Furthermore, this result is in line with Ren et al. study, which confirms that CV of timing performance is dependent on the temporal context modulation (55).
According to the CVs of different interval timings regardless of stimulus type, participants reproduced more variability in shorter intervals, and the rate of reproduction change was less accurate (5, 56), which is consistent with the scalar property of time (57) in a reproduction task, particularly in the absence of feedback (58). Our results show that participants' responses were more variable during short (1400 ms) durations. This could be interpreted as participants' reduced ability to detect reproduction-encoding discrepancies at shorter intervals. Longer intervals increase the importance of attention, whereas individuals become more aware of disparities in a controlled manner.
The relationship between CNV amplitude and timing was determined by analyzing electrophysiological data. Contingent negative variation is an index of cortical arousal, and fMRI studies have demonstrated an increase in blood oxygenation level-dependent level in the thalamus, SMA, and bilateral midcingulate during CNV generation (59); these regions are consistent with the role of the SMA in interval timing (60).
During the reproduction phase, which follows the click train or constant stimulus presentation in the encoding duration, CNV amplitude increased in the central region. The enhancement of CNV may be attributed to pre-reproduction preparations. This modulation reflects neural activation of the timing system and is associated with time dilation (61).
Even though the CNV amplitude was more negative during exposure to a click train than constant stimuli, click train presentation did not significantly alter CNVs during the encoding phase. We propose differentiating CNVs at the reproduction and encoding stages, which involve distinct cognitive processes. Encoding (as indicated by Fz CNVs) lacked motor preparation and increased cognitive activity in our task design. Based on these considerations, the increase in CNV during reproduction may be associated with mental and motor preparation, consistent with studies demonstrating that CNV reflects time-informed preparation for future events and actions (30). The main difference in CNV amplitude in the sensory-motor area (Cz) for reproduction supports the notion that motor areas contain specialized perceptual timing mechanisms. In the SBF model, the oscillator and detector neuron strengths are plastic and susceptible to change at the beginning of intervals. According to this functional perspective, the intrinsic vibration frequencies of oscillator neurons are entrained by external click trains (19). As depicted in Figure 7A, this increased EEG power at the frequency of the click trains that achieve the highest entrainment. Concerning the SBF, dopamine pulses strengthen synapses in striatal neurons activated by the beat-frequency stimulus pattern. Dopamine pulses and CNV are correlated in human dopaminergic system impairment studies (61, 62).
We also observed a relationship between the accuracy of reproduced durations and the CNV amplitudes. According to the evidence, larger CNV amplitudes are related to greater disinhibition in sensory-motor circuits. The efficacy of behavioral performance may be related to lower neural variability and trials with larger CNVs (63). Accordingly, it appears that the increased CNV amplitude was the result of optimizing attention and preparation for interval timing. In other words, our findings indicate that the CNV can also be interpreted as a sign of resource optimization. However, Kononowicz et al. (36) suggests that the CNV is solely not directly related to timing; therefore, we propose examining the other ERP components during interval timing to clarify the neural substrate of time perception.
Finally, according to the SBF model, it seems that striatal thalamocortical loops are in line with time dilation circuits during the presentation of a click train (23, 50, 59). Moreover, the studies suggest that the thalamocortical interaction is modulated by CNV amplitude (47), and CNV is under dopaminergic control, which is in line with SBF anatomical components (31). Therefore, the links between the SBF, CNV, and click train warrant further investigation.
5.1. Conclusions
This study examined click trains’ behavioral and electrophysiological effects on different supra-second interval timings in the time reproduction task. The results demonstrated that click trains induce time dilation and behavioral patterns, and CNV amplitudes differed between click trains and constant auditory stimuli. The CNV component was identified throughout encoding and reproduction.
The findings indicated the relationship between the neural mechanisms of the CNV, the reproduction of the interval timings, and the click train stimulus. This relationship is based on the SBF model. Future research focusing on functional imaging data and cellular levels may aid in our comprehension of the timing mechanisms underlying time reproduction paradigms.
