1. Background
Understanding and explaining past episodes of success and failure could help in developing and improving one’s ability as a sports performer, which is called causal attribution (1). Several theoretical approaches contend that attribution can be classified along with a number of dimensions. These include locus of causality (internality), stability, globality, intentionality, and controllability (1, 2). Controllability can be further defined along with separate dimensions, conceptualized as personally controllable-uncontrollable, and externally controllable-uncontrollable (3). Past research in sports has been limited to investigating at most three attributional dimensions at a time with Weiner’s dimensions of internality, stability, and controllability (4). However, a study made by Hanrahan et al. indicated that six dimensions (causality, stability, globality, internal controllability, external controllability, and intentionality) may be used to identify individual differences in attributional style for sport-related events (4). Sport attributional style scale (SASS), which measures six attributional dimensions in sports was made by Hanrahan et al. to determine a more validated and clearer attributional style in sports (4). It has been showed that internal consistency and reliability of this scale is significant and acceptable through two methods: Cronbach’s α and test-retest (4). Hanrahan et al. examined construct validity of sport attributional style subscales through factor analysis, which indicates six dimensions (causality, stability, globality, internal controllability, external controllability and intentionality) can be used to identify individual differences in attributional styles for sport-related events (4). Many studies have investigated attributions regarding specific sporting situations, however, none of them measured attributional style along all of the theoretical dimensions that study of Hanrahan et al. suggests could be important (4). Hence, psychometric characteristics of this scale has not been studied yet on Iranian athletes’ population. On the other hand, it is essential to investigate the psychometric characteristics of a tool before using it for research and clinical purposes. Therefore, the present study aimed to investigate the psychometric characteristics of sport attributional style scale in elite Iranian athletes’ population.
2. Objectives
To determine the psychometric characteristics of sport attributional style scale (SASS) with 16 items (long form) in elite Iranian athletes’ population.
3. Materials and Methods
3.1. Research Method
This is a descriptive-exploratory study. Two softwares (SPSS-16, AMOS-23) were used for statistical calculations.
3.2. Population, Sample and Sampling
Research population involved elite athletes (those who play in the highest rank of competitions in their sport fields), such as super league, top league, or first class league, like team sports with direct contact including basketball, football, handball, and also individual sports with direct contact like Wushu, Taekwondo, and Karate. The study population were 4,309, including 2,853 elite team athletes and 1,456 elite individual athletes, of whom 863 elite women. A total of 1,990 elite men were in team sports and 492 elite women and 964 elite men were in individual sports.
Sample size in confirmatory factor analysis method is determined based on at least 3 to 7 times the number of questions in the questionnaire (5) and since sport attributional styles of team athletes are different from those of individual ones (6), the sample was selected from both populations of team and individual athletes. In addition, a preliminary study revealed a standard deviation (SD) of 0.73 in team athletes and 0.64 in individual athletes for the features of sport attributional style at the confidence level of 95%. By assigning 0.1 point error a sample size of 192 elite team athletes and 144 elite individual athletes was calculated.
Considering the ratio of women and men in both team and individual sports of the study population, 134 males and 58 females for team athletes and 95 males and 49 females for individual athletes were randomly selected as the sample from different sport clubs in Tehran in the year of 2014.
3.3. Translation and Re-Translation
SASS was translated from English into Persian by the researcher and some distinguished scholars in sport psychology and physical education in 2014. Then, the quality of translation was evaluated in a pilot study on 50 team athletes and 50 individual athletes who were asked to fill out the questionnaires. The respondents stated their opinions regarding the clarity of statements and the researcher provided them with any explanations reciprocally. The outcomes were transferred to the scholars to modify the translation. After extra comparison of the original and translated backward versions, the scale was finally revised and accommodated to the Iranian culture [Supplementary File Appendix 1].
3.4. Materials
Sport attributional style scale (SASS), which measures six attributional dimensions in sports, was created by Hanrahan et al. to determine a more validated and clearer attributional style in sports (4). The original SASS (long form) includes 16 items, of which 8 are related to athletic successes and 8 are about athletic failures [Supplementary File Appendix 1]. All 16 items are included in 7 parts. The first part is related to reasons of athletic successes and failures. Parts 2 - 7 are about internal-external, stable-unstable, global-specific, internal controllable-uncontrollable, external controllable-uncontrollable, and intentional-unintentional dimensions of sport attributional styles, respectively. The items are scored based on a 7-point Likert scale (1 = never to 7 = completely sure). The scoring is in reverse order for athletic failures (7). Reliability of this scale with Test-Retest method was between 0.60 - 0.82 (average 0.73) (4). Construct validity of this scale was confirmed earlier by correlating scores on the dimensional sub-scales with measures of achievement motivation (the Willis scales of competitive motives, 1982), physical self-esteem (self-rating scale of Fleming and Courtney, 1984), and sport competition anxiety scale (1977) (4). According to Hanrahan et al. SASS has an acceptable reliability and validity in sport (4).
4. Results
The descriptive statistics of SASS factors are reported. Table 1 presents mean, standard deviation, minimum, and maximum values for SASS factors (after failure, after success) in team and individual sports.
| Factors in Team and Individual Sports | Mean (SD) | Minimum Value | Maximum Value |
|---|---|---|---|
| Internal-external | |||
| Team | |||
| After failure | 4.22 (0.73) | 1.25 | 5.50 |
| After success | 4.33 (0.76) | 1.40 | 5.40 |
| Individual | |||
| After failure | 4.33 (0.77) | 1.40 | 5.40 |
| After success | 4.22 (0.75) | 1.40 | 5.40 |
| Stable-unstable | |||
| Team | |||
| After failure | 4.03 (0.76) | 1.67 | 5.50 |
| After success | 4.03 (0.74) | 1.75 | 5.00 |
| Individual | |||
| After failure | 4.01 (0.75) | 1.75 | 5.00 |
| After success | 4.21 (0.80) | 1.40 | 5.00 |
| Internal controllable-uncontrollable | |||
| Team | |||
| After failure | 4.26 (0.76) | 1.40 | 5.50 |
| After success | 4.30 (0.76) | 1.40 | 5.00 |
| Individual | |||
| After failure | 4.32 (0.77 | 1.75 | 5.00 |
| After success | 4.03 (0.82) | 1.67 | 5.67 |
| External controllable-uncontrollable | |||
| Team | |||
| After failure | 3.92 (0.69) | 1.83 | 5.50 |
| After success | 3.91 (0.76) | 1.00 | 5.00 |
| Individual | |||
| After failure | 3.94 (0.71) | 2.00 | 5.00 |
| After success | 3.93 (0.74) | 1.83 | 5.17 |
| Global-specific | |||
| Team | |||
| After failure | 4.18 (0.87) | 1.00 | 5.67 |
| After success | 4.35 (0.94) | 1.00 | 5.67 |
| Individual | |||
| After failure | 4.34 (0.90) | 1.00 | 5.67 |
| After success | 4.22 (0.96) | 1.00 | 5.67 |
| Intentional-unintentional | |||
| Team | |||
| After failure | 4.34 (0.66) | 1.50 | 5.50 |
| After success | 4.29 (0.64) | 1.50 | 5.00 |
| Individual | |||
| After failure | 4.41 (0.63) | 1.67 | 5.33 |
| After success | 4.31 (0.68) | 1.50 | 5.00 |
Descriptive Indicators of SASS Factors (after Failure, after Success) in Team and Individual Sports
According to Table 1, in team sports, after failure, the mean value of intentional-unintentional factor was higher than the other factors. After success, the mean value of global-specific factors was higher than other factors. After failure, the standard deviation for all components of SASS was equal or less than 0.8 and after success, for all components of SASS, it was equal or less than 0.9. Moreover, in individual sports, the mean value of intentional-unintentional factor (after failure, after success) was higher than the other factors and the standard deviation (after failure, after success) for all components of SASS was equal or less than 0.9.
4.1. Reliability
In present research, coefficients of Cronbach’s alpha of SASS in team and individual sports was 0.95 and 0.98, respectively, indicating appropriate internal consistency of the scale.
4.2. Construct Validity
In order to examine the construct validity of SASS, confirmatory factor analysis by AMOS (version 23) was used in individual and team sports after failure and after success. In the present study, χ2/df, CFI, TLI, SRMR, and RMSEA indices were used to evaluate the goodness-of-fit of the SASS models (factor analysis models) in individual and team sports after failure and after success. Some sources suggest that χ2/df should be less than 3 to adopt the model (8). The CFI higher than 0.9 and RMSEA and SRMR smaller than 0.05 indicate a very good fitness, and smaller than 0.08 imply good and proper fitness of the model (9). In terms of TLI index, a value equal to or higher than 0.9 indicates that the model is appropriate (10). After performing the first-order factor analysis of SASS, factor loadings of some items of SASS components were not significant at the P < 0.05 level and the values of goodness-of fit indices didn’t indicate good and proper fitness of the models. After removing non-significant items, the modified models well fit the data. In the modified model of SASS in team sports after failure, of the 8 items per factor of the primary model, 4 items were removed from internal-external factor, 5 items were removed from stable-unstable factor, 3 items were removed from internal controllable-uncontrollable factor, 2 items were removed from external controllable-uncontrollable factor, 5 items were removed from global-specific factor, and 4 items were removed from intentional-unintentional factor. The goodness-of- the fitness indicators of these models (primary and modified) are presented in Table 2.
| Goodness-of-Fitness Indicators | Primary Model | Modified Model |
|---|---|---|
| χ2/(df) | 2942.166 (1065) | 435.524 (260) |
| CFI | 0.554 | 0.921 |
| TLI | 0.527 | 0.909 |
| SRMR | 0.1369 | 0.060 |
| RMSEA | 0.096 | 0.059 |
Goodness-of-Fitness Indicators of the Models in Team Sports after Failure
In the modified model of SASS, in team sports after success, of the 8 items per factor of the primary model, items were excluded the same as negative events, apart from the internal-external factor, of which 3 items were removed, and stable-unstable factor, of which 4 items were removed. The goodness of the fitness indicators of these models (primary and modified) are presented in Table 3.
| Goodness-of-Fitness Indicators | Primary Model | Modified Model |
|---|---|---|
| χ2/(df) | 2975.913 (1065) | 185.187 (86) |
| CFI | 0.604 | 0.924 |
| TLI | 0.580 | 0.913 |
| SRMR | 0.1487 | 0.054 |
| RMSEA | 0.097 | 0.063 |
Goodness-of-Fitness Indicators of the Models in Team Sports after Success
In modified model of SASS in individual sports after failure, of the 8 items per factor of the primary model, 3 items were removed from internal-external factor, 4 items were removed from stable-unstable factor, 4 items were removed from internal controllable-uncontrollable factor, 2 items were removed from external controllable-uncontrollable factor, 5 items were removed from global-specific factor, and 5 items were removed from intentional-unintentional factor. The goodness-of- the fitness indicators of these models (primary and modified) are presented in Table 4.
| Goodness-of-Fitness Indicators | Primary Model | Modified Model |
|---|---|---|
| χ2/(df) | 2572.648 (1065) | 449.208 (260) |
| CFI | 0.595 | 0.914 |
| TLI | 0.572 | 0.901 |
| SRMR | 0.147 | 0.056 |
| RMSEA | 0.099 | 0.071 |
Goodness-of-Fitness Indicators of the Models in Individual Sports after Failure
In modified model of SASS in individual sports after success, of the 8 items per factor of the primary model, items were excluded the same as after failure, apart from the stable-unstable factor, of which 3 items were removed, external controllable-uncontrollable factor, of which 5 items were removed, and intentional-unintentional factor, of which 4 items were removed. The goodness of the fitness indicators of these models (primary and modified) are presented in Table 5.
| Goodness-of-Fitness Indicators | Primary Model | Modified Model |
|---|---|---|
| χ2/(df) | 2467.108 (1065) | 450.756 (284) |
| CFI | 0.589 | 0.918 |
| TLI | 0.565 | 0.906 |
| SRMR | 0.151 | 0.062 |
| RMSEA | 0.096 | 0.064 |
Goodness-of-Fitness Indicators of the Models in Individual Sports after Success
After removing non-significant items, we assessed the reliability and validity indices of SASS in team and individual sports (after failure, after success), which are presented in Table 6.
| Factors in Team and Individual Sports | α | CR | AVE | Stable-Unstable | External Controllable-Uncontrollable | Internal-External | Global-Specific | Intentional-Unintentional | Internal Controllable-Uncontrollable |
|---|---|---|---|---|---|---|---|---|---|
| Stable-unstable | |||||||||
| Team | |||||||||
| After failure | 0.749 | 0.750 | 0.500 | 0.707 | |||||
| After success | 0.802 | 0.805 | 0.510 | 0.714 | |||||
| Individual | |||||||||
| After failure | 0.750 | 0.811 | 0.519 | 0.721 | |||||
| After success | 0.872 | 0.876 | 0.589 | 0.767 | |||||
| External controllable-uncontrollable | |||||||||
| Team | |||||||||
| After failure | 0.872 | 0.874 | 0.538 | 0.128 | 0.734 | ||||
| After success | 0.900 | 0.901 | 0.603 | 0.104 | 0.777 | ||||
| Individual | |||||||||
| After failure | 0.888 | 0.890 | 0.577 | 0.213 | 0.760 | ||||
| After success | 0.895 | 0.897 | 0.593 | 0.113 | 0.770 | ||||
| Internal-external | |||||||||
| Team | |||||||||
| After failure | 0.825 | 0.836 | 0.565 | 0.599 | 0.115 | 0.752 | |||
| After success | 0.897 | 0.899 | 0.642 | 0.608 | 0.151 | 0.801 | |||
| Individual | |||||||||
| After failure | 0.894 | 0.892 | 0.735 | 0.647 | 0.113 | 0.857 | |||
| After success | 0.849 | 0.855 | 0.547 | 0.678 | 0.105 | 0.740 | |||
| Global-Specific | |||||||||
| Team | |||||||||
| After failure | 0.796 | 0.803 | 0.578 | 0.435 | 0.059 | 0.615 | 0.760 | ||
| After success | 0.902 | 0.903 | 0.756 | 0.440 | 0.103 | 0.677 | 0.869 | ||
| Individual | |||||||||
| After failure | 0.903 | 0.903 | 0.653 | 0.661 | 0.202 | 0.714 | 0.808 | ||
| After success | 0.873 | 0.875 | 0.699 | 0.508 | 0.031 | 0.678 | 0.836 | ||
| Intentional-unintentional | |||||||||
| Team | |||||||||
| After failure | 0.841 | 0.852 | 0.592 | 0.220 | 0.077 | 0.050 | 0.077 | 0.769 | |
| After success | 0.824 | 0.841 | 0.572 | 0.107 | 0.286 | 0.119 | 0.108 | 0.756 | |
| Individual | |||||||||
| After failure | 0.853 | 0.856 | 0.664 | 0.126 | 0.280 | 0.021 | 0.084 | 0.815 | |
| After success | 0.824 | 0.842 | 0.572 | 0.037 | 0.098 | 0.003 | 0.071 | 0.756 | |
| Internal controllable-uncontrollable | |||||||||
| Team | |||||||||
| After failure | 0.857 | 0.862 | 0.561 | 0.680 | 0.101 | 0.579 | 0.490 | 0.115 | 0.749 |
| After success | 0.875 | 0.878 | 0.592 | 0.579 | 0.072 | 0.705 | 0.519 | 0.023 | 0.769 |
| Individual | |||||||||
| After failure | 0.867 | 0.871 | 0.627 | 0.592 | 0.243 | 0.712 | 0.765 | 0.083 | 0.792 |
| After success | 0.776 | 0.777 | 0.538 | 0.669 | 0.182 | 0.719 | 0.494 | 0.133 | 0.734 |
Validity and Reliability Indices (after Failure, after Success) in Team and Individual Sports
According to Table 6, in the first-order factor analysis in team sports (after failure, after success) and also in individual sports (after failure, after success), all Cronbach’s alpha coefficients were higher than 0.7. In addition, the construct reliability was higher than 0.7, the AVE was higher than 0.5, and the square root of AVE for each construct was higher than the correlation between other constructs (values in bold on the main diameter are the square root of AVE). Therefore, convergent validity, divergent validity, and construct reliability of SASS were approved.
Moreover, in order to achieve a more accurate factor construct, second-order factor analysis method was performed. After performing the second-order factor analysis of SASS, factor loadings of some components of SASS were not significant at the P < 0.05 level. After removing non-significant components, the models well fit the data.
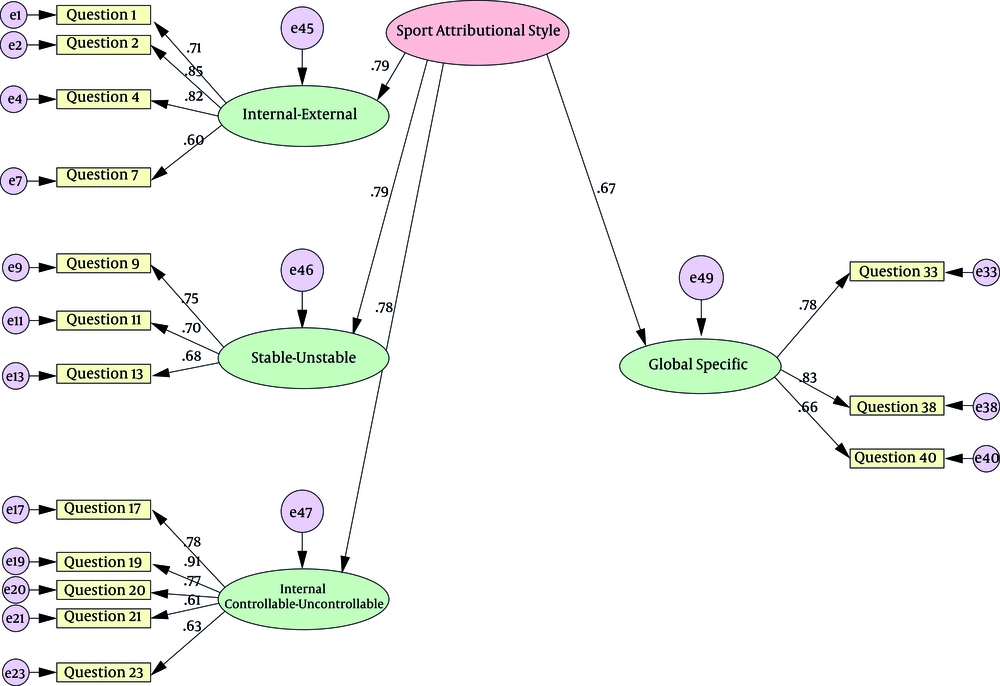
In second-order factor analysis of SASS in team sports after failure, external controllable-uncontrollable factor, and intentional-unintentional factor of SASS were not significant and were excluded from the model. The results of this analysis are presented in Figure 1.
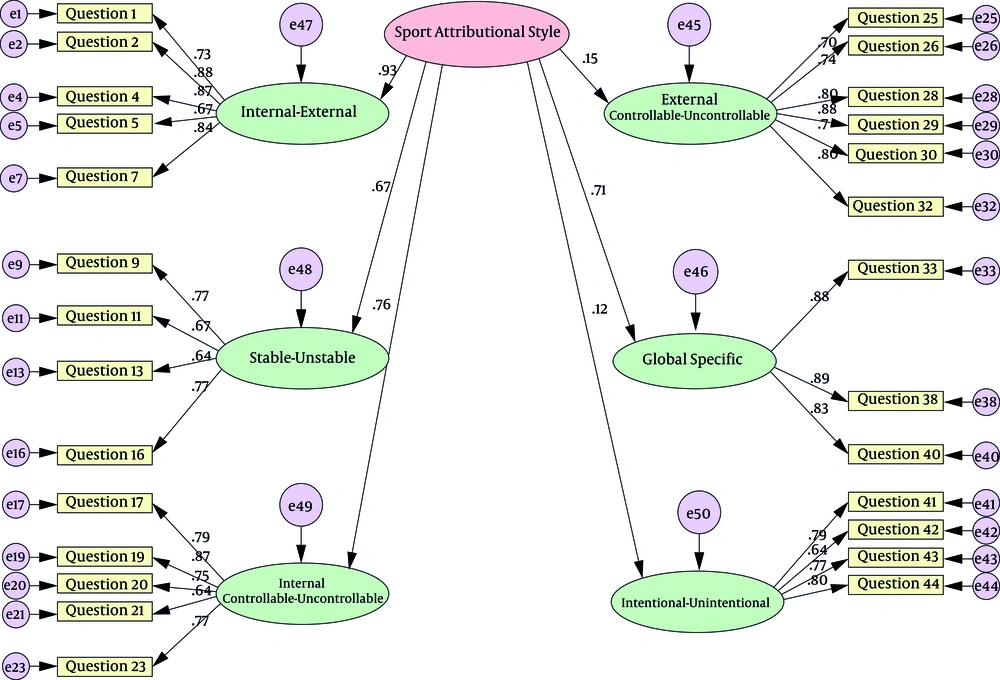
In the second-order factor analysis of SASS in team sports after success, all SASS factors were confirmed. The results of this analysis are presented in Figure 2.
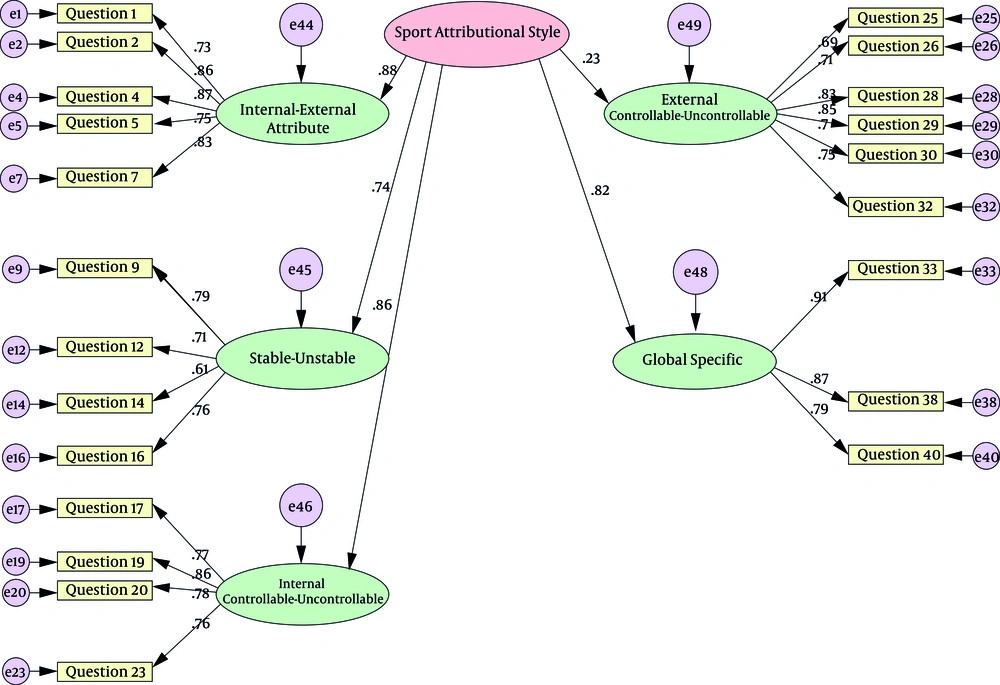
In the second-order factor analysis of SASS in individual sports after failure, intentional-unintentional factor of SASS was not significant and therefore, was excluded from the model. The results of this analysis are presented in Figure 3.
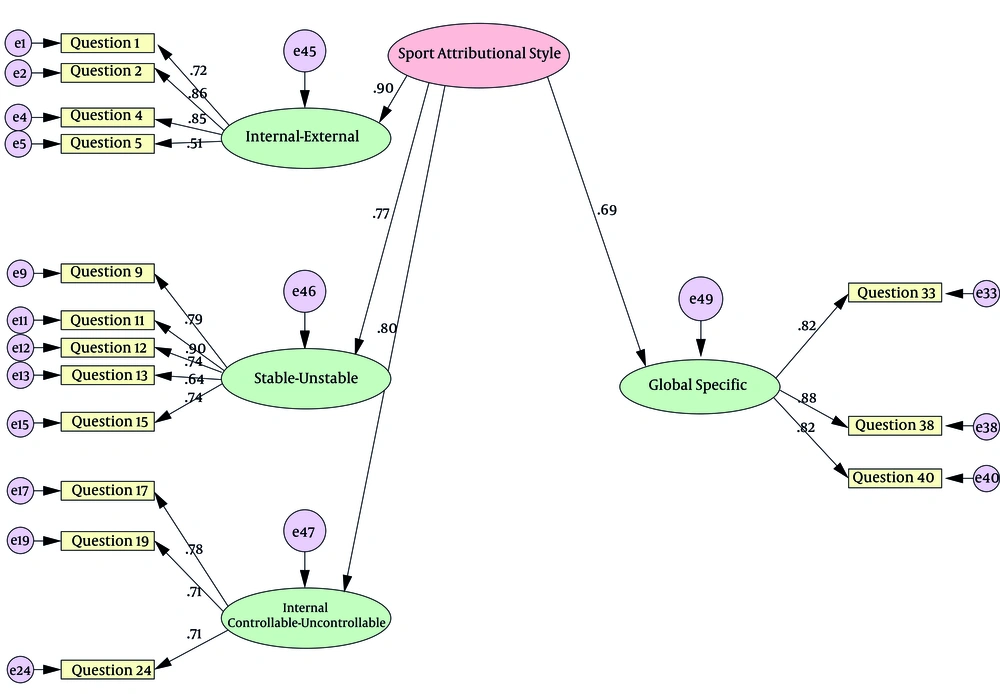
In the second-order factor analysis of SASS in individual sports after success, external controllable-uncontrollable factor and intentional-unintentional factor of SASS were not obtained as significant and were excluded from the model. The results of this analysis are presented in Figure 4.
5. Discussion
Sport attributional styles have an important role in developing and improving athletes᾿ abilities (1). To the best of our knowledge, SASS, which was developed by Hanrahan et al. (4) has not been validated on elite Iranian athletes’ population. Therefore, the present study aimed to investigate psychometric characteristics of SASS in elite Iranian athletes’ population. Evaluation of internal consistency of SASS showed that this scale has a good reliability, which is similar to the findings of Hanrahan et al. (4). Construct validity of SASS showed that some items of SASS components and some factors of this scale were not approved. In team sports after failure and in individual sports after success, external controllability and intentionality factors of SASS were not approved. In individual sports after failure, intentionality factor was not approved. Current findings are in harmony with a number of studies that questioned the reliability and validity of controllability subscale (11). Furthermore, it has been argued that the intentionality dimension is confounded with internality dimension (locus of causality dimension) or controllability dimension (7). Only in team sports, after success, all six factors were approved. These six factors are similar to the factors approved in Hanrahan et al. (4). However, in this study, only one method was used to assess the validity of SASS, therefore, further studies are suggested to investigate the validity of SASS using different methods. In addition, since the scale of SASS was validated in athletes with direct contact, it limits the capability of generalization of the results to athletes with indirect contact. Therefore, applying various statistical methods in different sports is recommend to verify the validity and reliability of sport attributional style scale.
5.1. Conclusions
The present study showed that SASS has suitable reliability and overall, four factors and some items in this scale were detected to have acceptable validity in elite Iranian athletes’ population.


