


1. Background
Menopause is a physiological alteration that is experienced by all women in the process of aging (1). The World Health Organization (WHO) has estimated that the number of postmenopausal women around the world will reach 1.2 billion by 2030, and a total of 47 million women enter the stage of menopause each year (2). According to the report of 2011 census in Iran, the population of women aged 45 - 60 was estimated to be 5.8 million, about 7% of the population (3). With the advances in medical sciences, women live longer than before (4, 5); therefore, the effect of menopause on women's health gain more importance (1).
Some symptoms of estrogen deficiency in this period include disruption in the menstrual pattern, vasomotor instability, genital atrophy, rapid and irregular heartbeat, mood changes, sleep disorders, headache, muscular pain, joint pain, as well as concentration and memory problems (6). About 80% of women experience the unpleasant symptoms of menopause every year (7). The symptoms and complications of menopause affect women's psychological, physical, and emotional health, in addition to social function and family relationships. The combination of these effects is defined as the quality of life (8). The WHO defines the quality of life as people's perception of the conditions in which they live in terms of culture, value system, goals, expectations, standards, and priorities (9). According to the results of previous studies, menopause adversely affects women's quality of life in every dimension (9-11).
There is a wide range of medical methods that control the symptoms of menopause (12-15). Due to the side-effects of hormone-therapy and other medical therapies, women have paid more attention to the use of complementary and alternative medicine (16). Behavioral interventions are one of the therapeutic options of complementary medicine, which includes yoga, cognitive-behavioral therapy, mindfulness, etc. (17).
Mindfulness is defined as a non-judgmental sense of awareness that helps with the clarity of vision and the acceptance of emotions and physical phenomena as they occur. The use of mindfulness-based exercises and techniques makes the individual aware of his/her daily activities and releases him of automatically focusing on the past and future (18). A large number of mindfulness-based interventions and therapies have been developed in the past two decades, including mindfulness-based cognitive therapy (MBCT) (19).
The MBCT can counter experiential avoidance strategies, which alter the frequency or intensity of unwanted internal experiences. It is believed that these maladaptive strategies contribute to the maintenance of many emotional disorders. In addition, the deep breathing in mindfulness meditation may reduce body symptoms of distress by balancing sympathetic and parasympathetic responses that this can help women to control menopausal symptoms (20). The review of previous studies showed the effectiveness of mindfulness training in improving the quality of life and menopausal symptoms (16, 21-23), quality of sleep (24) depression and anxiety (25); however, the number of studies in this area is limited.
Given the relationship between body and mind and the fact that physical changes such as menopausal symptoms can lead to psychological symptoms that worsen or initiate several disorders such as depression, anxiety, and stress, whose consequences can adversely affect health and the response to physical treatments (22). The MBCT can be used to reduce the complications and psychological symptoms of menopause to improve the quality of life in perimenopausal women. So far, limited studies have been done on the effect of mindfulness on the quality of life in Iranian women (22).
2. Objectives
The present study was conducted to determine the effectiveness of MBCT on the quality of life in perimenopausal women in Yazd.
3. Materials and Methods
3.1. Participants
The present randomized controlled trial was conducted on 83 perimenopausal women from August 2017 to February 2018 in four health centers in Yazd city, consisting of mostly middle-aged women. Following a phone interview to establish eligibility, 744 women get assessed and 83 eligible women were invited to health centers to complete Cooperman's index and get familiarized with the general details and objectives of the study. After fulfilling the Cooperman's index by invited women, the women with scoring 15 and higher in this scale were further assessed in terms of the other inclusion criteria and then all of them fulfilled the informed consent form; additionally, demographic and the menopause-specific quality of life (MENQOL) questionnaires. Inclusion criteria were women aged between 45 and 55 years whose menstruation has become irregular over the past year or a maximum of two years since their last menstruation, primary school and higher education, ability to take part in group therapy sessions and willingness to participate in the study and a minimum score of 15 on the Cooperman's index. Exclusion criteria were a history of hysterectomy, oophorectomy, breast cancer, hormone-therapy or use of selective serotonin reuptake inhibitors or selective estrogen receptor modulators, use of psychiatric medications or visits to behavioral professionals over the last six months, history of neuropsychological diseases, drug abuse, and the experience of significant stress in the last six months (such as death of spouse and divorce). In the first section, we asked women to say the initiation or change the dosage of any drug or sedative method that they used during the study such as the herbal drug, and were asked to maintain their present dosage. Falling criteria included: absence more than three sessions from the group therapy process, unwillingness to continue participation in the sessions or the experience of significant stress, and unexpected events at any stage of the study.
3.2. Sampling
According to the following formula and taking into account 95% confidence interval, test power of 80%, and according to the study conducted by Carmody et al. (16) the sample size was calculated as 36 per group, which was increased to 40 to take account of potential withdrawals of 10%. Women were divided into intervention (n = 42) and control groups (n = 41) by using the simple random sampling method by the random number table.


3.3. Intervention Program
The intervention group attended eight two-hour sessions of mindfulness program, held weekly by the second researcher, free of charge, in four groups of 8 - 12 each, over eight successive weeks according to Segal MBCT protocol (Table 1) in health centers (17). Due to the accessibility of all the participants to the health centers, classes were held here and the classroom was located in a room in the center, which was special for the meeting and there was no noise and no ply here. The researcher had passed an MBCT training course and had full mastery over its topics, and the sessions were held under the direct supervision of the individual who was a PhD in clinical psychology (third author).
Table 1.The Protocol of MBCT
| Number of Meetings | Content of Meetings |
|---|---|
| First session | Members become familiar with each other, the MBCT and its benefits were introduced. Eating, giving feedback, and discussing it; focus on short breathing, including 2 to 3 minutes of breathing. |
| Second session | Body scan, pleasant events recording, sitting meditation for 10 to 15 minutes. |
| Third session | Seeing or hearing practice for 5 minutes, practicing 3-minute breathing space, unpleasant events recording, sitting meditation for 15 to 30 minutes. |
| Fourth session | Sitting meditation to 30 - 40 minutes on breathing, body, voice, and thoughts. |
| Fifth session | Attention to reactions to thoughts, feelings, or feelings of the body in 40 minutes meditation, the expression of the difficulties that occur during the exercise, and 3-minute breathing space for coping with the problem. |
| Sixth session | Sitting meditation to 40 minutes on breathing, body, voice, and thoughts; walking with mindfulness. |
| Seventh session | Overview of the entire program, discuss how to continue the discipline that has been created in regular or unstructured exercises during the last 7 weeks. |
| Eighth session | Meditation in nature and review the practices. |
At the end of each session, brief notes covering the content of that session and homework for the next session were given to the participants. The participants had to spend one hour per day on their homework. The homework was the exercise that was taught in class and included: eating practice, sitting meditation, body scan, etc. The second researcher contacted the participants every week as an attendance reminder and also to solve their homework problems. The control group received no interventions and was separately invited to the health centers to complete the questionnaires. MENQOL was completed by both groups separately at the end of the intervention (week 8) and one month later (week 12). Out of 83 women, six individuals were fallen from the intervention group (5 for absence in meetings and 1 for illness) and four from the control group (failure to cooperate in completing the questionnaire) and the study was completed with n = 36 in the intervention group and n = 37 in the control group. Figure 1 represents the participants' consort diagram. All questionnaires were fulfilled under the supervision of the second author, thus we did not have any missing data. To comply with the ethics of conducting research, the control group also attended a free condensed MBCT course held in four sessions at the end of the study.
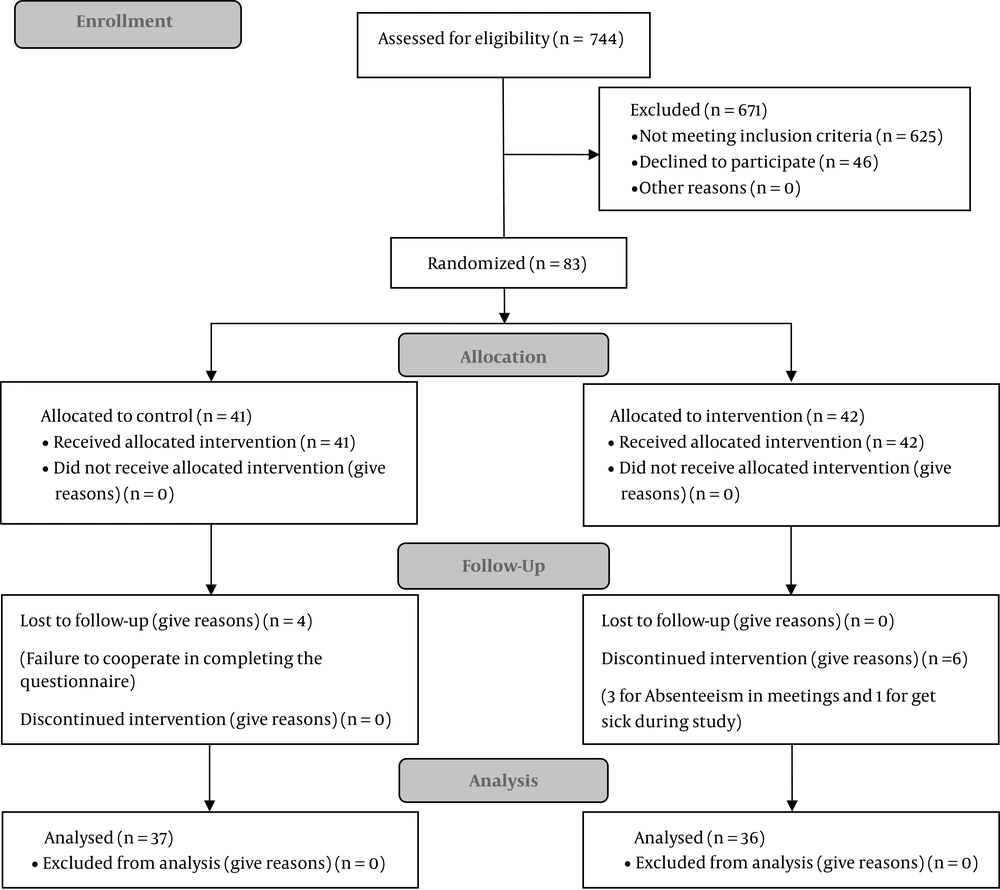
Figure 1.
Consort diagram of study
3.4. Data Collection Instruments
Data of research were collected using three questionnaires.
3.4.1. A Demographic Questionnaire
The demographic questionnaire was filled out with items on age, weight and height, education, occupation, marital status, and spouse's education and age, which was completed by the participants in the first meeting.
3.4.2. Cooperman's Index
That was used to determine menopausal symptoms for inclusion in the study. This index is a combination of three factors (psychological, vasomotor, and other symptoms) and examines 11 menopausal symptoms, each of them is scored as zero (no symptoms), one (mild), two (moderate) and three (severe), with the highest score of 51. The scores were categorized as 1 - 14 indicating minimal symptoms, 15 - 20 mild, 21 - 35 moderate, and over 35 severe symptoms. A minimum score of 15 was required for inclusion in this study because according to the classification, women with a high score of 15 are experiencing mild to severe menopausal symptoms. This scale has been used in many studies for measuring menopausal symptoms and its validity and reliability have thus been confirmed (26-28).
3.4.3. The Menopause-Specific Quality of Life (MENQOL) Questionnaire
That was used to assess participants' quality of life. This questionnaire was designed by Hilditch et al. (29) at the University of Toronto in Canada and contains 29 items on menopausal symptoms and complications in four dimensions, including vasomotor, psychosocial, physical, and sexual, and the total score is obtained based on a Likert scale from 1 to 6. Lower scores indicate a better quality of life, and vice versa (30). The reliability of the Persian version of this scale has been confirmed in previous studies conducted on the quality of life in Iranian women with a Cronbach's alpha of 0.8 (9).
3.5. Statistical Analysis
Data were analyzed with SPSS-16 (SPSS Inc, Chicago, IL). Independent t test was used to analyze the quantitative data and chi-squared test was used to analyze the qualitative data. For intragroup analysis, since the study was designed based on three intervals (before the intervention, immediately, and one month after the intervention), the test of repeated measure analysis of variance (ANOVA) was used. P-value < 0.05 was considered the level of significance.
4. Results
The present study was conducted on 83 perimenopausal women in Yazd. The mean age of the women was 50.89 ± 2.527 years in the intervention group and 49.67 ± 2.733 years in the control group. The majority of them was in the perimenopausal period and had primary education level. No significant differences were observed between the two groups in terms of demographic details (P > 0.05) (Table 2). Of the 36 final participants in the intervention group, 21% participated in all sessions, 38% in 7 sessions, and 41% in 6 sessions of the MBCT program. It was acceptable to do 80% of homework assignments; all participants had 80% or more of homework assignments.
Table 2.Socio-Demographic Characteristics of the Studied Participants (N = 73)a
| Variables | Intervention Group (n = 36) | Control Group (n = 37) | Total | P Value |
|---|---|---|---|---|
| Age, y | 50.89 ± 2.52 | 49.67 ± 2.73 | 50.32 ± 2.67 | 0.07b |
| Husband's age, y | 53.42 ± 3.21 | 52.35 ± 2.97 | 52.88 ± 3.12 | 0.14b |
| Duration of menopause, mo | 14.43 ± 6.09 | 15.50 ± 6.28 | 14.96 ± 6.10 | 0.65b |
| Body mass index, kg/m2 | 29.46 ± 4.23 | 28.85 ± 4.17 | 29.15 ± 4.18 | 0.53b |
| Menopause | 0.92c | |||
| Yes | 14 (39) | 14 (38) | 28 (38) | |
| No | 22 (61) | 23 (62) | 45 (62) | |
| Job | 0.30c | |||
| Employee | 3 (8) | 6 (16) | 9 (12) | |
| Housewife | 33 (92) | 31 (84) | 64 (88) | |
| Education | 0.75c | |||
| Under the diploma and diploma | 32 (89) | 34 (92) | 66 (90) | |
| Academic | 4 (11) | 3 (8) | 7 (10) | |
| Husband's education | 0.19c | |||
| Under the diploma and diploma | 24 (67) | 23 (62) | 47 (64) | |
| Academic | 12 (33) | 14 (38) | 26 (36) |
a Values are expressed as mean ± SD or No. (%).
b Independent-samples t test.
c Chi square test.
The normal distribution of the data was confirmed using the one-sample Kolmogorov-Smirnov test, and the data were found to have a normal distribution (P > 0.05).
Based on the independent t-test, although the two groups were not significantly different at first in terms of the quality of life and its dimensions, the intervention group had significantly lower scores in the quality of life and its dimensions (except for the sexual dimension) after the intervention and in the follow-up compared with the control group (P < 0.05) (Table 3).
Table 3.Comparison of the Mean and Standard Deviation of the Quality of Life in Each MENQOL Domain in the Two Groupsa
| Quality of Life/Time | Intervention Group | Control Group | P Valueb |
|---|---|---|---|
| Vasomotor domain (0 - 6) | |||
| Pre-test | 2.78 ± 1.43 | 2.46 ± 1.46 | 0.338 |
| Post-test | 1.20 ± 0.91 | 1.96 ± 1.34 | 0.006 |
| Follow-up | 1.48 ± 1.08 | 2.05 ± 1.31 | 0.047 |
| P valuec | < 0.001 | 0.030 | |
| Psychological domain (0 - 6) | |||
| Pre-test | 2.55 ± 1.45 | 2.02 ± 1.15 | 0.086 |
| Post-test | 1.06 ± 0.78 | 2.26 ± 0.96 | 0.000 |
| Follow-up | 1.28 ± 0.84 | 2.32 ± 0.92 | 0.000 |
| P valuec | < 0.001 | 0.019 | |
| Physical domain (0 - 6) | |||
| Pre-test | 2.50 ± 1.14 | 2.22 ± 1.03 | 0.283 |
| Post-test | 1.64 ± 0.81 | 2.09 ± 0.82 | 0.020 |
| Follow-up | 1.62 ± 0.82 | 2.10 ± 0.80 | 0.015 |
| P valuec | < 0.001 | 0.253 | |
| Sexual domain (0 - 6) | |||
| Pre-test | 2.78 ± 1.91 | 2.10 ± 1.48 | 0.095 |
| Post-test | 2.02 ± 1.48 | 1.94 ± 1.19 | 0.794 |
| Follow-up | 2.02 ± 1.35 | 2.08 ± 1.12 | 0.855 |
| P valuec | < 0.001 | 0.902 | |
| Overall MENQOL (0 - 6) | |||
| Pre-test | 2.57 ± 1.10 | 2.19 ± 0.85 | 0.102 |
| Post-test | 1.46 ± 0.72 | 2.11 ± 0.70 | 0.000 |
| Follow-up | 1.57 ± 0.75 | 2.14 ± 0.68 | 0.001 |
| P valuec | < 0.001 | 0.636 |
a Values are expressed as mean ± SD.
b Independent t test.
c Test of within-subjects contrasts of repeated measures.
In the intervention group, the greatest change in the mean scores was observed in the vasomotor dimension and the smallest change was observed in the sexual dimension. In the control group, the mean scores of the psychological dimension were increased compared with before the intervention and the mean scores decreased in the remaining dimensions, and this reduction was comparable to that in the intervention group. According to test of within-subject contrasts of repeated measures ANOVA, the difference between the scores of three intervals (before the intervention, immediately, and one month after the intervention) related to the overall quality of life and all its dimensions in intervention group was significant but in the control group the difference was significant in vasomotor and psychological domains (P > 0.05) (Table 3). Figure 2 shows the mean scores changes in the overall quality of life in the intervention and control groups in three stages of the study.
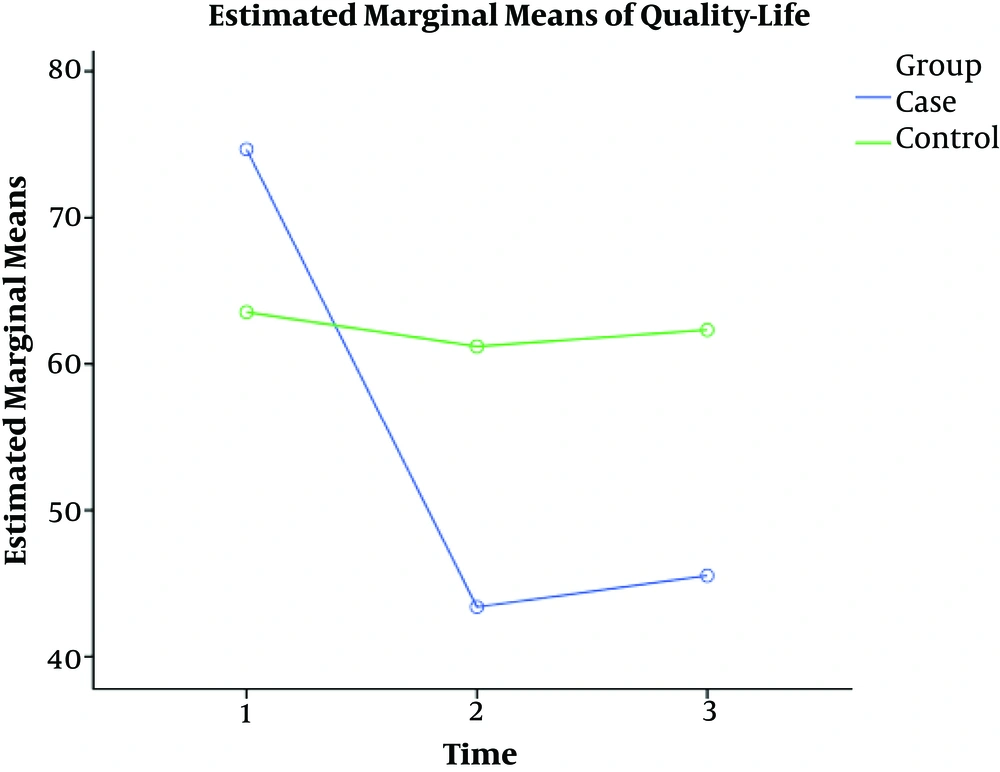
Figure 2.
Comparison of the mean score changes of overall quality of life in two groups in three stages of the study
5. Discussion
The purpose of the present study was to explore and compare the effects of MBCT on the quality of life in perimenopausal women.
The comparison of the means of scores of the quality of life in two groups at different stages of the study showed the effectiveness of the MBCT in significantly improving the quality of life in the intervention group.
In the present study, the mean scores of the quality of life and its dimensions (except for the sexual dimension) after the intervention and in the follow-up were significantly less in the intervention group than in the control group but the improvement of the quality of life and all its dimensions scores was significant in three intervals of the study in the intervention group. The findings of the present study are in agreement with other studies about the effectiveness of mindfulness program. In Carmody et al. study (21), mindfulness-based stress reduction (MBSR) significantly improved the quality of life and its dimensions in the perimenopausal women, and this improvement lasted for up to three months after the intervention and in Habibi and Hanasabzadeh study (22), which mindfulness-based art therapy improved the quality of life in postmenopausal women. Consistent with the Wong et al. study (23), the MBSR significantly reduced the psychological symptoms of depression and anxiety in perimenopausal and post-menopausal women but no significant improvement was observed in other somatic, urogenital, and vasomotor symptoms. In Brotto and Basson study (31), Mindfulness-based group therapy significantly improved sexual desire and other indices of sexual response through the 6-month follow-up period. In our study, although the sexual domain scores were decreased, the difference was not significant. It can be said that in the study of Brotto and Basson, the effect of mindfulness on the improvement of sexual tendencies of women has been studied. These tendencies are influenced by the psychological and psychological factors in individuals but in our study, genital atrophy was studied in women, which is dependent on physical changes.
The number of studies about the effect of mindfulness on the quality of life in perimenopausal women is limited, but in contrast to other therapeutic and non-pharmacological treatments with mindfulness, hormone therapy in addition to having side effects such as the risk of heart disease, cancer, etc. did not have a significant effect on the quality of life in postmenopausal women, while this effect was significant in our study (32). Previous studies of behavioral therapies (33-35), acupuncture (36), exercise (37), etc. reported positive outcomes in improving the quality of life that these studies have been limited by the small number of participants and thus need further studies.
In the present study, the highest change in the intervention group was observed in the mean score of the vasomotor dimension and the lowest in the sexual dimension.
According to the findings, MBCT reduced vasomotor symptoms, and the evidence suggests that anxiety and psychological distress increase vasomotor symptoms. The use of MBCT appears to reduce vasomotor symptoms by reducing anxiety and psychological distress (22). In the sexual dimension, the reduced estrogen level affects the genitalia and causes vaginal dryness, muscle atrophy, etc. (38), and is the biggest reason for the reduced quality of sex life, and apparently, MBCT did not have the same effect in this dimension as in the vasomotor dimension.
In the present study, the lack of a significant increase in the mean scores of the quality of life in all the dimensions in the one-month follow-up period indicates the last effect of the intervention until this period.
The significant difference in the mean score of vasomotor and psychological symptoms observed in all the stages in the control group could be due to the increasing changes caused by menopause.
Since previous studies on the effect of mindfulness on the quality of life have used different approaches and tools (39-42), further studies are needed to explore more reliable evidence. This study was conducted among perimenopausal Iranian women, because in this age group due to physical and psychological changes that occur due to menopausal symptoms, the incidence of stress and depression increases compared to other age groups, which leads to a decrease in the quality of life (31).
5.1. Conclusions
Given the positive effect of MBCT on the quality of life in perimenopausal women, this supportive method can be used to increase satisfaction in life and reduce psychological and physical complications in perimenopausal women. The results of this study can be helpful for especially women who are contraindicated in hormone therapy or who do not want to take drugs; however, it requires more studies with more sample sizes.
5.2. Limitations and Suggestions
The main limitation of the study was we did not have an active control program, since this study is a randomized controlled trial and semi-experimental; therefore, active control has not been performed over the intervention group. Furthermore, apart from the effects of the intervention, other issues have also been effective on women's quality of life. Lack of educational tools such as instructional CDs for the participants to practice at home is another limitation, but this limitation was overcome by giving the participants educational booklets and homework assignment in every session. The strong point and novelty of the study was that it was the first study on the effects of the MBCT program on the quality of life in perimenopausal women in Iran and also the menopause-specific quality of life questionnaire was used, which assessed the effect of mindfulness on all the dimensions of the quality of life in perimenopausal women. Indeed, it was one of the strengths of this research.


