


1. Background
Marital intimacy is one of the most valuable existential aspects of the human being and marital relationship. It is the main reason for marriage (1-3). Intimacy is defined as the closeness, similarity and romantic or emotional personal relationship, which requires a deep understanding and perception of the other person for expressing thoughts and feelings (4). Marital intimacy in the couple’s relationship leads to the enhancement of marital compatibility (5), marital satisfaction (6, 7), increase of the quality of marital life (8), feeling of welfare (9), and a decrease of daily stress (10). On the other hand, the lack of intimacy in young couples is one of the predictors of divorce in old age (11).
cultural tendencies toward the exchange of love and affection, domestic violence and experiencing it in childhood, gender differences, attachment styles, having the communication skill, and conflict resolution styles influence the marital intimacy (12-20). The communication skill is a skill by which people can be involved in the communication process to exchange information, thoughts, and feelings through verbal and nonverbal messages (20). Conflict resolution skill involves the reduction and elimination of all forms and types of conflict. Rahim (1997) has suggested a model that offers the five styles of conflict management that include collaboration, competitive, avoidance, adaptability, and compromise (18). Marital intimacy and its relevant factors are various in different cultures (13, 14). For instance, a study in Iran showed there was no statistically significant difference in the level of intimacy between women and men. However, a study in South Africa showed that the level of experienced intimacy in sexual and social domains was higher in women than in men (6, 21). In a study in Iran, a statistically significant negative correlation was found between the duration of the marriage and level of intimacy in couples though according to a study in the U.S. state, the longer the duration of the marriage, the higher the marital intimacy (22, 23). A study in Canada reported no relationship between the duration of marriage and marital intimacy (24).
According to the statistical yearbook of Iran, the rate of divorce in the years 2008 - 2009 was 21 percent. In addition, Iran was introduced as the fourth country in the world regarding the high ratio of divorce to marriage (25). In years 2013 - 2014, one divorce was registered per every five marriages in Iran (26).
Studies conducted in Iran to investigate marital intimacy and its relevant factors reported different results. For instance, a study showed that there was a statistically significant difference in the total score of marital intimacy between women and men (27). Another study showed no statistically significant difference between the couple’s scores of marital intimacy (21). Moreover, a study indicated that with an increase in age, the level of sexual intimacy decreased. The findings of a study did not confirm any statistically significant difference in the score of marital intimacy between young couples and the middle-aged ones (28, 29).
Mazandaran is a province located in the north of Iran with a divorce rate higher than the average in the country. In years 2013 - 2014, one divorce per every five marriages in Iran was registered while it was one divorce per every 4.1 marriages in Mazandaran (26). There is no study on the factors influencing couples’ intimacy in Mazandaran. According to some studies, the lack of marital intimacy can be the predictor of divorce (4, 11). The 9th principle of international conference on population and development (ICPD) highlights the support of the family as the main unit of the society.
2. Objectives
This study aimed to determine the sociodemographic predictors of marital intimacy in couples.
3. Materials and Methods
3.1. Design and Sample
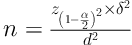
This was a cross-sectional study approved by Research Council and Ethics Committee of Mazandaran University of Medical Sciences, Sari, Iran (Ethics Code:1498.Code: IR.MAZUMS.REC.94.1498) on 118 couples referring to healthcare settings from March to September 2015 in Sari, Iran. The inclusion criteria to recruit the sample were a willingness to take part in this study, Iranian nationality, women at the reproductive age (15 - 44 years old), and living with the spouse for at least one year at the time of data collection (30). Using a multistage random sampling method, the sample size was determined as 118 people. A previous study on the determination of sexual differences in the different domains of intimacy among married university students in Tehran in 2008 reported the standard deviations of marital intimacy in married women and men as 60.46 and 51.35, respectively (27). Given the average standard deviation of marital intimacy reported by the above-mentioned study (SD = 55), 95% confidence interval, and the power of 90, the sample size was determined as 118 couples using the following formula:


To recruit the sample, the 20 urban healthcare centers were listed. In addition, according to the number of couples referring to each healthcare center in Sari, the healthcare centers were divided into two groups of with many clients and with a few clients. Next, given the proportion of the referrals to each group of healthcare centers, the quota of the first group (2/3 of the total sample) was estimated to be 77 couples and the quota of the second group (1/3 of the total sample) was 39 couples. Four centers were randomly chosen from each group of the healthcare centers and the required number of participants was recruited based on the proportion of couples referring to each healthcare center. It is noted that the table of random numbers was used to choose the participants. The heads of the households were contacted by phone. They were informed about the purpose and methods of this study and were asked to refer to the healthcare center with their spouses for data collection. At their referral, they were assessed using the inclusion criteria and written informed consent was taken from those who willingly agreed to participate in this study. They were assured that their rights, the volunteer nature of this study, and the confidentiality of data collection and analysis would be met. The questionnaires were distributed to 125 volunteer couples, and 118 couples filled out and returned the questionnaires for data analysis.
3.2. Data Collection
Data were collected using the socio-demographic questionnaire, the Bagarozzi’s marital intimacy needs questionnaire, Barton’s communication skills questionnaire, Hazan and Shaver’s adult attachment styles (1978) questionnaire, and the interpersonal conflict management style (ICMSI).
A thorough literature review by the authors showed that attachment styles, conflict resolution style, and communication skills could affect marital intimacy among couples. Since these variables could not be evaluated in couples just by asking simple questions, separate valid and reliable questionnaires were used for data collection.
Socio-demographic questionnaire: It included questions regarding age of the self, age of the spouse, the duration of marriage, educational level of the spouse, occupation, satisfaction with economic condition, health status, marital conflicts, duration of premarital relationship, marital satisfaction, and psychological, economic, sexual, physical, verbal, and overall violence.
The Bagarozzi’s marital intimacy needs questionnaire: It was designed by Bagarozzi (4) to evaluate intimacy in emotional, psychological, logical, sexual, physical, spiritual, aesthetic, and social-recreational domains. The content validity of this questionnaire was confirmed by Etemadi et al. (30) with 15 experts in the field of the study and 15 couples. To determine its reliability, this questionnaire was applied to 30 couples and the Cronbach’s alpha coefficient was reported as 0.94. The reliability of this questionnaire for each domain was assessed using a test-retest method, which showed the coefficients of 0.89 for emotional, 0.82 for psychological, 0.81 for logical, 0.91 for sexual, 0.80 for physical, 0.65 for spiritual, 0.76 for aesthetic, and 0.51 for social-recreational domains (27). In the current study, the Cronbach’s alpha coefficient of this questionnaire was determined as 0.96. This questionnaire consisted of 41 questions classified into five questions for the evaluation of each domain of intimacy except for the spiritual domain that had six questions. It was rated on a 10-point scale from 1 (there is no such a need in me at all) to 10 (this need is strong in me). For the eight domains of intimacy, numerical scores were calculated and by summing up the scores of each domain, the total score of intimacy was calculated. The range of scores was from 41 to 410 (31).
The Hazan and Shaver adult attachment styles questionnaire (1978): It was designed by Hazan and Shaver in 1978 comprising three descriptive paragraphs. The descriptive phrases were about the individual’s feelings of the comfortability and intimacy in relationships. If the participants chose the paragraph one as the best description for their feelings, they would be considered safe, and if they chose paragraphs two or three, they would be regarded as unsafe. Paragraph 2 showed the avoidant unsafe attachment style and paragraph 3 showed the anxiety unsafe attachment style (32). The validity of this questionnaire was assessed using content validity, which meant that the content of its items was completely compatible with the structural concepts of the attachment theory. In addition, it was shown that its interactive extension was compatible with adults’ relationships. In a study, the reliability coefficient of this questionnaire using the test-retest method was found to be 0.82 (33).
The Barton’s communication skill questionnaire (1990): it consisted of 18 items to evaluate the three domains of feedback skill, listening skill, and speaking skill with six questions in each domain. The content validity of the questionnaire was evaluated by a panel of experts and its reliability was confirmed by the Cronbach’s alpha coefficient of 0.7. A five-point Likert scale from completely disagree (score 1) to completely agree (score 5) was used to rate the questionnaire’s items. The minimum score in each domain was six and the maximum score was 30 (34).
The interpersonal conflict management style (ICMSI): It had 28 questions with the purpose of evaluating the people’s styles of resolving conflicts with their spouses (20). It consisted of five domains as the collaboration style (questions 1 - 7), the domination style (question 8 - 13), the adaptability style (questions 14 - 18), the avoiding style (questions 19 - 22), and compromise style (questions 23 - 28). This questionnaire was translated into Farsi in 2002 (35). In a study, positive and negative correlations were reported between the subscales of the ROCI-II and the conflict resolution questionnaire (CRT), which showed the desired convergent and divergent validity for this questionnaire. The Cronbach’s alpha coefficients of the questionnaire’s subscales were reported in the range of 0.70 - 0.75. In the current study, the reliability coefficient of this questionnaire using the Cronbach’s alpha coefficient was reported as 0.81. The questionnaire’s response rating was based on a five-point Likert scale from completely disagree (score 1) to completely agree (score 5). The score of each domain as the summation of the scores of the items relevant to that domain indicated the score of that style of conflict resolution. The domain with a higher score showed that the respondent would use that style to resolve conflicts with the spouse. In addition, a higher score for the style indicated the respondent’s more intensive tendency toward that style (36).
3.3. Data Analysis
Descriptive and inferential statistics were used to analyze data via SPSS v.18 software. Descriptive results were presented using the frequency, mean, and standard deviation. The inferential statistics were presented using ANOVA, t-test, Pearson correlation coefficient, paired-samples t test, chi-square, and multiple linear regression. Those variables with a statistically significant p value (< 0.05) entered into the multiple-linear regression model.
4. Results
4.1. Socio-Demographic Characteristics
The mean age of the female and male participants was 31 ± 6.137 and 34.74 ± 6.180 years, respectively. The mean of marriage duration was 10.8 years. Almost half of the sample had an education level of high school diploma and associate degree (Table 1).
Table 1.Frequency Distribution of Couples’ Socio-Demographic Characteristics, Sari, Iran, (n = 118)
| Variable | Female | Male | Total |
|---|---|---|---|
| 118 | 118 | 236 | |
| Age (y) (mean ± SD) | 31 ± 6.137 | 34.74 ± 6.180 | 32.86 ± 6.42 |
| Duration of marriage (mean ± SD) | 10.08 ± 6.618 | ||
| Educational level (%) | |||
| Lower than diploma | 10.2 | 15.3 | 12.7 |
| Diploma or associate degree | 50.8 | 56.8 | 53.8 |
| Bachelor degree or higher | 39 | 28 | 33.5 |
| Satisfaction with the economic condition (%) | |||
| Yes | 24.6 | 21.2 | 22.9 |
| Somewhat yes | 57.6 | 56.8 | 57.2 |
| No | 17.8 | 22 | 19.9 |
| Occupation (%) | |||
| Housekeeper (unemployed) | 78 | 7.6 | 42.8 |
| Government employee | 11 | 23.7 | 17.4 |
| Worker | 11 | 68.7 | 8.36 |
| Marital satisfaction (%) | |||
| Yes | 46.6 | 72.9 | 86.6 |
| Somewhat yes | 31.4 | 25.4 | 28.4 |
| No | 4.2 | 1.7 | 3 |
| Marital conflict (%) | |||
| Yes | 30.5 | 16.9 | 23.7 |
| No | 69.5 | 83.1 | 76.3 |
| Verbal violencea(%) | |||
| Yes | 72 | 68.6 | 70.3 |
| No | 28 | 31.4 | 29.7 |
| Physical violenceb(%) | |||
| Yes | 27.1 | 5.1 | 16.1 |
| No | 72.9 | 94.9 | 83.9 |
| Psychological violencec(%) | |||
| Yes | 54.2 | 43.2 | 48.7 |
| No | 45.8 | 56.8 | 51.3 |
| Sexual violenced(%) | |||
| Yes | 18.6 | 12.7 | 15.7 |
| No | 86.4 | 87.3 | 84.3 |
| Economic violencee(%) | |||
| Yes | 24.6 | 17.8 | 21.2 |
| No | 75.4 | 82.2 | 78.8 |
| Overall violencef(%) | |||
| Yes | 82.2 | 78.8 | 80.5 |
| No | 17.8 | 21.2 | 19.5 |
| Health status (%) | |||
| Healthy | 64.6 | 79.7 | 72.05 |
| Ill | 35.6 | 20.3 | 37.95 |
| Attachment style (%) | |||
| Secure | 55.9 | 61.9 | 58.9 |
| Avoidant | 28 | 23.7 | 25.8 |
| Anxious-ambivalent | 16.1 | 14.4 | 15.3 |
| Conflict resolution | |||
| Collaboration style | 59.3 | 58.5 | 58.89 |
| Domination style | 4.2 | 8.5 | 6.35 |
| Adaptability style | 10.2 | 11.9 | 11.01 |
| Avoiding style | 17.8 | 12.7 | 15.25 |
| Compromise style | |||
| Communication skill (mean ± SD) | 46.6 | 72.9 | 86.6 |
a Such as the use of word uncomfortable, taunt by husband.
b Such as slapping, hitting and beating.
c Such as mocking, Humiliating, Threats.
d Such as having sex by force and without consent.
e Such as not meeting the economic needs.
f Experienced at least one form of violence.
4.2. Marital Intimacy
The mean of total intimacy was 316.42 ± 48.882 in men and 315.14 ± 52.915 in women. There was a positive significant correlation in marital intimacy between men and women (P < 0.001 r = 0.674) (Table 2). The results of Pearson-Spearman correlation between some sociodemographic variables (quantitative variables and ordinal variables) and marital intimacy of male and female participants are shown in Table 3.
Table 2.The Mean Scores of Couples Based on Eight Domains of Marital Intimacy, Sari, Iran (n = 118)
| Gender Domains of Marital Intimacy | "Female" Mean (Standard Deviation) | "Male" Mean (Standard Deviation) | Pearson Correlation | P Value |
|---|---|---|---|---|
| Emotional | 38.06 (7.042) | 38.12 (6.874) | 0.464 | 0.000 |
| Psychological | 37.25 (6.871) | 38.67 (8.407) | 0.274 | 0.003 |
| Physical | 39.74 (7.684) | 39.82 (7.829) | 0.649 | 0.000 |
| Sexual | 39.88 (7.769) | 40.44 (7.089) | 0.644 | 0.000 |
| Logical | 38.61 (6.757) | 38.64 (6.868) | 0.641 | 0.000 |
| Social-Recreational | 38.13 (7.803) | 38.53 (6.917) | 0.528 | 0.000 |
| Spiritual | 46.19 (9.113) | 44.99 (9.319) | 0.528 | 0.000 |
| Aesthetic | 37.28 (7.802) | 37.86 (6.789) | 0.436 | 0.000 |
| Total | 315.14 (52.915) | 316.42 (48.882) | 0.674 | 0.000 |
Table 3.Correlation Coefficients Between Socio-Demographic Variables and Marital Intimacy of Couples, Sari, Iran (n = 118)
| Variable | Pearson-Spearman Correlation (Female) | Pearson-Spearman Correlation (Male) |
|---|---|---|
| Communication skill | 0.403b | 0.444b |
| Age | -0.167 | -0.178 |
| Duration of marriage | -0.184a | -0.207a |
| Educational level | 0.183a | 0.019 |
| Satisfaction with the economic condition | 0.018 | 0.005 |
| Marital satisfaction | -0.432b | -0.329b |
| marital conflicts | 0.323b | 0.260b |
a Correlation is significant at the 0.05 level (2-tailed).
b Correlation is significant at the 0.01 level (2-tailed).
Statistically significant relationships were found between the total score of marital intimacy in men and some variables including marital satisfaction, marital conflicts, conflict resolution style, psychological violence, duration of marriage, the age of the spouse, educational level of the spouse, health status, attachment style, and level of communication skills (P < 0.05). Concerning women, statistically significant relationships were reported between the total score of marital intimacy and marital satisfaction, marital conflicts, conflict resolution style, psychological violence, duration of the marriage, physical, verbal, and overall violence experience of the husband, level of communication skill, and attachment style (P < 0.05). In addition, the multiple linear regression analysis revealed that the levels of communication skills and attachment styles were the predictors of marital intimacy in men, which predicted 60.3% of the overall marital intimacy variance in men. Moreover, the conflict resolution style and marital satisfaction were the predictors of overall marital intimacy in women, which predicted 66.4% of the overall marital intimacy variance in women.
4.3. Predicting Factors of Marital Intimacy
The predictors of marital intimacy were marital dissatisfaction in women, the enhancement of communication skills in the women and men, attachment styles in men, and the conflict resolution style in women. It meant that in case of marital dissatisfaction in women, the intimacy score decreases by 0.78. For every 33 scores increase in communication skills in men, the marital intimacy increases by one point, and for every 29 scores increase in communication skills in women, the marital intimacy increases by one point. In case of an unsafe attachment style in men and adaptable conflict resolution style in women, the intimacy scores decreased by 0.835 and 0.775 scores, respectively (Table 4, 5).
Table 4.Predicting Factors of Marital Intimacy in Men, Sari, Iran (n = 118)
| Variable | Standardized Beta | T Score | Std. Error | P-Value | VIF |
|---|---|---|---|---|---|
| Spouse’s age | -0.023 | -0.170 | 1.101 | 0.865 | 3.239 |
| Attachment style | -0.165 | -2.021 | 5.425 | 0.046a | 1.133 |
| Marital conflicts | 0.090 | 1.002 | 11.584 | 0.318 | 1.353 |
| Duration of marriage | -0.101 | -0.721 | 1.037 | 0.472 | 3.346 |
| Marital satisfaction | -0.073 | -0.805 | 9.026 | 0.423 | 1.395 |
| Communication skill | 0.340 | 4.064 | 0.771 | 0.000a | 1.189 |
| Conflicts resolution style | -0.080 | -0.995 | 2.784 | 0.322 | 1.095 |
| Psychological violence | -0.134 | -1.565 | 4.493 | 0.121 | 1.247 |
| Health status | -0.144 | -1.736 | 10.040 | 0.085 | 1.170 |
a 60.3 percent of the variance of the men’s overall marital intimacy was determined by this variable.
Table 5.Predicting Factors of Marital Intimacy in Women, Sari, Iran (n = 118)
| Variable | Standardized Beta | T Score | Std. Error | P-Value | VIF |
|---|---|---|---|---|---|
| Attachment style | -0.098 | -1.152 | 5/905 | 0.252 | 20.85 |
| Marital conflicts | -0.030 | -0.287 | 12.090 | 0.775 | 2.11 |
| Duration of marriage | -0.154 | -1.927 | 0.632 | 0.057 | 1.19 |
| Marital satisfaction | -0.220 | -2.336 | 8.637 | 0.021a | 1.66 |
| Communication skill | 0.295 | 3.599 | 0.745 | 0.000a | 1.25 |
| Conflicts resolution style | -0.225 | -2.888 | 2.760 | 0.005a | 1.14 |
| Overall violence | 0.140 | 0.420 | 7.562 | 0.675 | 20.85 |
| Psychological violence | -0.234 | -1.166 | 10.537 | 0.246 | 7.55 |
| Physical violence | -0.014 | -0.103 | 10.120 | 0.918 | 3.62 |
| Verbal violence | -0.113 | -0.759 | 9/676 | 0.450 | 4.18 |
a 66.4 percent of the variance of the women’s overall marital intimacy was determined by this variable.
5. Discussion
The purpose of this study was to determine the predictors of marital intimacy in couples referring to healthcare settings in Sari, Iran, in the year 2015.
According to our findings, no statistically significant difference was found in the overall marital intimacy between men and women. In addition, the variables “the communication skill level” and “attachment style” were the predictors of overall marital intimacy in men, and the variables “communication skill level”, “marital satisfaction”, and “conflict resolution style” were the predictors of overall marital intimacy in women.
We found no statistically significant difference in the level of marital intimacy in different domains between women. This result is consistent with the findings of some studies (11, 21, 27, 37) and inconsistent with the findings of two other studies (6, 16). The probable reasons for inconsistencies can be the difference in sample sizes. For example, in a study, the sample size was 57 couples, but the sample size of our study was 118 couples. The sample of the Lemieux’s study comprised married people while our study recruited couples. In addition, data collection tool in the study by Greeff was the schaefer and personal assessment of intimacy in relationships (PAIR) questionnaire, which only evaluated the domains of emotional, socio-recreational, sexual, and logical intimacy. However, in our study, we used the Bagarozzi’s marital intimacy needs questionnaire (2001), which evaluated the eight domains of intimacy. The lack of a significant difference between men and women in terms of marital intimacy is consistent with the findings of other studies. Similar intimacy scores in men and women show the equal importance couples put on intimate relationships (15).
We found that marital satisfaction was the predictor of marital intimacy in women. Moreover, there was a statistically significant positive relationship between the marital intimacy of men and women and marital satisfaction. Therefore, those couples who were satisfied with their marital life had significantly higher levels of intimacy than those without satisfaction or with a moderate level of marital satisfaction. Our results are consistent with the findings of other studies (1, 22, 31, 38-40). Given the fact that marital intimacy is about sharing excitements, hopes, and fears with the spouse, couples with higher marital satisfaction feel comfortable in sharing emotions and excitements and enjoy higher intimacy. Conversely, couples with lower marital intimacy do not inform their spouses about their feelings and excitements (41).
We found that the attachment style is a predictor of marital intimacy in men. In addition, a statistically significant relationship was found between the attachment styles and marital intimacy in couples. It means that people with a safe attachment style have a higher intimacy level than people with an unsafe attachment style. Furthermore, a study showed the statistically significant positive relationship between the safe attachment style and marital intimacy. A statistically significant negative relationship was reported between the avoidant attachment style and marital intimacy (17). Moreover, a study reported a statistically significant relationship between the attachment style and marital intimacy (42). The positive perception and social support are two important characteristics of people with a safe attachment style. The couple’s positive perception enhances the couple’s supportive interactions, which increases the couple’s satisfaction and intimacy. Adults with a safe attachment style have a positive visualization of the attachment source, which enhances the feeling of self-worth and enables them to dampen down the negative emotions in a constructive way. Therefore, people with a safe attachment style report higher marital satisfaction and intimacy (43).
This study also showed that the communication skill was a predictor of marital intimacy in men and women. Furthermore, a statistically significant positive correlation was observed between the level of communication skill and marital intimacy in men and women. The results of this study are consistent with the findings of other studies (18, 19, 44). Given the importance of communication and the method for the transfer of a message, communication skill enables couples to convey their messages more clearly and evade behaviors that may lead to the reduction of marital intimacy and satisfaction such as contempt, criticism, blame, and sarcasm (8).
We found that the conflict resolution style in women is a predictor of marital intimacy in them. Moreover, a relationship was found between the conflict resolution style and marital intimacy in men and women, which means that people with the collaboration conflict resolution style enjoyed higher marital intimacy than those with the adaptability conflict resolution style. Our findings are supported by some studies (20, 45). Some other studies showed a relationship between the conflict resolution style and marital satisfaction (46-48). Considering that intimacy is a subscale of marital satisfaction, the results of those of studies are consistent with our findings. In most cases, intimacy is obtained through the successful resolution of marital conflict. Therefore, satisfaction for the two sides of the relationship and ability to manage and resolve conflicts can constructively form a strong connection in the relationship and help spouses form an intimate relationship.
5.1. Limitations
The limitations of this study were the loss of samples due to time-consuming completion of the questionnaires and the presence of the couple together at the time of completing the questionnaire. In order to eliminate this limitation, the couples were assured to answer the questions in the field of marital relationship and we provided free counseling if necessary.
5.2. Implications for Clinical Practice
Considering the effect of marital intimacy on the stability of the family, counselors should teach young couples about the ways of improving marital intimacy.
The findings of this study can be a basis for interventions and curative programs for couples referring to healthcare centers.
5.3. Implications for Research
A cross-sectional design was used in this study. Therefore, no cause-effect relationship could be depicted through the findings of this study. Future interventional and qualitative studies are needed to identify factors relevant to marital intimacy with more details.
5.4. Conclusions
Future interventions to improve marital intimacy in couples should consider the following factors: marital satisfaction, marital conflicts, duration of the marriage, communication skills, conflict resolution styles, and attachment style. It is noted that counselors should attempt to provide couples with appropriate care by taking into account the above-mentioned factors influencing their interactions and behaviors. Big steps toward improving marital intimacy and strengthening the unity of families can be taken through holding workshops and educational classes on communication skills and conflict resolution skills for young couples.
