1. Background
Topical anesthetics, as valuable tools in the field of dermatology, are widely used to control cutaneous pain associated with medical procedures, prevent or treat chronic conditions such as post-herpetic neuralgia, complex regional pain syndrome, and cancer-related pains. These compounds are expected to cause painless, cutaneous analgesia with a quick onset of action and sufficient duration (1-3). Based on the chemical structure of their intermediate chain, these weak bases are classified into aminoesters (e.g., benzocaine, procaine, tetracaine, etc.) and aminoamides (e.g., bupivacaine, lidocaine, prilocaine) classes (1, 4).
Local anesthetic (LA) drugs are commercially available in various pharmaceutical dosage forms such as gels, creams, ointments, solutions, and patches (5, 6), and many of them are available over-the-counter without the need for a prescription. The purpose of such transdermal formulations is to increase skin permeability, reduce the effective concentration, provide painless, cutaneous analgesia and numbness with a quick onset of action and sufficient duration of action and minimize side effects (6, 7).
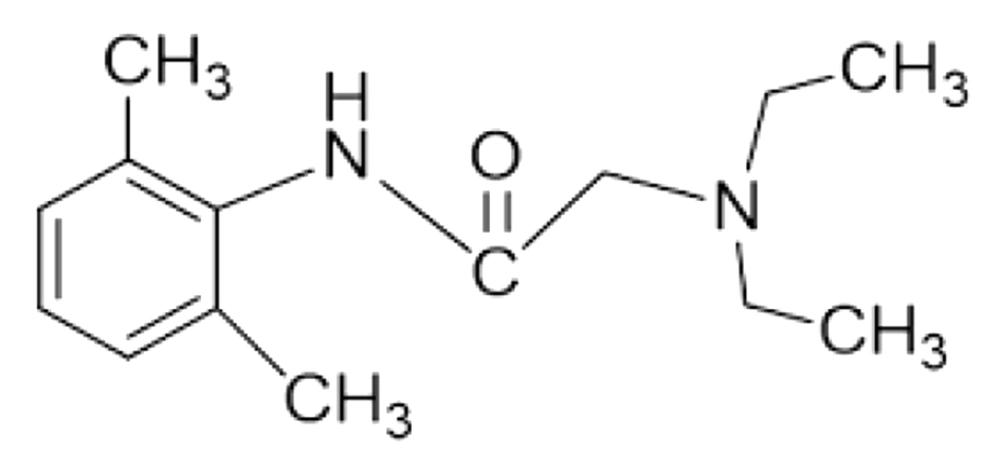
Lidocaine is a low soluble and good penetrating drug (Biopharmaceutical Classification System, class II) with a molecular weight of 234.3 g/mol and log p equal to 2.84, which makes it a good candidate for skin delivery (Figure 1). This amide derivative is the most commonly used as well as an effective and reliable LA drug formulated as topical products due to its desirable properties such as the low risk of allergic reactions, intermediate duration of action, and low systemic toxicity (8-10). However, the major problems encountered with the use of commercial lidocaine products are late-onset and insufficiency of local anesthetic effect. It has been reported that commercial creams or gels are not capable of effectively delivering lidocaine base (or its HCl salt) through the intact skin. To overcome these problems, an increase in the skin permeability to dermally applied lidocaine is required (8).
Several strategies have been adopted to enhance the skin permeability of LAs and improve their onset and duration of action, as well as prevent systemic absorption and reduce side effects. Among the most common physical techniques, one can mention iontophoresis, sonophoresis, magnetophoresis, electroporation, microporation, and microneedle technologies (9, 11, 12). However, using these methods is restricted because of the high cost, need for special devices, and qualified staff (13). Other delivery strategies include the incorporation of LAs into innovative colloidal carrier delivery systems such as liposomes, niosomes, ethosomes, nanospheres, nanoparticles, and microemulsions (5, 13).
Microemulsions (ME), first introduced by Hoar and Schulman (14), are transparent, spontaneously formed, dispersed systems in which the interfacial layer is stabilized by a layer of surfactant molecules (usually in combination with a co-surfactant) (15). These transparent, low viscose, thermodynamically stable (no tendency for flocculation or coalescence) colloidal dispersions with droplets less than 120 nm in diameter offer several advantages for efficient transdermal delivery of drugs. MEs can be formulated as water-in-oil (w/o), oil-in-water (o/w), and bicontinuous systems (16-18). The ease of preparation, relatively high solubilizing capacity for a variety of hydrophilic and lipophilic molecules because of the existence of two microdomains in a single-phase solution, long-term thermodynamic stability, and good production feasibility have made them promising drug delivery systems (19-21). The greater amount of drug incorporated in MEs, compared to conventional topical formulations, could increase the flux of drug through the skin. Moreover, enhancement of drug solubility can increase the concentration gradient and thermodynamic activity of the drug, which could favor its partitioning into the skin. The possibility of employing ingredients for ME formulation with skin penetration enhancing effect can also affect the barrier function of stratum corneum (SC), promoting permeation of drug (22-25).
Since MEs are less viscose in nature, their low skin adherence has restricted their topical application (26). To overcome this challenge and retain the applied dose on the skin for a sufficient time, ME-based gel (MBG) formulations have been, therefore, developed, utilizing a suitable thickening agent to modify the rheological behavior. MBGs, also known as hydrogel-thickened MEs, are nanocarriers derived from o/w MEs composed of dispersed oil phase within a continuous aqueous phase, which is thickened with a suitable hydrophilic gelling agent (27, 28). By the addition of gelling components, the application of MEs to the skin becomes easier compared to runny fluid MEs. Various gelling agents such as Carbopol®, xanthan gum, chitosan, poloxamer, hydroxypropyl methylcellulose, and carrageenan have been utilized for the preparation of MBGs (27, 28).
Based on the type of polymer used, different procedures for the preparation of MBGs have been employed. A mixture of oil, surfactant, and cosurfactant with the dissolved drug is added to the previously prepared hydrogel matrix in a two-stage procedure. Alternatively, o/w ME is prepared and then gelled by directly dispersing a suitable thickening agent (28). These gels have the advantages of both MEs and hydrogels, including ease of preparation, enhanced drug solubility and permeability, optical clarity, longer shelf-life, water solubility, and spreadability (29, 30). In recent years, numerous studies have demonstrated that MBGs are potential transdermal delivery systems for a wide variety of drugs commonly used in different skin disorders or even systemic diseases (31, 32). Negi et al. showed that phospholipid MBGs containing lidocaine and prilocaine have enhanced skin permeation and improved the analgesic effect significantly, compared to the commercial cream (13), while a remarkable analgesic activity has been observed with ropivacaine-loaded MBGs, formulated by Transcutol® HP and Capryol® 90 (33). In 2017, Ustundag Okur et al. investigated the permeation of Carbopol® 940-based, benzocaine-loaded MBGs and confirmed high permeability through the skin with less systemic side effects with no sign of inflammation and irritation (34).
2. Objectives
Since the dermal delivery of lidocaine is still a concern, the suitability of MBGs for its transdermal delivery was examined in this investigation. Thus, this study was planned to develop and characterize lidocaine-loaded MBGs, formulated with pharmaceutically acceptable components. It was hypothesized that a rapid onset and longer duration of anesthetic effect of lidocaine might be produced when incorporated in MBGs.
3. Methods
3.1. Materials
Lidocaine base and Cremophor® RH40 (PEG-40 hydrogenated castor oil) were supplied by Daroupakhsh Pharma Chem. Co. (Tehran, Iran) and Osvah Pharmaceutical Co. (Tehran, Iran), respectively. Kolliphor® ELP (Cremophor® EL, PEG-35 hydrogenated castor oil) was purchased from BASF (Germany). Labrasol® (caprylocaproyl macrogol-8-glycerides) and Transcutol® P (diethylene glycol monoethyl ether) were gifted by Gattefossé (France). Olive & castor oils were provided from Sigma Aldrich (USA) and GPR Rectapur (France), respectively. Triacetin (glycerol triacetate), isopropyl myristate (IPM), polysorbate 80 (Tween 80), polyethylene glycol 400 (PEG 400), propylene glycol (PG), ethanol 96% (v/v), glacial acetic acid (HPLC grade), acetonitrile (HPLC grade), sodium hydroxide and potassium dihydrogen phosphate were all obtained from Merck Chemical Co. (Germany). Carbomer® 934 and 940 were purchased from BF Goodrich (USA). Metolose® 90SH (hydroxypropyl methylcellulose) was provided from Shin-Etsu Chemical Co., Ltd. (Japan). Purified water was prepared by a Millipore Milli-Q water purification system (USA).
3.2. High-Performance Liquid Chromatography (HPLC) Method
A quantitative assay of lidocaine base was carried out by an HPLC method outlined in the United States Pharmacopoeia (USP 41-NF 36). Chromatographic studies were implemented on the Knauer HPLC system (Germany), equipped with a UV detector (Smartline 2500), pump (Smartline 1000), and software (Chromgate V3.1.7). The separation process was carried out on a reversed-phase C18 column (5 μ, 250 × 4.6 mm), using a freshly prepared and degassed mobile phase consisting of acetonitrile (A) and water/glacial acetic acid (930: 50; pH 3.4) in the ratio of 1: 4. The flow rate was fixed at 1.2 mL/min, and all measurements were performed at room temperature. The injection of samples was performed on a Reodyne® injector equipped with a 20 μL loop. The UV detector was set at 254 nm. The calibration curve was found to be linear in the concentration range of 10 - 100 μg/mL (r2 = 0.9985).
3.3. Determination of Lidocaine Oil Solubility
The solubility of lidocaine was evaluated in triacetin, IPM, castor oil, and olive oil by the shake-flask method (35). An excess amount of lidocaine was added to 1 mL of the oil. The mixture was then continuously stirred, using a magnetic stirrer, at room temperature (25°C) for 72 h in order to achieve equilibrium. After removing the undissolved drug, samples were centrifuged (Sigma 1 - 14, Osterode am Harz, Germany) at 5000 rpm for 10 min; the supernatant was separated and filtered through a 0.22 μm membrane filter and then diluted with a suitable solvent (chloroform or ethanol 96% v/v). Finally, the amount of the drug dissolved in each oil was assayed by a UV spectrophotometer (UV-2601, Rayleigh, China) at the wavelength of 263 nm, using oil samples with known drug concentrations.
3.4. Construction of Phase Diagrams
Castor oil and triacetin (selected based on the oil solubility studies), four non-ionic surfactants (Tween 80, Labrasol®, Cremophor® EL and Cremophor® RH40) and three co-surfactants (PEG 400, Transcutol® P and PG) were chosen to construct the phase diagrams and determine the o/w microemulsion domains. Surfactant/co-surfactant weight ratios (Rsm) were kept constant at different values of 1: 1, 1: 2, 2: 1. Clear oil-surfactant mixtures with various weight ratios of 1: 9 to 9: 1 were prepared by weighing appropriate amounts of each component into screw-capped vials and mixing thoroughly at room temperature. Samples were then titrated with small aliquots of triple distilled water while stirring for a sufficient time to attain equilibrium. The course of each titration was inspected visually and through cross-polaroids for determining the clarity and the possible formation of a birefringent liquid crystalline phase. The triangle diagrams were mapped with the top apex representing a fixed Rsm (1: 1, 1: 2, or 2: 1), the right and left apices representing the oil and water, respectively. All mixtures which produced optically transparent, non-birefringent solutions at relatively water-rich parts of the phase diagrams were designated as o/w MEs.
3.5. Preparation of Lidocaine-Loaded MEs
Following the determination of o/w ME regions on the phase diagrams, those oil/surfactant/oil systems which demonstrated a relatively extended o/w ME area on the phase diagrams, composed of a minimum of 5% (w/w) oil and not more than 25% (w/w) surfactant mixture, were selected for drug loading. Lidocaine-loaded MEs were prepared by the spontaneous emulsification method. A given amount of lidocaine base was dissolved gradually in the oil phase to which the surfactant mixtures were then added, and the required amount of distilled water was finally added dropwise while stirring the mixture gently until a transparent solution was obtained. The formulations were stored at room temperature and were evaluated for clarity, drug precipitation, and phase separation within 72 h.
3.6. Characterization of fluid MEs
3.6.1. Refractive Index (RI), pH, and Conductivity
The Refractive index of drug-loaded MEs was measured by Abbe Refractometer (2WAJ, Bluewave Industry Co., Ltd., Shanghai, China). The pH and electrical conductivity of MEs were determined using a calibrated pH-meter (744, Metrohm AG, Switzerland) and a conductivity meter (712, Metrohm AG, Switzerland), respectively.
3.6.2. Determination of Particle Size and Zeta Potential
Mean droplet size (Z-ave), polydispersity index (PDI), and zeta potential of ME formulations were measured at 25°C, using a Malvern Zetasizer (Nano-ZS, Malvern Instruments, Worcestershire, UK), equipped with a Nano ZS® Software for data acquisition and analysis. Each sample was analyzed in triplicate, and the results were reported as mean ± SEM.
3.6.3. Determination of Viscosity and Rheological Behavior
A Brookfield DV2T cone and plate viscometer (LV, Brookfield Engineering Laboratories, Middlesboro, USA), equipped with a CP-42 spindle, was used to measure the viscosity and examine the rheological behavior of ME formulations. To evaluate thixotropic behavior, measurements were carried out at a rotation speed ranging from 2 to 70 rpm for both up curves and down curves, at 25 ± 1°C. Results within the 10 - 100% range of torque were considered acceptable and recorded. The shear stress (Pa) was plotted vs. shear rate (1/s), and the viscosity was calculated based on the slope of the linear portion of the plots.
3.7. Preparation of lidocaine-loaded MBGs
MBGs containing 5 wt% lidocaine were fabricated by dispersing different amounts of various polymers, namely Carbomer® 934 (1 - 3 wt%), Carbomer® 940 (0.5 - 1.5 wt%) or Metolose® 90SH (3 - 6 wt%), in the drug-loaded fluid MEs under magnetic stirring.
3.8. Gel Characterization
3.8.1. Spreadability
To measure the spreadability of MBGs, a circle with 1 cm in diameter was marked on a glass plate. Half a gram of the test gel was placed on the circle, and a second glass plate was placed on the gel. A 5 g weight was put on the upper glass plate, and after 5 min, the weight was removed, and the diameter of the spread gel was measured and reported (36).
3.8.2. pH Measurement
One gram of MBGs was mixed with 99 g distilled water and stirred thoroughly until a uniform mixture was obtained. The pH was measured in triplicate, using a calibrated pH meter (744, Metrohm AG, Switzerland).
3.8.3. Determination of Viscosity and Rheological Behavior
Viscosity and rheological properties of the MBGs were determined at 25 ± 1°C, using a Brookfield DV-III Ultra Programmable Rheometer (Brookfield Engineering Laboratories, Middlesboro, USA), attached with spindle no. 51. Measurements were performed at a rotation speed ranging from 0.5 to 250 rpm for both upward and downward flow curves. Flow curves (rheograms) were plotted, and the viscosities were then calculated based on the slope of the linear portion of the plots.
3.8.4. Stability Tests
Fluid MEs were stored in sealed glass vials at 25°C for 15 months and observed for any macroscopic changes, including turbidity, phase separation, drug precipitation, and color change (37). The stability of the selected MBGs was also evaluated for 6 months at ambient temperature, 2 - 8°C and 40 ± 2°C (relative humidity: 75 ± 5%), and checked for their appearance and viscosity. In addition, the optimum gel formulations were centrifuged (5702, Eppendorf AG, Hamburg, Germany) at 5000 rpm for 30 min, subsequently subjected to seven heating/cooling cycles (24 h at 4°C followed by 24 h at 40°C) and three 24-hour freeze-thaw (FT) cycles (-5 and 25°C) (38-40).
3.9. In-Vitro Drug Release
3.9.1. Cellulose Acetate Membrane
In-vitro permeation study of lidocaine-loaded MBGs was carried out using vertical Franz diffusion cell with 1.767 cm2 effective diffusion surface area. Synthetic cellulose acetate membrane (MW cut-off 12,000 Da), previously soaked in phosphate buffer pH 7.4 for 24 h at 2 - 8°C, was placed between the donor and receptor compartments of the diffusion cell. The receptor chamber (25 mL) was filled with phosphate buffer solution (0.1 M, pH 7.4) and thermostated at 37 ± 0.5°C, while continuously stirring (400 rpm). A quantity of 200 mg of the gel was applied to the membrane, and the donor chamber was covered with Parafilm®. At predetermined time intervals (5, 7, 10, 15, 20, 30, 45, 60, 75, 90, 105, and 120 min), an aliquot of 2 mL sample was taken from the release medium, and the same volume of the fresh buffer was added to the receptor chamber to maintain the sink condition. During the test, the diffusion cells were checked for the presence of a bubble on both sides of the membrane. The cumulative amount of drug released from MBGs at each time was measured. As a control, a commercially available 5 wt% lidocaine gel was used.
3.10. Ex-vivo Permeation Study
The ex-vivo permeability study protocol was approved by the local Animal Ethics Committee of Shahid Beheshti University of Medical Sciences, Tehran, Iran (approval No: 1399.002). Male Wistar albino rats (200 - 250 g) were sacrificed by ether inhalation. The hair of test animals was carefully trimmed with electrical clippers, and the full-thickness skin was excised carefully from the abdominal region and wiped with acetone to remove adhering fat and connecting tissues. The prepared skins were wrapped in aluminum foil and stored at -20°C for further use. Prior to the test, the skins were kept for 30 min at ambient temperature, then mounted between the donor and receiver compartments of a static Franz diffusion cell, while the dermis side was in contact with the release medium for 12 h (41). After skin hydration and replacement of fresh phosphate buffer (pH 7.4), the skin permeation study was carried out with the same procedure described for the in-vitro drug release experiments, except that the samples were taken from the receptor chamber after 7, 10, 15, 20, 30, 45, 60, 75, 90, 105, 120, 150, 180, 210, 240, 300, 360, 480 and 600 minutes and filtered through a 0.45 μm membrane filter. The cumulative percentage of lidocaine in withdrawn samples was calculated, and the results were plotted as a function of time (in a minute) and compared with those obtained from the commercial gel. The ex-vivo release profile was fitted into various mathematical models, i.e., zero-order, first-order, Higuchi and Korsmeyer-Peppas, in order to elucidate the kinetic release model. All the experiments were performed in triplicate, and the results were reported as mean ± SEM. Data were statistically analyzed by one-way analysis of variance (ANOVA), followed by Tukey's post hoc using GraphPad Prism version 8.0.1 (GraphPad Software, Inc., USA). A 0.05 level of probability was considered as the level of significant difference (*P < 0.05: significant, **P < 0.01: very significant, and ***P < 0.001: extremely significant).
3.11. Evaluation of the Local Anesthetic Effect
Male Wistar albino rats (200 - 250 g) and New Zealand white male albino rabbits (2.0 - 2.5 kg) were obtained from Pasteur Institute (Tehran, Iran) and used for local anesthetic studies and skin irritation tests, respectively. The animals were housed in suitable cages at a controlled temperature (20 - 24°C), on a 12: 12 h, day/night cycle with free access to a pellet diet and water ad libitum. All animal experiments were performed in accordance with the National Institute of Health (NIH) Guide for the Care and Use of Laboratory Animals (8th edition), approved by the Institutional Animal Care and Use Committee and local Animal Ethics Committee of Shahid Beheshti University of Medical Sciences (No. IR.SBMU.PHARMACY.REC.1399.002). The local anesthetic effect of formulations was assessed by performing a manual von Frey test. All experiments were carried out between 9: 00 and 16: 00. Before the experiments, the adult male rats were placed in an individual clear acrylic box with an elevated plastic wire mesh floor which allowed acclimating for 30 min in the testing environment. Animals were divided randomly into the following groups (n = 8): (1) placebo control group (control A, B, and C); (2) treated group with selected lidocaine-loaded MBGs (formulation A, B, and C); and (3) treated group with the commercial lidocaine gel.
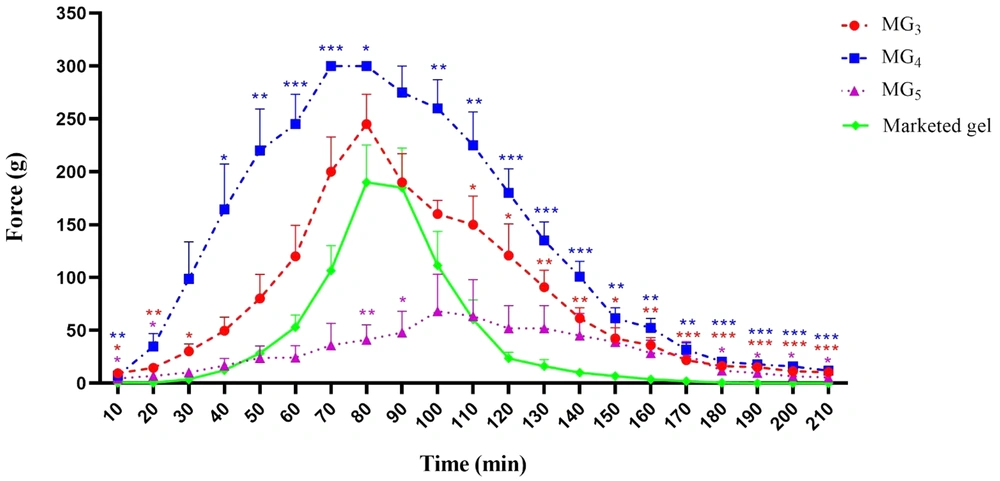
In this behavioral study, 0.5 g of each gel was topically applied to the rat hind paw. Then, a series of 10 von Frey filaments with logarithmic incremental stiffness (4, 6, 8, 10, 15, 26, 60, 100, 180, and 300 g) in ascending order was used to determine the mechanical allodynia threshold of the animals, 10 - 210 min following the application of the gel with 10-min intervals. Each nylon filament was applied five times through the mesh floor on the plantar surface of the rat paw till it bends (buckles). Brisk paw withdrawal, licking, or shaking of the stimulated paw was considered as a positive response (42). The strongest filament inducing up to two responses out of five stimuli was recorded as the mechanical threshold at each time point. Results were reported as mean ± SEM. Statistical differences were evaluated using two-way ANOVA with Bonferroni's post-test to compare the mechanical threshold at each time, and one-way ANOVA followed by Tukey's post-test to evaluate the created area under the time-course curve (AUC10-210 min) of the mechanical threshold by each formulation during the test. As stated earlier, P < 0.05 was considered statistically significant (*P < 0.05, **P < 0.01 and ***P < 0.001).
3.12. Skin Irritation Test
The acute dermal irritation potential of the final formulation was evaluated in accordance with the OECD guideline (43). The animals were acclimatized for one week before the beginning of the study and had access to a standard diet and food. The hairs on the back of rabbits were trimmed by an electrical clipper 24 h prior to administration of the formulation. The animals were divided into three groups (n = 3) as follows: (1) no application (control); (2) blank MG4; and (3) drug-loaded MG4.
Half a gram of gel formulations was applied uniformly to the test area (approximately 6 cm2). At the end of the 4-h exposing duration, the residual gel was wiped off with water. All rabbits were observed for any visible change such as erythema or edema after 1, 24, 48, and 72 h of the gel application. If skin damage cannot be recognized as irritation or corrosion after 72 h, the observation should continue until day 14 in an attempt to determine the reversibility of the effects. Erythema and edema were graded according to the following criteria: 0, no visible reaction; 1, very slight reaction; 2, well-defined erythema; 3, moderate to severe reaction; 4, severe reaction. Finally, the irritation scores of the test area were calculated using the following equation and interpreted according to Table 1:
PII (Primary Irritation Index) = (Σ Erythema at 1, 24, 48, 72 hr + Σ Edema at 1, 24, 48, 72 hr)/(3 × number of animals)
4. Results and Discussion
4.1. Drug Solubility in the Oil Phase
The ability of the oil phase for drug solubilization is considered as the most important criterion for o/w microemulsion formulations (44). Lidocaine solubility results for different oils are given in Figure 2. As can be seen, the highest solubility was obtained in castor oil and triacetin (538.460 ± 7.457 mg/mL and 530.727 ± 6.029 mg/mL, respectively). This represents the potential of these oils to solubilize lidocaine, and therefore, they were selected for ME and MBG preparations.
4.2. Phase Diagrams and o/w ME Domains
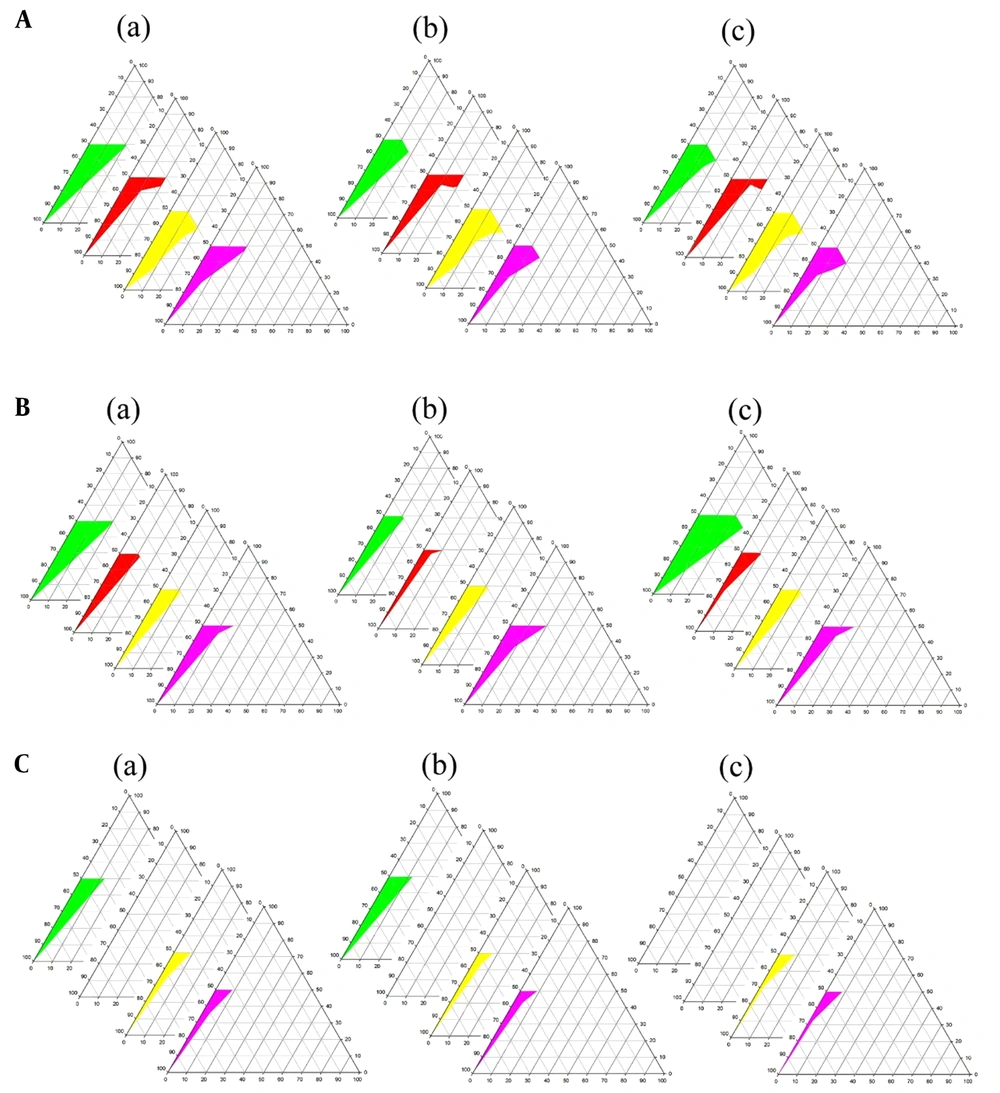
Phase diagrams of four-component systems were constructed to determine the appropriate concentration ranges of the components to form MEs. Unlike the systems containing castor oil, the o/w ME region was observed on triacetin-based phase diagrams. Figure 3 indicates that in nearly all phase diagrams (except for triacetin/Tween 80/PEG 400/water systems at Rsm of 1: 2 and triacetin/Labrasol®/PEG 400/water, regardless of Rsm), a transparent, isotropic o/w ME region was formed in the oil-poor part of the phase diagrams. It should be noted that because of the difficulties in accurately determining the boundaries between the ME domains and surfactant-rich area on the top of the phase diagrams, samples with up to 50 wt% surfactant mixture were considered as MEs, above which the area was considered as surfactant-rich area.
Phase diagrams of systems consisting of triacetin as the oil phase (right apex), distilled water (left apex); A, Transcutol® P; B, PG; and C, PEG 400 as co-surfactant and various surfactants (top apex) namely Tween 80 (green), Labrasol® (red), Cremophor® EL (yellow), and Cremophor® RH40 (purple) at various Rsm of a, 1: 1; b, 1: 2, and c, 2: 1. The colored area in the oil-poor part of the phase diagram represents the o/w ME domain.
The following generalizations could be made about the investigated systems: (1) tween-based systems showed higher water solubilization capacity in comparison to the other surfactants; (2) irrespective of the type of surfactant and Rsm, the largest and smallest ME areas were seen in the presence of Transcutol® P and PEG 400, respectively; and (3) regardless of the type of surfactant and co-surfactant, Rsm did not have a significant influence on the extent of the o/w ME region.
Various ME formulations were selected from the relatively extended o/w ME area on the phase diagrams, considering the minimum possible concentration of surfactants. Those with no drug precipitation and phase separation at the time of preparation and after 72 h storage were chosen for further characterization tests (Table 2).
| Microemulsion | Triacetin (%) (Oil Phase) | Surfactant (%) | Co-surfactant (%) | Water (Aqueous Phase) | ||||
|---|---|---|---|---|---|---|---|---|
| X1 | X2 | X3 | X4 | X5 | X6 | |||
| ME1 | 5.04 | 16.59 | - | - | 8.29 | - | - | 70.08 |
| ME2 | 5.04 | 12.49 | - | - | - | 12.49 | - | 69.98 |
| ME3 | 5.04 | 16.59 | - | - | - | 8.29 | - | 70.08 |
| ME4 | 5.04 | 16.59 | - | - | - | - | 8.29 | 70.08 |
| ME5 | 5.04 | - | 12.49 | - | 12.49 | - | - | 69.98 |
| ME6 | 5.04 | - | 16.59 | - | 8.29 | - | - | 70.08 |
| ME7 | 5.04 | - | 9.97 | - | - | 9.97 | - | 75.02 |
| ME8 | 5.04 | - | 8.29 | - | - | 16.59 | - | 70.08 |
| ME9 | 5.04 | - | 13.23 | - | - | 6.74 | - | 74.99 |
| ME10 | 5.04 | - | 9.97 | - | - | - | 9.97 | 75.02 |
| ME11 | 5.04 | - | 16.59 | - | - | - | 8.29 | 70.08 |
| ME12 | 5.04 | - | - | 16.59 | 8.29 | - | - | 70.08 |
| ME13 | 5.04 | - | - | 12.49 | - | 12.49 | - | 69.98 |
| ME14 | 5.04 | - | - | 16.59 | - | 8.29 | - | 70.08 |
Composition of the Selected Microemulsion Systems for Drug Solubilization a
4.3. ME Characteristics
The prepared formulations (Table 2) were found to be macroscopically identical, i.e., homogeneous, single-phase, and transparent by visual inspection. The colloidal nature of these systems was also confirmed by observing the Tyndall effect. Table 3 lists the data of Z-average, PDI, zeta potential, pH, conductivity, and viscosity of the drug-loaded ME formulations. The isotropic nature of the formulations was also confirmed as a completely dark field was observed under the cross-polarized light microscope.
| ME | Z-Average (nm) | PDI | Zeta Potential (mV) | pH | Conductivity (µS/cm) | Refractive Index | Viscosity (mPa.s) |
|---|---|---|---|---|---|---|---|
| ME1 | 47.073 ± 0.524 | 0.408 ± 0.005 | 0.635 ± 0.029 | 8.04 ± 0.030 | 194.005 ± 0.116 | 1.3850 ± 0.0002 | 27.10 ± 0.058 |
| ME2 | 36.710 ± 0.541 | 0.460 ± 0.009 | -0.711 ± 0.075 | 8.28 ± 0.015 | 167.327 ± 0.122 | 1.3815 ± 0.0002 | 11.90 ± 0.033 |
| ME3 | 45.290 ± 0.593 | 0.389 ± 0.004 | 0.0886 ± 0.035 | 7.82 ± 0.012 | 193.940 ± 0.035 | 1.3830 ± 0.0003 | 18.50 ± 0.044 |
| ME4 | 44.140 ± 1.400 | 0.380 ± 0.009 | 0.0255 ± 0.040 | 7.76 ± 0.010 | 194.721 ± 0.124 | 1.3830 ± 0.0002 | 19.70 ± 0.015 |
| ME5 | 52.196 ± 0.248 | 0.404 ± 0.002 | 0.523 ± 0.046 | 7.80 ± 0.010 | 190.037 ± 0.043 | 1.3840 ± 0.0002 | 20.90 ± 0.010 |
| ME6 | 30.950 ± 0.163 | 0.363 ± 0.003 | -0.265 ± 0.058 | 7.90 ± 0.012 | 169.172 ± 0.588 | 1.3865 ± 0.0003 | 26.8 0± 0.007 |
| ME7 | 38.850 ± 0.117 | 0.357 ± 0.007 | 0.366 ± 0.035 | 8.11 ± 0.010 | 198.340 ± 0.116 | 1.3770 ± 0.0005 | 8.59 ± 0.006 |
| ME8 | 59.506 ± 0.532 | 0.452 ± 0.008 | 0.285 ± 0.046 | 8.09 ± 0.015 | 194.288 ± 0.130 | 1.3805 ± 0.0002 | 7.85 ± 0.006 |
| ME9 | 32.380 ± 0.121 | 0.371 ± 0.001 | 0.134 ± 0.023 | 8.04 ± 0.025 | 188.365 ± 0.289 | 1.3765 ± 0.0003 | 11.20 ± 0.007 |
| ME10 | 28.016 ± 0.112 | 0.314 ± 0.001 | 0.832 ± 0.080 | 8.10 ± 0.009 | 176.834 ± 0.324 | 1.3750 ± 0.0005 | 8.41 ± 0.010 |
| ME11 | 20.626 ± 0.225 | 0.350 ± 0.001 | -0.447 ± 0.052 | 7.98 ± 0.015 | 162.591 ± 0.176 | 1.3820 ± 0.0002 | 19.80 ± 0.030 |
| ME12 | 45.400 ± 5.506 | 0.428 ± 0.050 | 0.0318 ± 0.064 | 8.16 ± 0.010 | 179.647 ± 0.472 | 1.3890 ± 0.0005 | 18.80 ± 0.046 |
| ME13 | 57.060 ± 14.475 | 0.178 ± 0.006 | -0.310 ± 0.035 | 8.20 ± 0.015 | 173.398 ± 1.041 | 1.3810 ± 0.0005 | 9.10 ± 0.006 |
| ME14 | 26.910 ± 0.736 | 0.232 ± 0.006 | 0.201 ± 0.098 | 8.22 ± 0.012 | 173.012 ± 1.882 | 1.3820 ± 0.0003 | 14.00 ± 0.055 |
Characterization of Fluid MEs (Mean ± SEM).
The refractive indices of all formulations were ranged between 1.3750 and 1.3890 and close to that of water as the external phase (1.334). Electrical conductivity measurement is a useful tool to differentiate w/o droplets from o/w-type droplets and bicontinuous structures. Generally, low conductivity exhibits the formation of w/o droplet MEs (because water makes the internal phase), while systems showing high conductivity are defined as bicontinuous or o/w-type MEs as the presence of water in the continuous phase allows the measurement of conductivity. In this study, data obtained from both RI and conductivity measurements (162.592 - 198.340 µS/cm) approved the o/w structure of the MEs studied (45). The conductivity results also depicted that the addition of lidocaine to the internal phase of MEs did not affect the system stability.
The average particle size and size distribution of MEs were evaluated by the dynamic light scattering technique. PDI was also determined to provide information about the deviation from the mean size. Table 3 represents the results of size and PDI analysis. As can be seen, in all systems, the average size of the ME droplets was less than 60 nm (ranged from 20.626 - 59.506 nm) which lies in the proposed range for ME systems (< 120 nm). All formulations exhibited unimodal droplet size distribution patterns (diagrams not shown). In most cases, as a measure of droplet size uniformity, PDI values were found to be less than 0.4, suggesting that droplets in nearly all MEs were relatively uniform-sized.
To analyze the charge of the droplets, zeta potential is determined. Zeta potential values indicated that the interface had a low surface charge (-0.711 to +0.832 mV). The charge in the interfacial area, in general, may originate from many factors the composition of oil, the presence of electrolytes in the water phase, and the nature of surfactants. In this study, very low zeta potential (nearly zero potential) values obtained in this study could be ascribed to the presence of non-ionic surfactants. Zeta potential is not usually considered as an important measure for the stability prediction of MEs prepared with non-ionic surfactants (46).
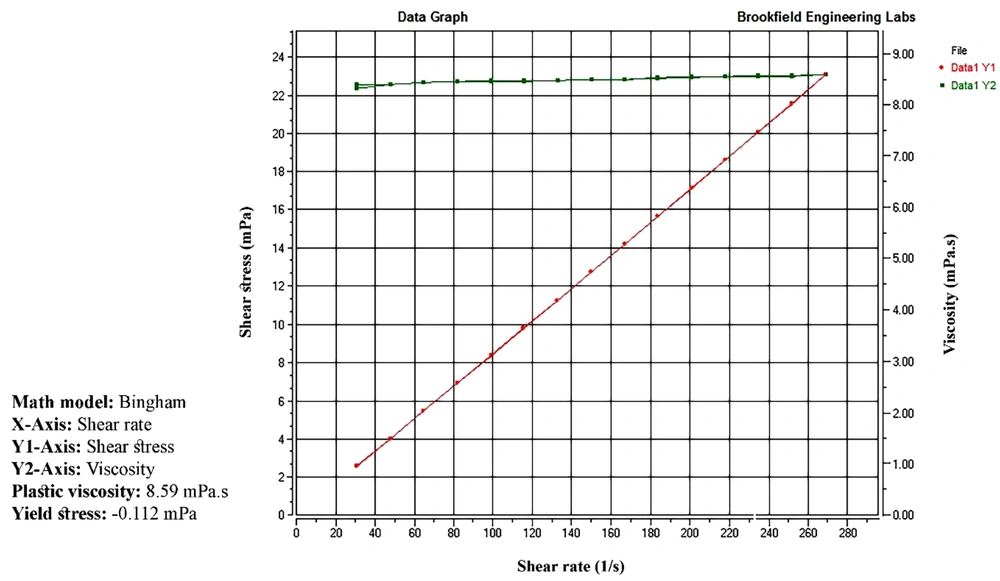
The pH values of all MEs were found to vary between 7.76 and 8.28. A slight increase in pH could be attributed to the presence of lidocaine in the formulations. MEs possessed very low viscosity (7.85 to 27.1 mPa.s), independent of shear rate. For all formulations, a linear section was observed on the flow curves, constructed with shear stress vs. shear rate (r2 ≥ 0.99). Figure 4 illustrates the rheogram of the ME5 formulation.
4.4. MBGs
Three different gelling agents were used to increase the viscosity of MEs. In the presence of Carbomer® 934, all gels were found opaque. HPMC was also unable to yield clear, homogenous MBGs with desired viscosity. Turbidity and lack of homogeneity were resolved by substituting HPMC and Carbomer® 934 with Carbomer® 940 (47). As described by Chen et al., the reason might be associated with the dissociation of Carbomer® 934 and HPMC matrices from the hydrated state by surfactant and co-surfactant in the microemulsion (48). The gels were also evaluated in terms of stickiness, ease of spreading, and coarseness by rubbing a sufficient amount of gels between index and thumb fingers. In general, results showed that all Carbomer® 940-based gels were homogeneous, transparent, and smooth without any particulate matter, grittiness, or lumps and, therefore, MBGs with 1 wt% of Carbomer® 940 were finally prepared for further investigations.
4.5. MBGs Properties
The data obtained from the characterization of MBGs in terms of spreadability, pH, and viscosity are given in Table 4. The spreadability of gel formulations, that is, the ability of gels to spread uniformly on the skin surface, is a property upon which the therapeutic efficiency of a gel depends and helps in the uniform gel application. Values in Table 4 refer to the extent to which the formulations readily spread on the glass plates by applying a small amount of shear.
| Formulations | Spread Diameter (cm) | pH | Viscosity (mPa.s) | Flow Index | Nature/Type of Flow |
|---|---|---|---|---|---|
| MG1 | 3.3 ± 0.058 | 7.23 ± 0.012 | 696.65 ± 0.870 | 0.3397 | Shear-thinning/pseudoplastic |
| MG2 | 3.6 ± 0.033 | 7.42 ± 0.015 | 428.85 ± 0.731 | 0.3438 | Shear-thinning/pseudoplastic |
| MG3 | 3.7 ± 0.058 | 6.98 ± 0.010 | 705.75 ± 0.463 | 0.3247 | Shear-thinning/pseudoplastic |
| MG4 | 3.8 ± 0.033 | 6.88 ± 0.009 | 796.08 ± 0.511 | 0.3245 | Shear-thinning/pseudoplastic |
| MG5 | 3.6 ± 0.058 | 6.97 ± 0.012 | 712.89 ± 0.932 | 0.3156 | Shear-thinning/pseudoplastic |
| MG6 | 3.7 ± 0.067 | 7.10 ± 0.030 | 773.89 ± 1.261 | 0.3404 | Shear-thinning/pseudoplastic |
| MG7 | 4.1 ± 0.058 | 7.21 ± 0.010 | 235.51 ± 0.334 | 0.3467 | Shear-thinning/pseudoplastic |
| MG8 | 4.2 ± 0.033 | 7.16 ± 0.015 | 224.83 ± 0.327 | 0.4479 | Shear-thinning/pseudoplastic |
| MG9 | 3.9 ± 0.100 | 7.18 ± 0.009 | 379.50 ± 0.464 | 0.3140 | Shear-thinning/pseudoplastic |
| MG10 | 3.2 ± 0.058 | 7.22 ± 0.030 | 660.12 ± 1.359 | 0.2788 | Shear-thinning/pseudoplastic |
| MG11 | 3.1 ± 0.067 | 7.14 ± 0.003 | 871.62 ± 1.458 | 0.2988 | Shear-thinning/pseudoplastic |
| MG12 | 3.3 ± 0.033 | 7.28 ± 0.010 | 677.93 ± 1.034 | 0.3265 | Shear-thinning/pseudoplastic |
| MG13 | 3.8 ± 0.100 | 7.31 ± 0.009 | 397.85 ± 1.172 | 0.3489 | Shear-thinning/pseudoplastic |
| MG14 | 3.5 ± 0.153 | 7.33 ± 0.015 | 516.76 ± 1.023 | 0.3502 | Shear-thinning/pseudoplastic |
| Marketed gel | 3.9 ± 0.100 | 6.87 ± 0.025 | 328.18 ± 0.572 | 0.4776 | Shear-thinning/pseudoplastic |
Characterization of the MBGs (Mean ± SEM).
Results indicated that the highest spreading diameter (4.2 cm) was obtained for the formulation MG8, which possessed the lowest viscosity, whereas the lowest spreading diameter (3.1 cm) was found for the system MG11 with the highest viscosity. The appropriate spreadability of MBGs may be related to the loose gel matrix nature of MBGs due to the presence of oil globules (49).
As depicted in Table 4, it was observed that pH values of MBGs were within the physiological range varying from 6.87 to 7.42. This pH range suggests that the gels could result in less irritation to the skin. A decrease in pH of MBGs in comparison with MEs may be attributed to the acidic properties of Carbomer® 940 (17).
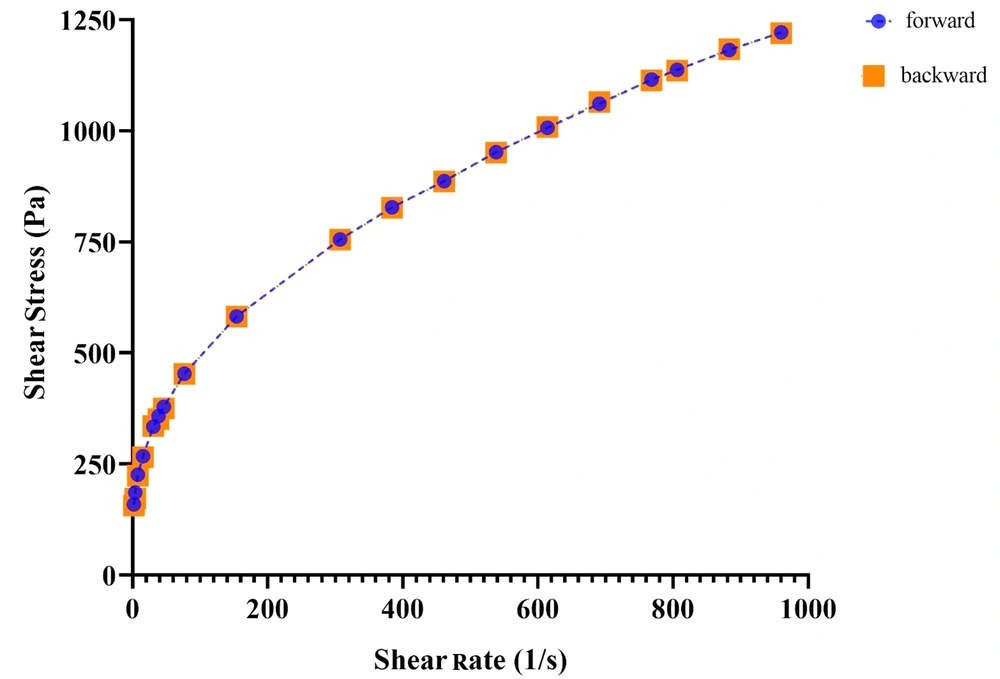
The use of MEs on the skin is very difficult because of their fluidity. For a dermal pharmaceutical or cosmetic product, an appropriate viscosity with sufficient retention time on the skin is required. Hence, MBGs were developed by using Carbomer® 940 in an attempt to modify rheological behavior. Viscosity values for lidocaine-loaded gels are also shown in Table 4. As expected, following the incorporation of the gelling agent into MEs, the viscosity of systems increased significantly (from 224.83 to 871.62 mPa.s), and pseudoplastic behavior was observed. The latter could facilitate and improve the spreading features of the formulation. The flow indices (n) were found to be less than 1 (0.2788 - 0.4479), indicating that all MBGs were shear-thinning in nature according to the power law equation (13). Rheograms also revealed the absence of thixotropy in the gels investigated (see Figure 5).
4.6. Stability Studies of Fluid MEs and MBGs
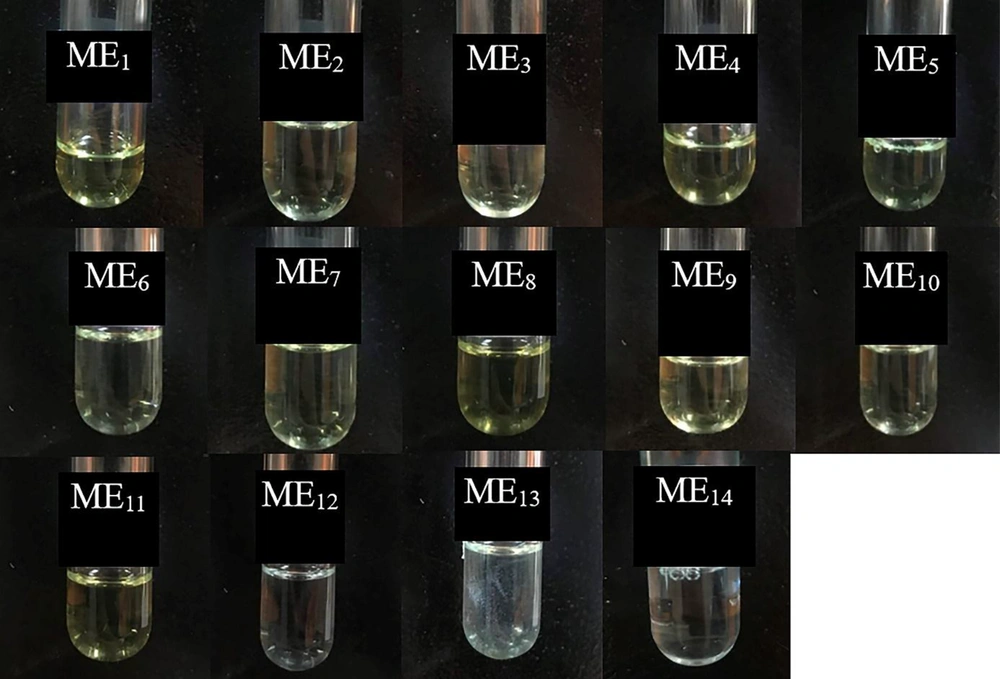
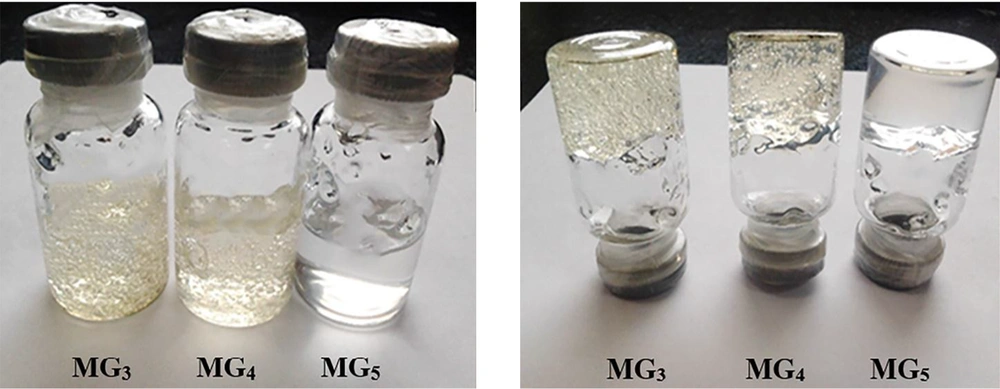
The stability of MEs was evaluated after 15 months of storage at room temperature. MGBs were also kept at different storage conditions (5 ± 3°C, 25 ± 2°C and 40 ± 2°C) for 9 months, and their transparency and consistency were monitored. As shown in Figure 6, all ME formulations (except ME13) were clear without any turbidity or sedimentation. The gels also remained clear with homogenous structures and displayed no macroscopic physical changes following storage at ambient temperature and in a refrigerator (see Figure 7). However, loss of their viscosity was observed after 60 days of storage at 40°C.
The stability of MBGs was evaluated under stressed conditions by visual inspection. When subjected to centrifugation at 5000 rpm for 30 min, it was found that this stress-induced no damage, and the formulations remained homogeneous and exhibited no sign of phase separation or breakdown. The effect of heating-cooling cycles on the stability of MBGs was also verified. In each heating-cooling cycle, the sample was first heated to 40°C for 24 h and subsequently cooled to 4°C for 24 h. Seven heating-cooling cycles were run to record the gel responses to temperature fluctuations. Finally, the influence of the repeatedly freeze-thawed treatment (-5 and 25°C for 24 h) on the stability of the gels was investigated. The results obtained from these stability tests foresee MBGs to have good physical stability since no phase separation was observed and the textural properties were not influenced by temperature variation.
4.7. Permeation Study
Drug release and permeation studies through cellulose acetate membrane and rat skin, respectively, from MBGs, were carried out using vertical Franz diffusion cells. Although human skin is considered the gold standard in permeation study of topical formulations, however, limited availability, variability, and ethical reasons have led to employ the animal skin models (50). Some structural similarities between rat skin and human skin (e.g., thickness, lipid content, and water uptake) can propose rat skin as a surrogate for permeation studies (51, 52). For preliminary drug permeation screening, the lipophilic artificial membrane was employed, and subsequently, an ex-vivo permeation study on rat skin was conducted for the formulations with the highest flux value through an artificial membrane.
4.8. In-Vitro Drug Release Through an Artificial Membrane
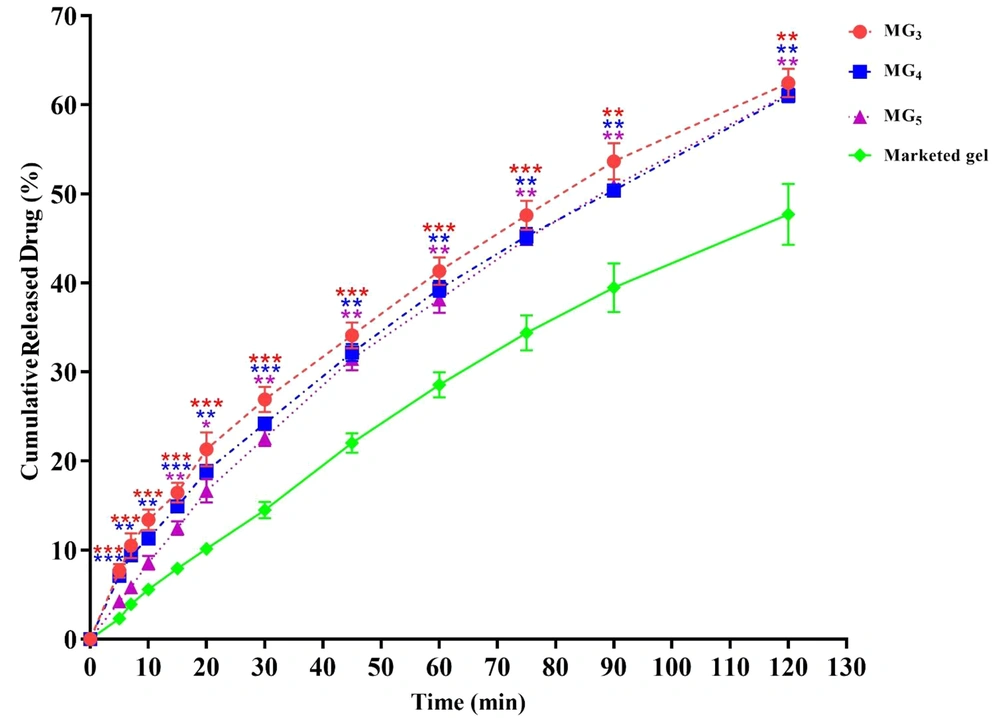
This part of the investigation was aimed to select the best MBG formulations for ex-vivo skin permeation and animal tests. The cumulative percentage of released lidocaine was plotted as a function of time (Figure 8). In general, it was observed that in all MBGs, the drug release percentage at all sampling points was significantly greater than that of the commercial gel, suggesting that MBGs could improve the release pattern of the drug in comparison with the marketed product. In-vitro drug release profiles also revealed that the formulations MG3 (triacetin/Tween 80/Transcutol® P at Rsm of 2:1), MG5 (triacetin/Cremophor® EL/PEG 400 at Rsm of 1: 1), and MG4 (triacetin/Tween 80/PG at Rsm of 2:1) released the maximum amount of lidocaine (61.65 ± 1.62%, 61.24 ± 0.70% and 61.04 ± 0.76%, respectively) after 2 hours (P < 0.01) (Figure 8), while the system MG11 (triacetin/Cremophor® EL/PG at Rsm of 2: 1) displayed the lowest amount of released drug (50.42 ± 0.76%) with no statistically significant difference compared to the commercial gel (P > 0.05). Therefore, MG3, MG4, and MG5 were considered as the optimum gel systems and chosen for ex-vivo drug permeation investigations.
In-vitro drug release profiles of formulation MG3, MG4 and MG5 through an artificial membrane. Data are shown as means ± SEM (n = 3). One-way ANOVA followed by Tukey’s post-test multiple comparisons were conducted (*P < 0.05: significant; **P < 0.01: very significant; and ***P < 0.001: extremely significant, in comparison with the marketed product).
4.9. Ex-vivo Drug Permeation Through the Skin
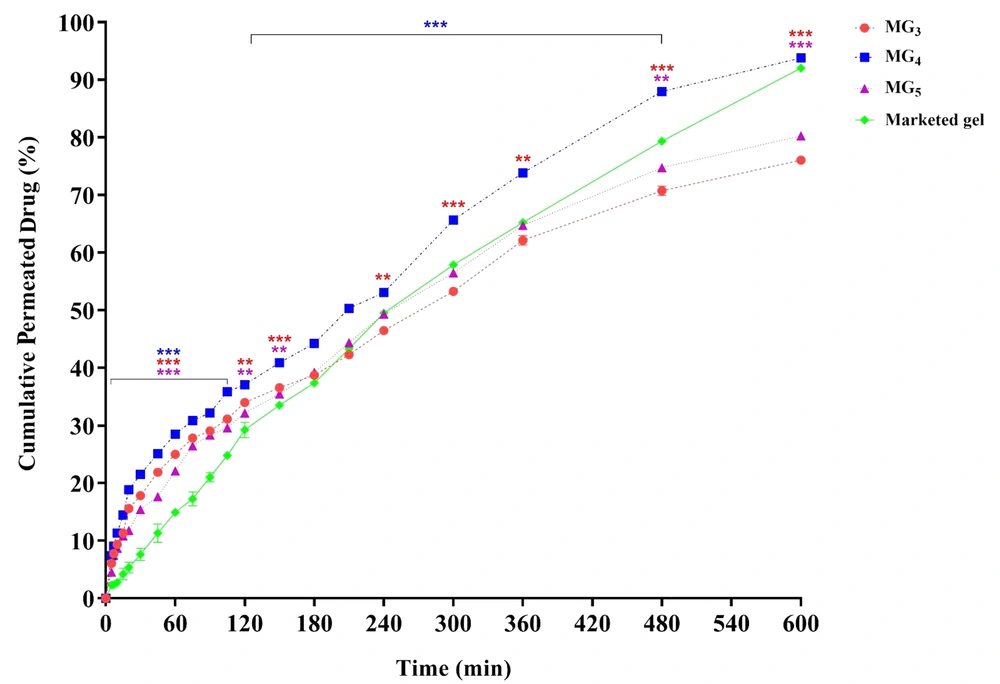
The ex-vivo drug permeation through the skin was carried out in an attempt to formulate a vehicle with suitable skin uptake and penetration. Results are depicted in Figure 9. As can be seen, the drug permeation from formulations MG3, MG4, and MG5 started immediately without any lag phase, followed by a continuous increase over time. By comparing the skin permeation profiles, it is observed that MG4 (triacetin/Tween 80/PG at Rsm of 2: 1) exhibited the highest cumulative amount of lidocaine permeation versus time after 10 h (5300.705 µg/cm2) and significantly enhanced lidocaine permeation compared to MG5 and the control gel. No statistically significant difference in permeation was found between MG3 and MG4 until 15 min, suggesting that their onset of action could be almost the same. However, higher drug release was observed from MG4, which supports a longer duration of action.
Drug permeation from MG3, MG4, and MG5 systems through abdominal rat skin. Data are shown as means ± SEM (n = 3). The difference between the release percentage of the formulations was statistically analyzed by one-way ANOVA followed by Tukey's post-test (*P < 0.05: significant; **P < 0.01: very significant; and ***P < 0.001: extremely significant, in comparison with the marketed product).
Rapid onset of action for LAs is very important, and therefore, a high initial permeation is immediately required. Cumulative drug release per unit area of skin surface from all formulations after 10, 20, and 60 min demonstrated a significant enhancement of flux in comparison with the commercial gel (P < 0.001), so that for MG4 as the optimized system, 4.09, 3.54, and 1.91-fold increase in the flux were observed, respectively. It is crucial to determine the minimum amount of drug permeation that induces local anesthesia (i.e., the anesthetic threshold). Lidocaine anesthetic threshold was calculated to be 500 μg/cm2, based on the data obtained from in-vitro drug release and in-vivo anesthetic examination (tail-flick test) (8). Considering this value, it could be expected that formulation MG4 causes local anesthesia faster than the other MGBs within 7 minutes after applying the gel. Formulations MG3 and MG5 also induced their effects after 10 - 15 min; however, the amount of drug needed to initiate the anesthetic effect of the commercial gel was released in 30 to 45 min. In general, it is concluded that the faster local anesthesia was achieved by the use of MBGs, compared to the commercially available gel.
An increase in the permeation rate within the first two hours could be explained as follows. Due to the presence of both hydrophilic and lipophilic components and the resulting combined effects, MEs possess a favorable solubilizing behavior. This increases the thermodynamic activity of the drug, which is a driving force for drug release and its penetration (49). Besides, it has been previously reported that topically applied MEs are expected to penetrate the skin and exist intact in the stratum corneum (SC). Kweon et al. have suggested that MEs, once entered into the SC, could alter both the polar and lipid pathways, and the subsequent interaction of the lipid portion of the MEs with the SC makes the dissolved drug partition into the existing lipids. On the other hand, the bilayer structure of the SC could be destabilized by the intercalation of ME droplets between its lipid chains (53). The hydration effect on the drug uptake of the SC by the hydrophilic domain of MEs should also be considered. It is thought that the aqueous phase of MEs would increase the interlamellar volume and disrupt the lipid bilayers due to the swelling of the intercellular proteins, causing a more easily penetration of the drug through the lipid pathway of the SC (53). In conclusion, the greater penetration enhancing the activity of MEs may be attributed to the combined effects of both the lipophilic and hydrophilic domains of microemulsions.
As can be seen in Figure 8, the release of lidocaine molecules from the investigated MBGs (MG3 - MG5) was sustained for 10 h. This phenomenon may be explained by considering the release of the loaded lidocaine from the internal phase, which might act as a drug reservoir, to the external phase and then from the continuous phase to the skin through passive diffusion. Lidocaine can also be partially solubilized in the external phase and interfacial film of ME that can supply fast release at the initial time of study leading to the fast onset of action without any lag time. It has been suggested that the gel formation in ME limits the diffusion of the drug dissolved in the droplets and therefore slows down its release. Thus, one can conclude that MBGs are potentially able to sustain the release of drugs as compared with their fluid systems. Therefore, the high permeation rate of MG4 could be related to its ability to create a high-saturated vehicle which can result in high thermodynamic activity (54).
The particle size of ME droplets plays an important role in percutaneous drug absorption. It has been reported in the literature that by decreasing the droplet size, the number of particles that can interact with the skin surface is probably increased (49, 53, 55). In this investigation, the particle size of all ME formulations was in the range of 20 - 52 nm. This suggests that a large surface area for the transfer of lidocaine to the skin is available.
The higher lidocaine flux from formulated MBGs compared to the commercial gel originates from the penetration-enhancing effect of applied components. Cao et al. prepared celecoxib-loaded MBG using Tween 80 and Transcutol® P and evaluated the ex-vivo permeation of the drug into the mouse skin. The results revealed that the interested formulation could have a 4-fold greater permeability than the conventional gel (56). These findings have also been previously obtained by Shakeel et al., using penetration enhancers such as Labrafil®, triacetin, Tween 80, and Transcutol® P for aceclofenac (57). Similarly, other researchers have developed MBGs containing a mixture of Cremophor® EL and PEG 400 as the surfactant phase to co-delivery of evodiamine and rutaecarpine. By application of this nano-based gel formulation, it was shown possible to achieve approximately 2.6-fold higher transdermal flux compared with control hydrogel (58). In general, numerous studies on ME gels prepared with Tween 80 and PG have shown that this surfactant mixture has an important impact on increasing the skin permeability as well as the stability of systems, and it has also been stated that PG can exhibit an additive effect on drug permeation in combination with other penetration enhancers (59).
4.10. Drug Release Kinetics
To determine the kinetics of permeation from these vehicles, the data obtained from ex-vivo permeation experiments were kinetically analyzed according to zero order, first order, Higuchi and Korsmeyer-Peppas models, and the results of data fitting into these models were evaluated by the highest correlation coefficient (R2). Based on the best goodness of fit (see Table 5), it was found that MG3, MG4, and the marketed product were followed Higuchi kinetic model (MG3: R2 = 0.9942, MG4: R2 = 0.9862, marketed gel: R2 = 0.9832). Higuchi model-based permeation, previously reported for indomethacin (chitosan-based), terbinafine (chitosan-based), itraconazole (Lutrol® F127-based) and ibuprofen (Carbopol® 940-based) MBGs and for topical ketoprofen and pentoxifylline MEs (24, 60-64), suggests that the release process could be mainly controlled by the Fickian diffusion of dissolved lidocaine through the gel network of Carbomer® 940. However, the analysis of the release plot for MG5 revealed that lidocaine followed the first-order model for controlled permeation, suggesting that the release rate is concentration-dependent (23, 65).
Models Used to Assess the Release Kinetics from the Best MBGs and the Corresponding Korsmeyer-Peppas Parameters
If diffusion is the main drug release mechanism regarding the Higuchi equation, then a plot of the drug amount released versus the square root of time should result in a straight line. However, a deviation from the Fickian equation may be observed, and the mechanism of diffusion from polymeric dosage forms may follow a non-Fickian behavior. Korsmeyer-Peppas equation (Equation 1) is a more general relationship that describes a mixed mechanism of drug release (polymer swelling and/or diffusion) from a polymeric system:
Where k is a constant incorporating the geometrics and structural characteristics of dosage form, n is the release exponent indicative of the release mechanism, and Mt/M is the fractional release of the drug. This equation relates the drug release to the elapsed time (t). In this study, to elucidate the drug release mechanism, the first 60% of drug release data was used to calculate values of n, k, and correlation coefficient (R2) (Table 5). Values of the release exponent for MG3, MG4, and MG4 formulations and the marketed product were calculated to be between 0.484 and 0.854. Therefore, it was concluded that the mechanism of transport for all these formulations followed an anomalous (non-Fickian) behavior, as described in Table 6, possibly including both diffusion and/or polymer erosion phenomena. These results are in accordance with those reported for zaltoprofen and griseofulvin MBGs (47, 66, 67) and contraceptive vagino-adhesive propranolol HCl gel (68).
| Release Exponent (n) | Release Mechanism |
|---|---|
| n ≤ 0.5 | Fickian diffusion |
| 0.45 < n < 0.89 | Non-Fickian (anomalous) transport |
| n = 0.89 | Case II transport |
| n > 0.89 | Super case II transport |
Interpretation of Diffusion Release Mechanism
4.11. Anesthetic Effect
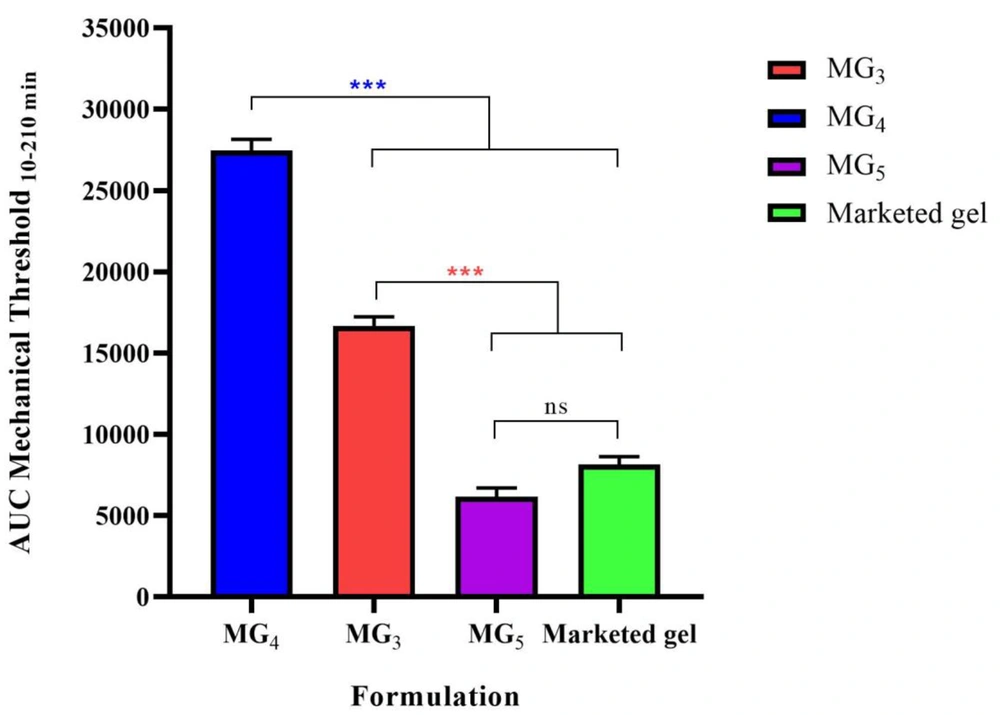
Paw withdrawal threshold (PWT) values of the lidocaine-treated rats were found to be significantly higher than their respective controls, confirming the induction of the anesthetic effect of lidocaine (P < 0.001). Repeated-measure, two-way ANOVA (followed by Bonferroni's post-test) revealed that MG4 formulation showed a markedly greater anesthetic effect in comparison with the marketed gel. This finding supports the results of the ex-vivo permeation test (Figure 10). Also, it was observed that MG3 showed no statistically significant difference in PWT value approximately during the first two hours of the study, and for MG5, the induction of local anesthesia was similar to the marketed gel. In order to compare the average pain threshold during the complete period of observation following the application of the formulations, the area under the time-course curve was calculated. As can be clearly seen in Figure 11, MG4 and MG3 induced a statistically significant high pain threshold in comparison to the commercial product (P < 0.001, one-way ANOVA followed by Tukey's post-test), although the difference was not significant between that of MG5 and the marketed gel.
The area under the curve (AUC10-210 min) of withdrawal threshold time-course of the selected formulations (MG3, MG4, & MG5) to mechanical stimulation (von Frey filaments). Data are shown as means ± SEM, n = 8 rats per group (n = 8). One-way ANOVA followed by Tukey's post-test multiple comparisons were conducted.
4.12. Skin Irritation Test
The irritation potential of any transdermal formulation is a critical factor that could limit its use and patient acceptability. In the present study, special consideration was given to the selection of components used in the formulations on the basis of solubility and the minimal skin irritation tendency. Draize primary skin irritation test was performed on the albino rabbit skin to study the irritability of the optimum formulation. The results obtained from skin irritation studies after 1, 24, 48, and 72 h of the gel application are listed in Table 7. The prepared gels were not found to be skin irritants.
| Group | Primary Irritation Index (Mean ± SEM; n = 3) | |||
|---|---|---|---|---|
| 1 h | 24 h | 48 h | 72 h | |
| No application (control) | 0 ± 0 | 0 ± 0 | 0 ± 0 | 0 ± 0 |
| Blank MG4 | 0 ± 0 | 0 ± 0 | 0 ± 0 | 0 ± 0 |
| lidocaine-loaded MG4 | 0.44 ± 0.11 | 0.22 ± 0.11 | 0 ± 0 | 0 ± 0 |
Average Response Scores of Skin Irritation
5. Conclusion
In the present study, various formulations of lidocaine-loaded MBGs were prepared and characterized. It was concluded that MBGs could be considered as a more promising approach for the transdermal delivery of lidocaine due to their appropriate viscosity and rheological behavior, spreadability, pH, high penetration ability, and skin tolerability with no irritation, high stability, and improvement in PWT and anesthetic effect. However, further research and clinical investigations need to be conducted to elucidate the possible mechanism (s) of lidocaine delivery to the skin and confirm the therapeutic efficacy.

