Reagents
QTF was a gift from “Philadelphia Pharma” laboratories (Sfax, Tunisia); purified oleic acid and Tween® 20 (polysorbate 20) were purchased from Prolabo® (Paris, France); Transcutol® P (diethylene glycol monoethyl ether) was provided by Gattefosse® (Saint-Priest, France). All other chemicals used were of analytical grade.
Formulation and optimization of QTF-loaded SEDDS
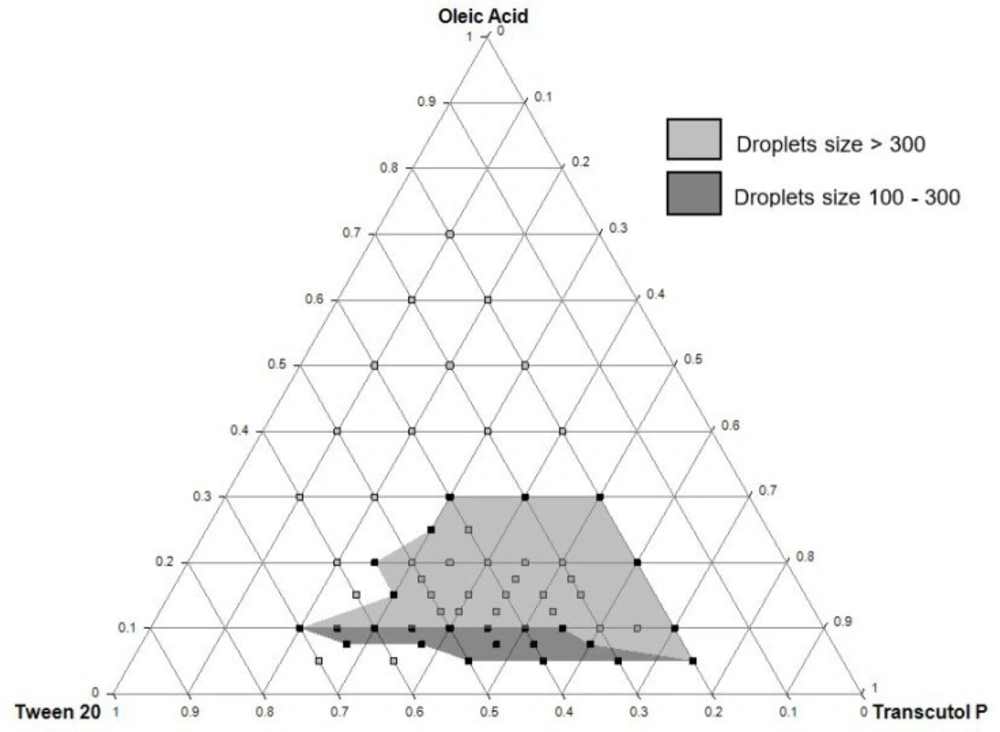
Construction of ternary phase diagram
A ternary phase diagram was constructed to delimit the concentration intervals of components that define the self-emulsifying region. The components of the formulation were selected based on their ability to solubilize QTF. Thus, oleic acid, Tween® 20, and Transcutol® P were used as an oil, surfactant, and cosolvent, respectively.
Oily phase preparation
A series of unloaded SEDDS formulations were prepared by varying the percentage of each component in the preparation and keeping a final sum of concentrations of 100%. The intervals of work for oleic acid, Tween® 20, and Transcutol® P were respectively 5-70%, 20-70%, and 10-75% (m/m). First, oleic acid was introduced into a test tube, then the cosolvent and the surfactant were added successively under vortexing. The mixtures were vortexed for 2 minutes to obtain clear homogenized preparations and were let to stabilize at room temperature.
Self-emulsifying capacity
All the prepared formulations were evaluated for self-emulsifying capacity according to Craig et al. method (
20). Briefly, 50 µL of each mixture was introduced into 50 mL of distilled water preheated at 37 ± 0.5 °C. The preparation was gently stirred at 100 rpm for 5 min using a magnetic hot plate stirrer (IKA
® RH Basic 2). Every preparation was then classified based on its tendency to spontaneous emulsification and its stability. Three grades of self-emulsifying capacity were predefined (
Table 1). The preparations with “good” or “moderate” self-emulsifying capacity were then assessed for droplet size measurement. Only preparations with droplet sizes ranged between 100 and 300 nm were accepted for further studies.
Drug incorporation
QTF loaded-SEDDS were prepared by adding 20 mg of QTF to 1 g of the unloaded formulation. First, QTF was added to the amount of Transcutol® P and stirred using a magnetic stirrer (IKA® RH Basic 2) for 5 min at 50 °C. Then, oleic acid and Tween® 20 were added to the mixture, respectively. The preparation was maintained under stirring for 20 min until the total solubilization of the drug.
The loaded preparations were then evaluated for self-emulsifying capacity, droplet size, and polydispersity index (PDI). Only formulations with droplets size between 100 and 300 nm were accepted for later optimization.
Droplet size measurement
Droplet size and PDI were measured by the dynamic light scattering method using a Nanosizer® instrument (Nano S, Malvern Instruments, UK). The preparations were measured directly after reconstitution. All measurements were repeated three times (n = 3). Results were expressed as mean ± SD.
Optimization of QTF-loaded SEDDS using D-optimal mixture design
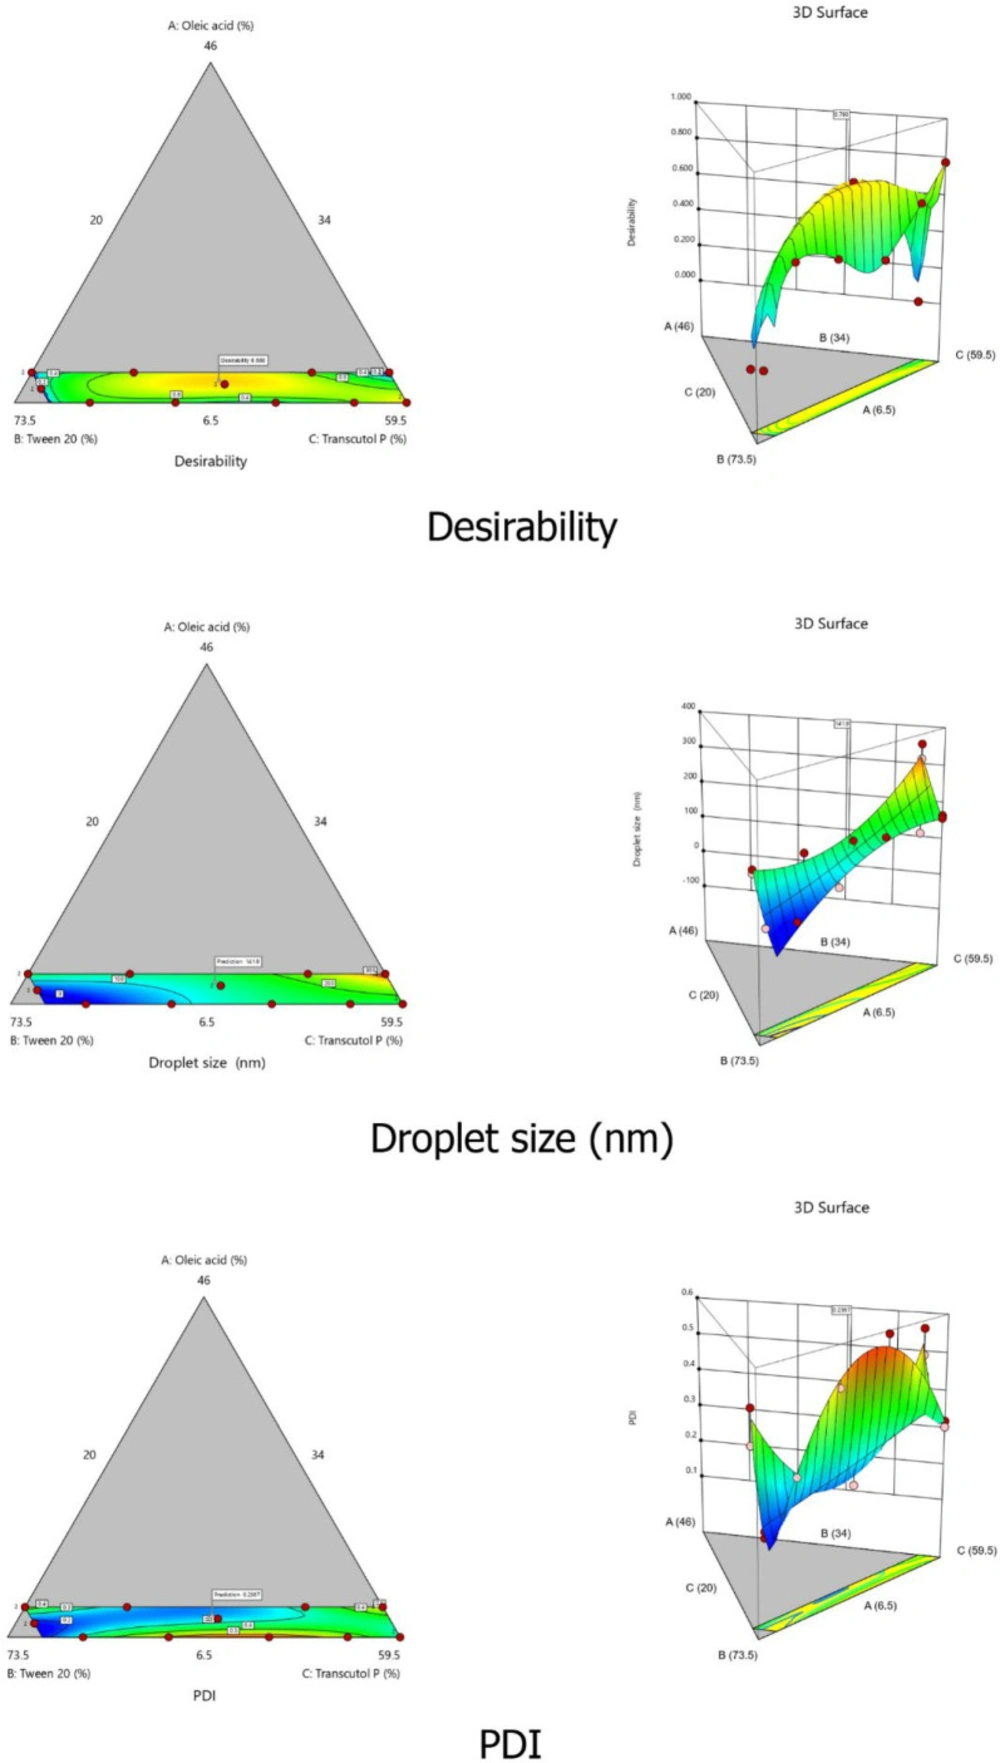
To optimize the SEDDS composition, a D-optimal mixture design was employed. This design was selected for its property to variate the proportion of each factor without changing the total sum of components (100%). In our case, the percentages of each component were defined as the independent variables of the design: oleic acid (oil% w/w; X1), Tween® 20 (surfactant%w/w; X2), and Transcutol® P (cosolvent% w/w; X3). The low and high levels of each independent variable were fixed based on the ternary phase diagram results. Mean droplets size (Y1) and PDI (Y2) were selected as responses to evaluate and optimize SEDDS characteristics. The Design Expert® (Version 10, Trial version, Stat-Ease Inc., Minneapolis, MN, USA) software was employed for the statistical analysis. The software generated sixteen experimental runs that were prepared as described previously and assessed for both responses Y1 and Y2.
The polynomial equations of each response were provided by Design Expert
® software after data processing using analysis of variance (ANOVA). The selection of the best fitting mathematical models was based on the comparison of several statistical parameters such as sequential
p-value, lack of fit
p-value, squared correlation coefficient (R
2), adjusted R
2, predicted R
2, and the predicted residual sum of square (PRESS). PRESS indicates how well the model fits the data. The selected model must have the smallest PRESS value compared to the other models under consideration (
21,
22). Finally, the optimization of the three independent variables for both responses was accomplished by using the desirability function of the Design Expert
® software.
Optimal QTF-loaded SEDDS characterization
The optimal QTF-loaded formulation was prepared and reconstituted as described above. The reconstituted formulation was characterized for droplet size, PDI, zeta potential, and percentage of transmittance.
Droplet size and PDI measurement
Droplets size determination was assessed using the dynamic light scattering method using a Nanosizer® (Nano S, Malvern Instruments, UK). Results were expressed as mean ± SD of three repetitions (n = 3).
Zeta potential measurement
The zeta potential value was determined by the dynamic light scattering technique using a Zetasizer® (Nano Z, Malvern Instruments, UK). The measurements were run in triplicate, and results were expressed as mean ± SD.
Transmittance
The transmittance percentage was measured using a UV-Visible spectrophotometer (Evolution 60, Thermo Scientific) at λ = 650 nm to evaluate the transparency of the optimal SEDDS formulation. Purified water was used as the reference. Results were expressed as mean ± SD of three measurements (n = 3).
Stability study
To assess the stability of the optimal SEDDS formulation, three different assays were performed on both oily and reconstituted preparations. The formulations were evaluated under accelerated conditions such as centrifugation and freeze-thaw cycles and under normal storage conditions for one month.
Stability to centrifugation
One and half milliliters of the oily phase or the reconstituted preparation were introduced into an Eppendorf tube and centrifuged at 10000 rpm for 15 min. The preparations were then inspected visually for the presence of precipitate of the drug, phase separation, or other visual instabilities.
Stability to Freeze-Thaw cycles
Four milliliters of the oily phase or the reconstituted preparation were introduced into a hemolysis tube. Samples were then subjected to 3 freeze-thaw cycles of 48 h each, alternating 24 h at -10 °C and 24 h at room temperature. The preparations were then examined visually.
Stability under normal storage conditions
The optimal SEDDS oily preparation was stored at room temperature for 30 days. Then, it was reconstituted (50 μL in 50 mL of distilled water at 37 °C) and checked for droplet size, PDI, and zeta potential.
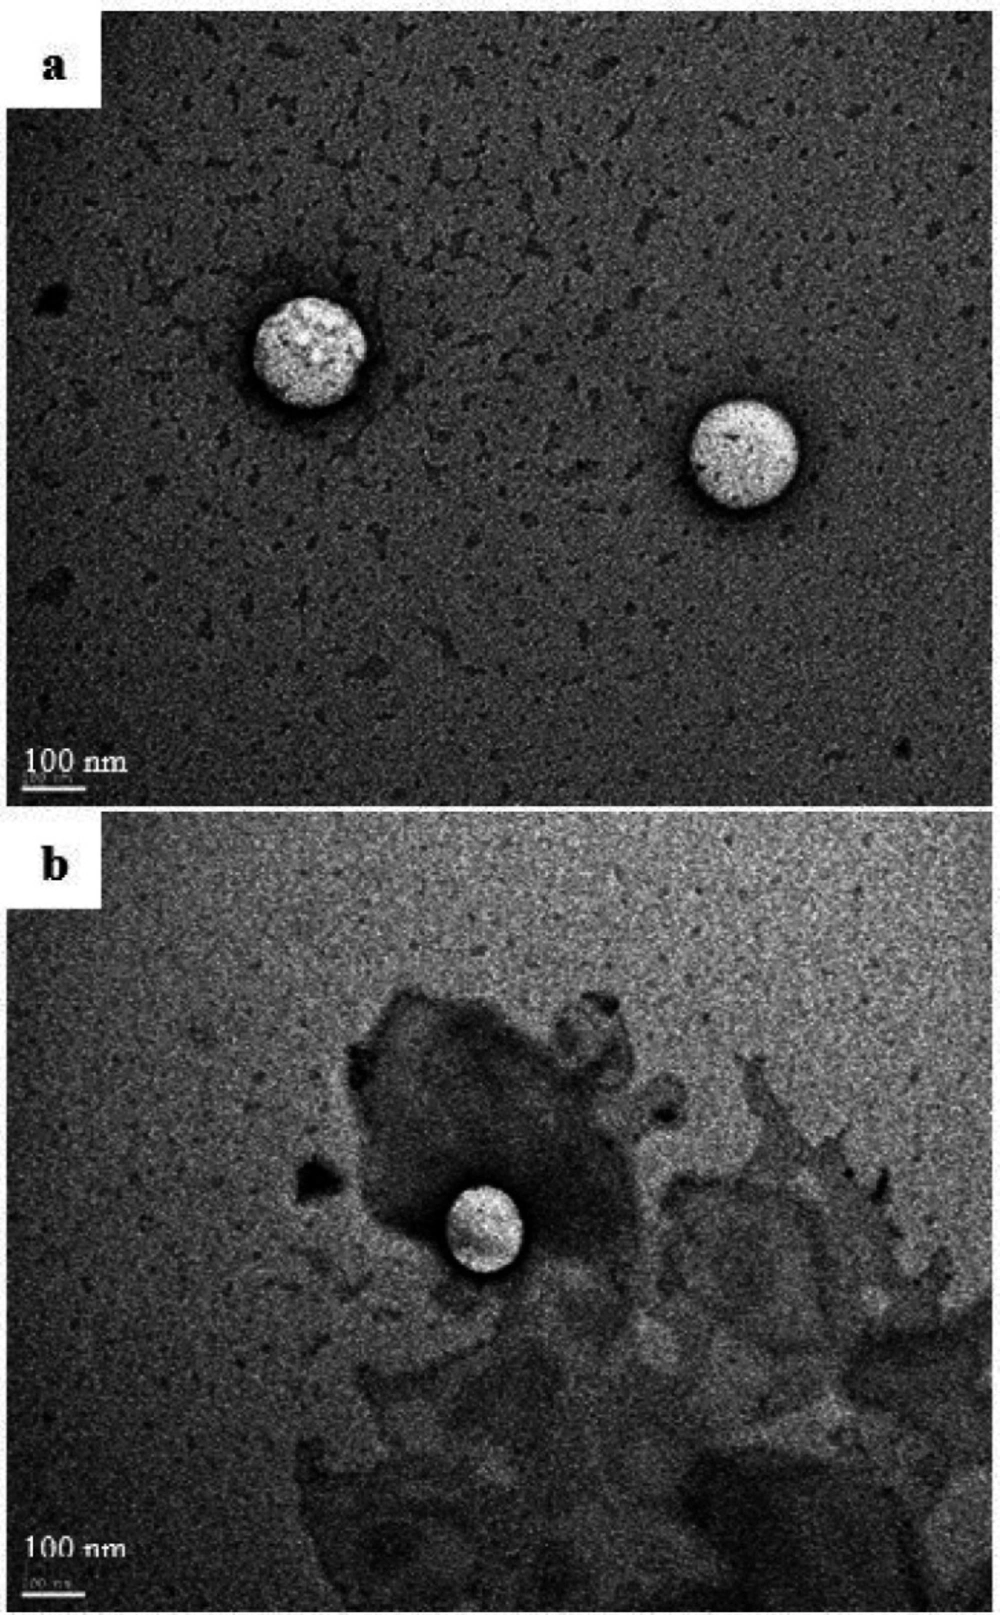
Transmission electron microscopy (TEM)
The morphology of the oily droplets of the reconstituted optimal formulation was investigated by transmission electron microscopy. The SEDDS formulation was diluted 1000 times in preheated distilled water (37 °C) under magnetic stirring. After 15 min, a sample of 10 µL was withdrawn and placed on a copper-mesh grid and let to stand for 2 min. The excess was then removed by adsorbing on a filter paper. Ten microliters of 1% uranyl acetate solution were added to the grids for contrast and let to stand for 5 sec before removing the excess. The sample was observed using a JEM-1400 Transmission Electron Microscope (JEOL Ltd., USA).
For the QTF release mechanism study, the reconstituted formulation was kept under magnetic stirring (Ika® RH basic 2 hot stirring plate, Germany) for 60 min at 37 °C. Then, another sample was withdrawn, prepared as described above, and observed under TEM for eventual morphologic modifications.
Dissolution and permeation studies
To study the release profile and the permeation behavior of QTF from the optimal SEDDS formulation, a combined dissolution, and permeation assay was designed and conducted using a rat Everted Gut Sac (EGS) permeability technique and USP dissolution apparatus I (Basket apparatus) method.
Animals
Male Wistar rats (200-250 g) aged between 8 and 12 weeks were used for the permeability study. Animals were purchased from the Central Pharmacy of Tunisia (Tunis, Tunisia) and were kept in standard environmental conditions in polypropylene cages at a controlled temperature (22-24 °C) with 12 h of light/dark cycles. They had free access to food and water. Before the experiment, the rats have fasted for 24 h with free access to water.
All experiments were performed according to the guidelines of the European Union on Animal Care (CCE Council 86/609).
In-vitro dissolution and permeation studies using rat Everted Gut Sac model
The EGS technique was conducted according to the method of Lassoued
et al. (
23,
24). Before the experiment, the fasted rats were anesthetized using ether. Then, a 3 cm incision was made in the abdomen of the rat. The jejunum was located, separated from the rest of the intestine, and cut into segments of approximately 6 cm in length. After the extraction of the intestine, the rat was immediately euthanized by over-exposure to ether. The intestine segments were rapidly incubated in an oxygenated (O
2/CO
2, 95%: 5%) Tyrode buffer solution (containing in mM: 15 glucose, 11.90 HCO
3Na, 136.9 NaCl, 4.2 NaH
2PO
4, 2.7 KCl, 1.2 CaCl
2 and 0.5 MgCl
2) at 37 ± 0.5 °C. The sacs were washed three times with Tyrode solution, stripped of adhering tissues, and carefully everted over a thin cannula. One extremity of each sac was ligated with a silk thread, and the other extremity was tied to a small cannula allowing to fill the sac with Tyrode solution.
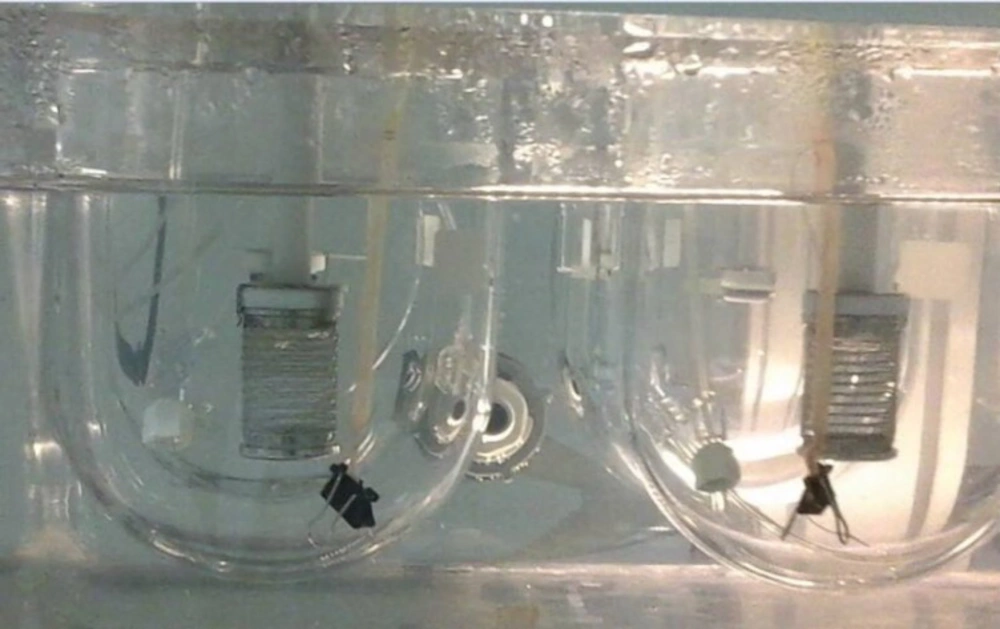
Each everted sac was filled with 500 µL of Tyrode buffer solution (Receiver compartment; pH 7.4) using a 1 mL syringe, and carefully hung into the dissolution apparatus recipient (basket apparatus ERWEKA GmbH, Heusenstamm, Germany) containing 900 mL of distilled water preheated at 37 ± 0.5 °C and oxygenated using perfusion tubes (O
2/CO
2, 95%: 5%). Small clumps were attached to the free end of the sacs to keep them submerged in the liquid in a vertical position (
Figure 1). The optimal SEDDS formulation or the free QTF, equivalent to 50 mg of Quetiapine free base, were then added to the dissolution medium (Donor compartment) and stirred at 100 rpm.
At regular time intervals (10, 20,30,40,50, and 60 min), 3 mL aliquots were withdrawn from the donor medium and filtrated through a 0.1 µm nitrocellulose membrane. Simultaneously, an intestinal sac was removed, and its content was collected into an Eppendorf tube and centrifuged at 14 000 rpm for 10 min. The amount of drug in each sample was analyzed after suitable dilution, using a UV-Visible spectrophotometer (Evolution 60, Thermo Fisher Scientific) at 220 nm.
Results were expressed as mean ± SD of 6 repetitions (n = 6) for the in-vitro dissolution assay and as mean ± SD of 3 repetitions (n = 3) for the permeability assay.
Apparent permeability calculation (Papp)
The apparent permeability coefficient (P
app) was calculated as follows (
23,
25) :
Where Papp (cm/s) is the apparent permeability coefficient, dQ/dt (μg/s) is the amount of drug absorbed by unit of time, A (cm2) is the surface area available for permeation, and C0 (μg/mL) is the initial concentration of QTF in the donor compartment.
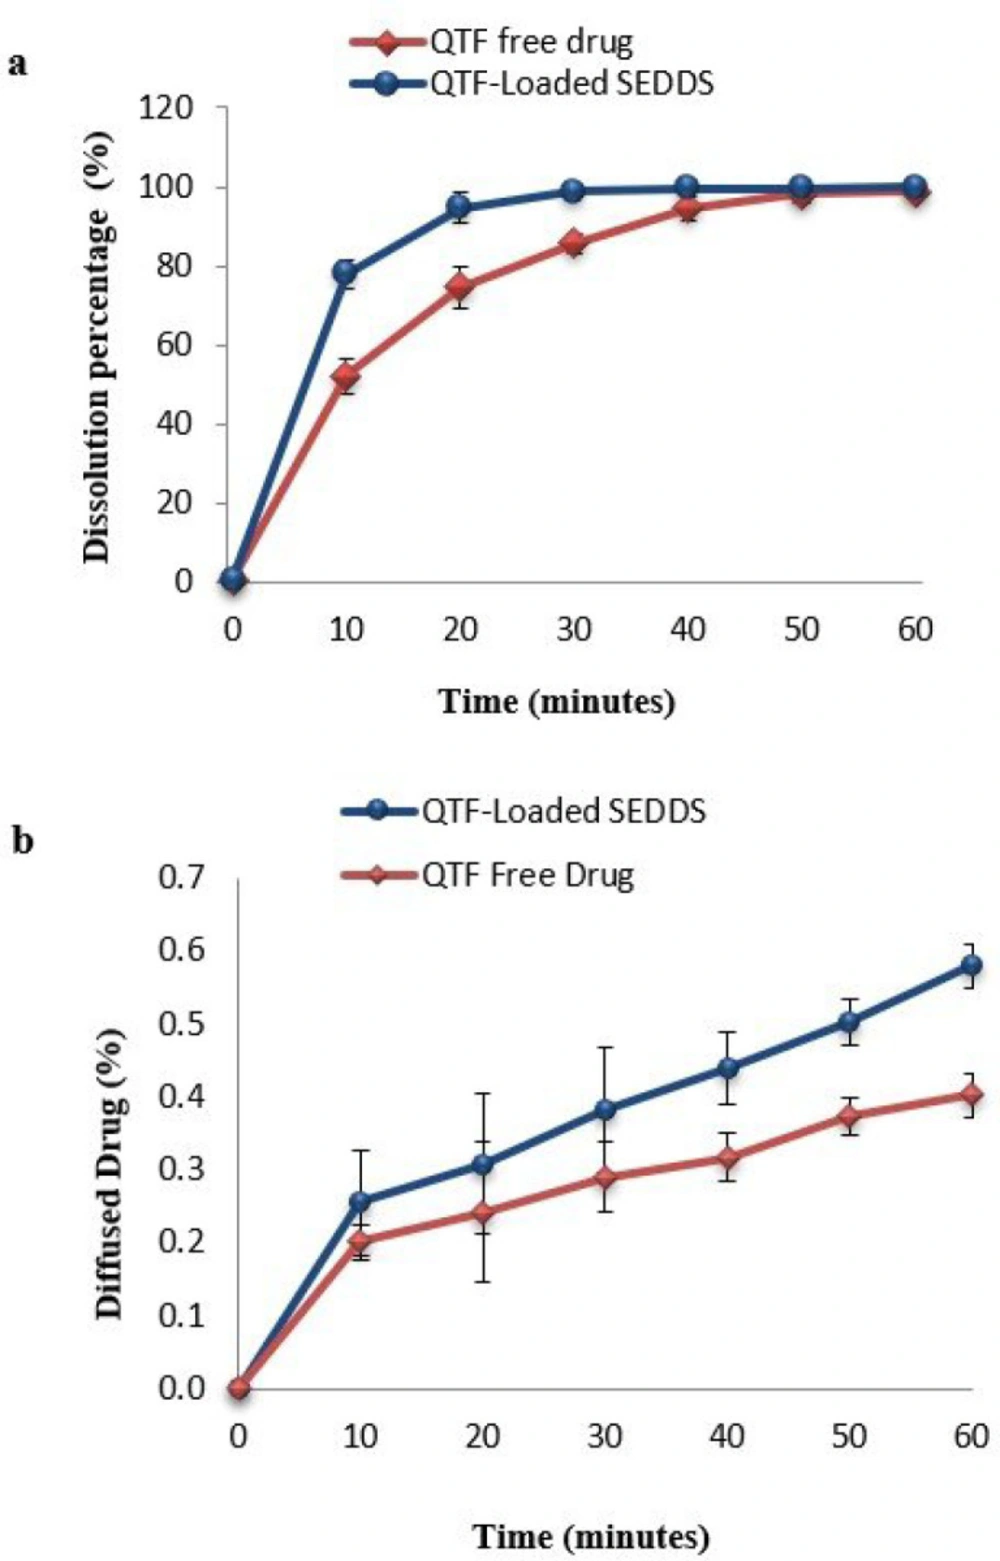
Dissolution and diffusion profiles study
The dissolution and diffusion profiles of both free drug and optimal formulation were compared using the model-independent mathematical approach using difference factor (
f1) and similarity factor (
f2), proposed by Moore and Flanner (1996) (
26):
Where Rt and Tt are the percentages of drug released or diffused of the reference or the test formulation, respectively, at time t; and n is the number of time points.
The difference factor (f1) calculates the percentage of the difference between the two curves at each time point. It is a measurement of relative error between both curves. The similarity factor (f2) is a logarithmic reciprocal square root transformation of the sum of squared error. It represents a measurement of the similarity in the released percentage between the two curves. Two curves were considered similar when the f1 value was less than 15%, and the f2 value was greater than 50% curves.
Mathematical Modeling of drug release kinetics
The in-vitro dissolution data of optimal formulation was fitted to various release kinetic models (zero-order, first-order, Higuchi, Korsmeyer-Peppas, Weibull, and Hopfenberg models) to provide an insight on the drug release mechanism. The model-fitting analysis was accomplished using DDsolver®, a Microsoft® Excel® add-in program to model and compare drug dissolution profiles. The following equations were used for the explored models:
Where is the amount of drug dissolved in time t, is the initial amount of drug in the solution, is the fraction of the drug released at time t, k is the release rate constant, n is the release exponent, is the time required to dissolve 63,2% of the drug, β is the shape parameter, C0 is the initial concentration of the drug, a0 is the initial radio of a sphere or a cylinder or half-thickness of a slab, and n has a value of 1, 2 and 3 for a slab, cylinder and sphere, respectively.
The adjusted coefficient of determination (R
2adj) was used to assess the fit of the models’ equations (
27). It is calculated using the followed equation:
Where n is the number of dissolution data points p is the number of parameters in the model.
The best model is the one with the highest R2adj value. The Akaike’s information criterion (AIC) described by the equation below was also examined to ensure the model’s suitability. The smaller the AIC, the better the model adjusts the data.
Where n is the number of data points, WSS is the weighted sum of squares, and p is the number of parameters in the model.
Statistical analysis
Statistical analysis of the dissolution and the permeability studies was conducted using Microsoft Excel 2010 software. The Student’s t-test was used to evaluate the significant differences. A significant difference was considered when the p-value was ≤ 0.05.