Chemistry
Identification of the chromone
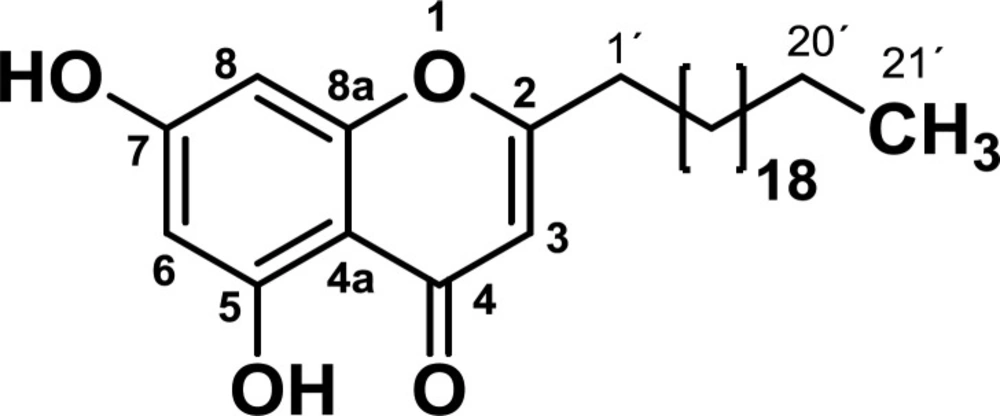
The IR spectra showed absorption bands for phenolic, carbonyl, aromatic and aliphatic groups. Analysis of the NMR spectra suggests that the isolated compound has a core of chromone (see spectroscopic data). The mass spectra showed molecular ion [M+H] of 473, corresponding to the molecular weight of 472 g/mol and elemental formula of C
30H
48O
4. The analysis of NMR and MS data led to determine that the structure of the compound corresponded to the 2-heneicosyl-5,7-dihydroxy-4H-chromen-4-one (
Figure 1). This compound has already been isolated from the roots of Antidesma
Membranaceum species (family
Phyllanthaceae) (
17), the stems of
Polygonum aubertii Henry (
18) and the rhizomes of
Dioscorea septemloba (
19), but this is the first time it is reported in the genre
Bomarea.
2-heneicosyl-5,7-dihydroxy-4H-chromen-4-one: IR (KBr, cm-1): ν max 2917 (C-H), 1657 (C=O), 1633 (C=C), 1588 (C=CAr), 755 (C-HAr). 1HNMR (CDCl3-CD3OD, 300 MHz): δ 0.85 (3H, t, J = 6.8 Hz), 1.11-1.46 (36H, m), 1.60-1.76 (2H, m), 2.56 (2H, t, J = 7.6 Hz), 5.98 (H3, s), 6.22 (H8, d, J = 2.1 Hz), 6.31 (H6, d, J = 2.1 Hz), 12.57 (OH). 13C NMR (CDCl3-CD3OD, 75 MHz): δ 14.2 (CH3), 23.0 (CH2), 27.1 (CH2), 29.3 (CH2), 29.5 (CH2), 29.6 (CH2), 29.8 (CH2), 30.0 (12 CH2), 32.2 (CH2), 34.5 (CH2), 94.6 (C8), 99.5 (C6), 104.7 (C4a), 107.6 (C3), 158.9 (C8a), 162.0 (C5), 164.6 (C7), 171.3 (C2), 183.1 (C = O). HMBC correlations: 21’ (20´, 19´), 20’ (19´, 18´), 2’ (1´, 2), 1’ (2´, 2, 3), 3 (4, 2, 4a, 1´), 6 (5, 4a, 8), 8 (7, 8a, 6, 4a). MS: m/z 473 (M + H).
Biological activity
Chemoprevention, a strategy that is based on the use of natural, synthetic or biological agents which could reverse, suppress or prevent either the initial phases of carcinogenesis or the progression of premalignant cells into invasive disease, has markedly increased the interest in understanding the biology of carcinogenesis in order to identify molecular targets to disturb this process (
20,
21). Because of this, the use of different synthetic or natural compounds has emerged as a promising strategy in medicinal chemistry to discover new compounds that could be potential candidates in chemoprevention (
22). The aim of the present study was to evaluate the effect of
Bomarea setacea and the chromone in the modulation of the viability of human adenocarcinoma colon cells with respect to changes in cell cycle, mitochondrial membrane potential, ROS production and some apoptotic proteins since modulation in these processes are key hallmarks of colon cancer (
23,
24).
Growth inhibitory effect of ethanol extract of Bomarea setacea and the chromone on SW480, SW620 and CHO-K1 cells
To assess the growth inhibitory effect, both the ethanol extract and the chromone were tested
in-vitro against CHO-K1 cell line, colorectal cancer SW480 cells and its metastatic derivative SW620, through the sulforhodamine B assay. Results were reported as 50% inhibitory concentration (IC
50 values) and data are summarized in
Table 1. According to the results, after 48 h of treatment, the ethanol extract did not exhibit activity against the evaluated cell lines (IC
50 >10 mM), on the other hand, although the chromone was not as active as the reference drug (chromone: IC
50/
SW480 = 0,100 ± 0.006 mM, IC
50/SW620 = 0,115 ± 0.019 Mm; 5-FU: IC
50/
SW480 = 0,042 ± 0,006, IC
50/SW620 = 0,080 ± 0,027), it displayed better selectivity, being 156-fold more selective against SW480 cells (SI => 100) and 255-fold against SW620 cells (SI => 86,9).
Antiproliferative effect of Bomarea setacea and the chromone on SW480 and SW620 cells
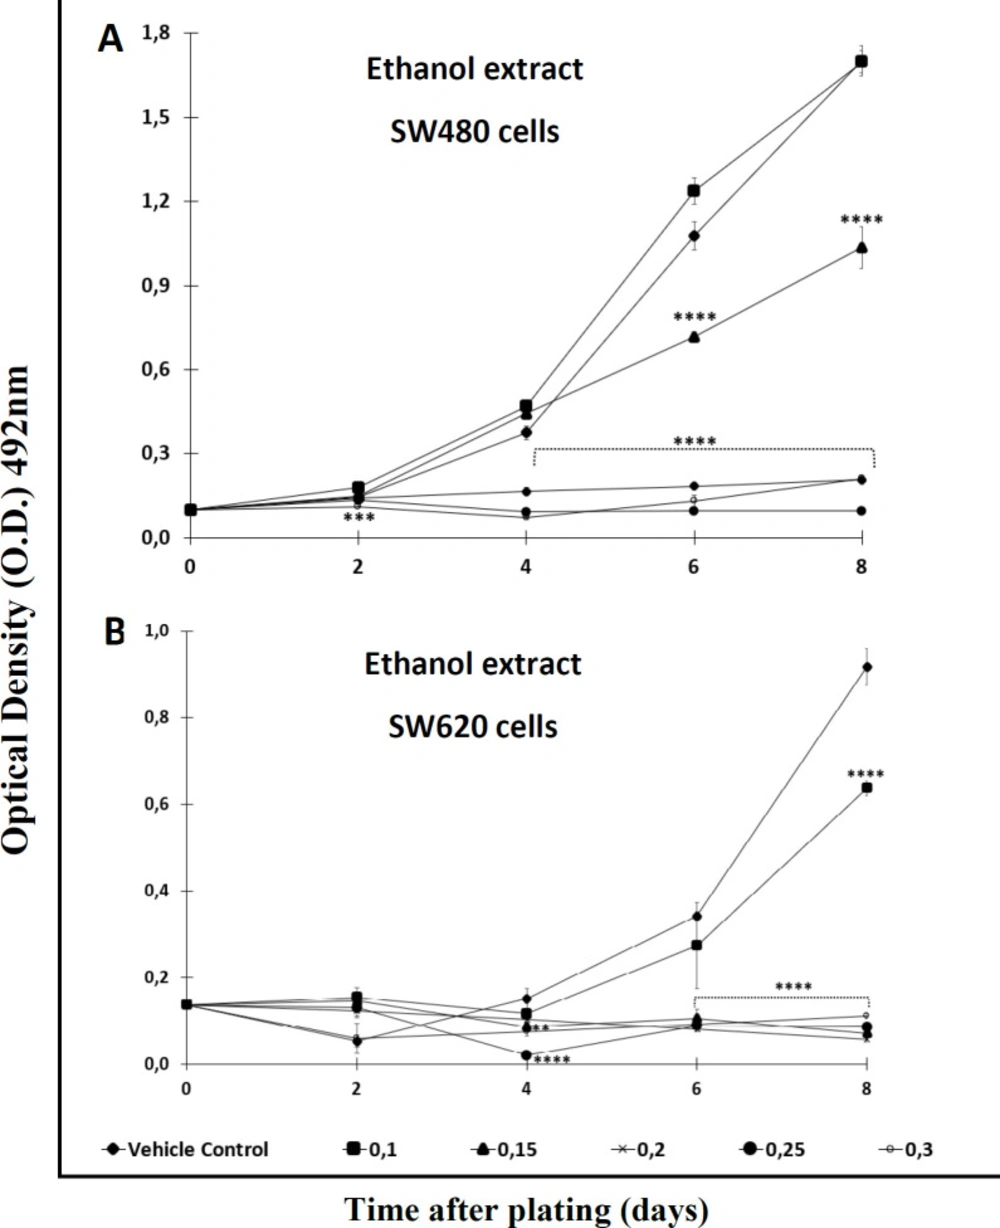
With the aim of testing the antiproliferative effect of the extract and the Cromone, both compounds were analyzed over a longer period of time. After comparing each treatment with the control, the results indicated that the activity was time- and concentration-dependent. Among the results, it was observed that the ethanol extract required high concentrations (>0,2 mM) to display significant antiproliferative activity against SW480 cells after 2 days of treatment. Besides, this extract required a longer period of time (4 days or upper) to exert effect against the metastatic derivative SW620 (
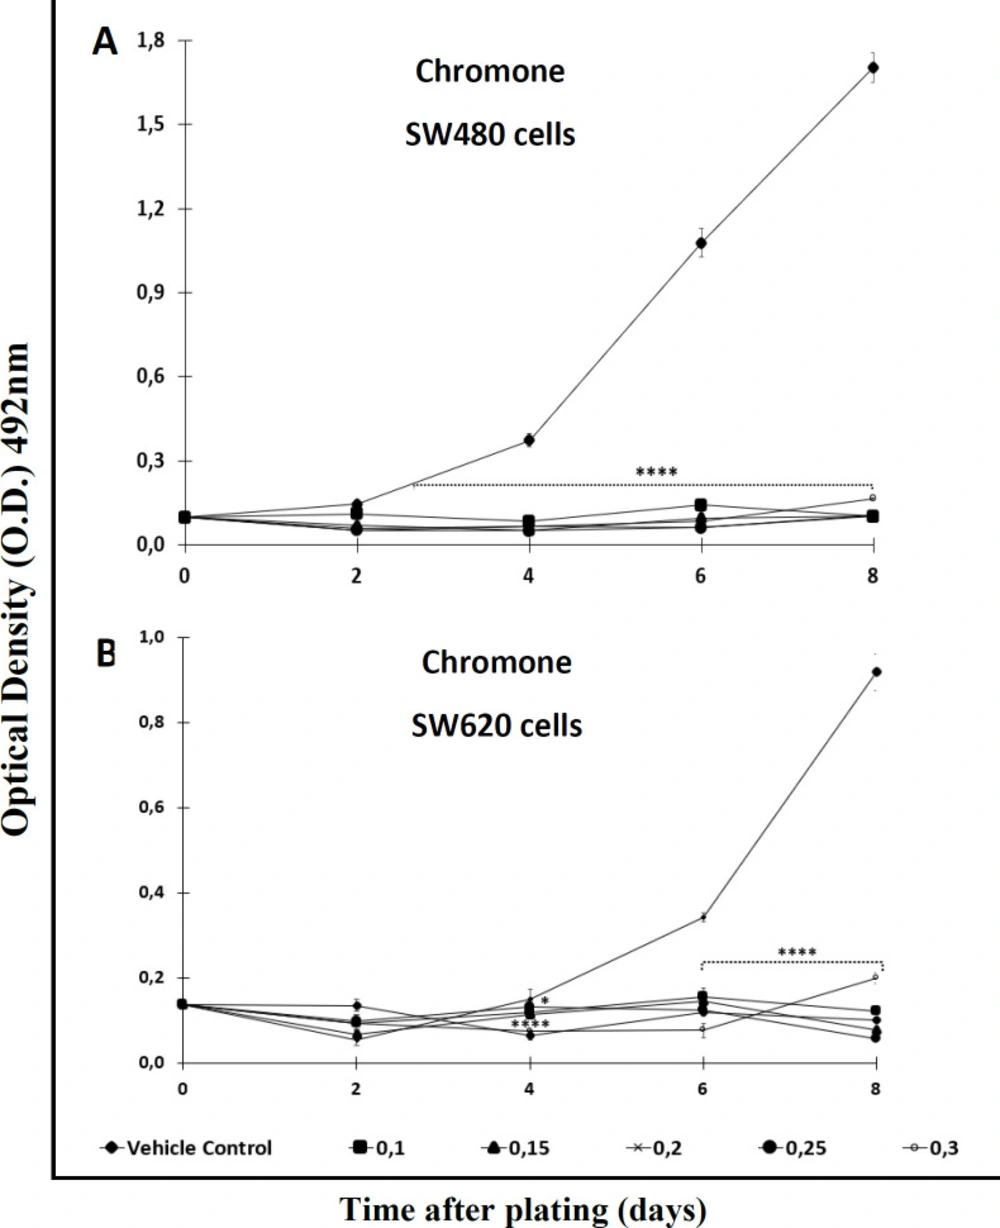
Figures 2A and 2B). On the other hand, the chromone displayed significant antiproliferative activity from day 2 onwards when tested against SW480, even at the lowest concentration evaluated (
Figure 3A); however, like the extract, this secondary metabolite required more than 4 days to have significant antiproliferative activity against SW620 cells (
Figure 3B) (
p ≤ 0.05). In addition, when treated cells were observed with the optical microscope, the cellular morphology was severely perturbed, exhibiting changes in size and shape after treatment.
Effect of the chromone on cell cycle distribution of SW80 and SW620 cells
The accumulation of mutations in tumor cells contributes to changes in cell cycle distribution, which lead to the proliferation of malignant cells (
25). Thus, modulation of this event is seen as a possible target of action in the search for compounds with antitumor activity (
26). Because of this, since the chromone exhibited important
in-vitro growth inhibition and antiproliferative activity, it was further evaluated to determine the effect on the cell cycle distribution of SW480 and SW620 cells. They were treated for 48 h with the mean of the IC
50.
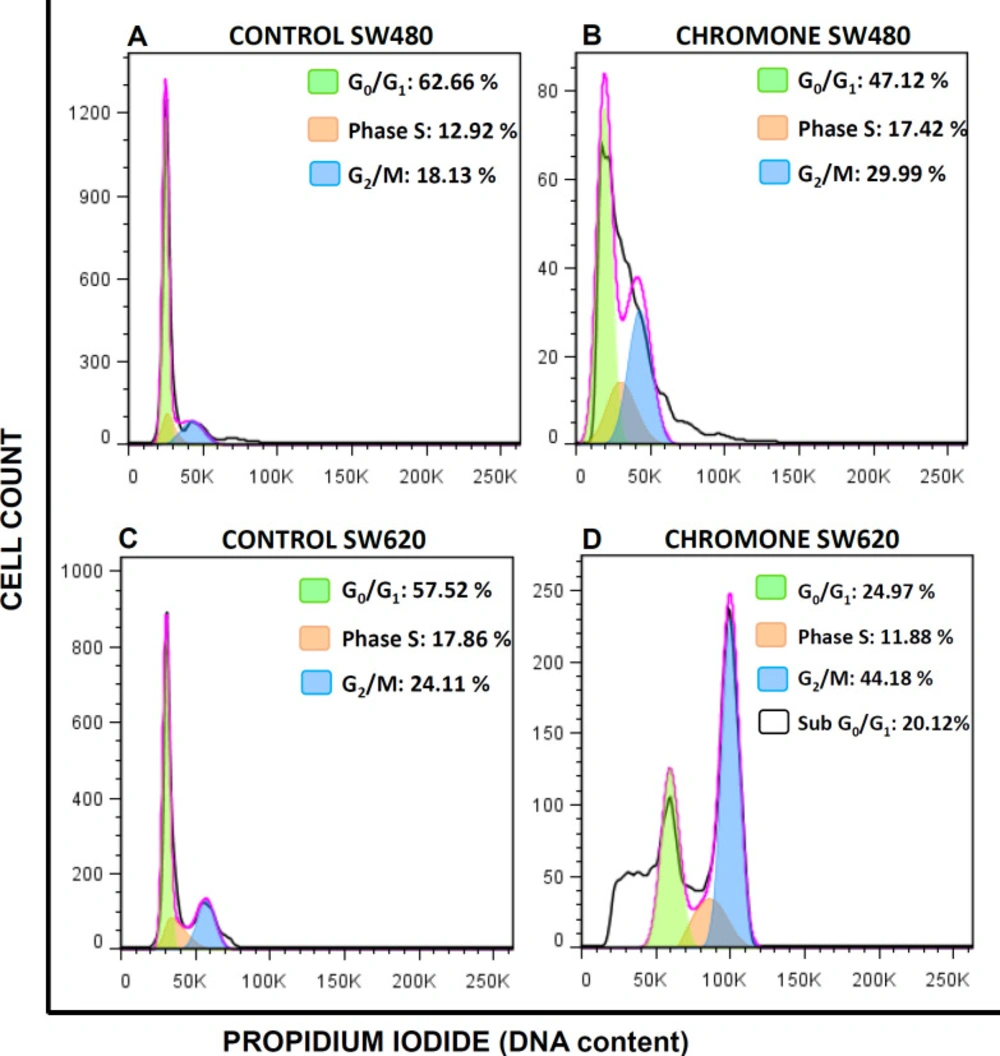
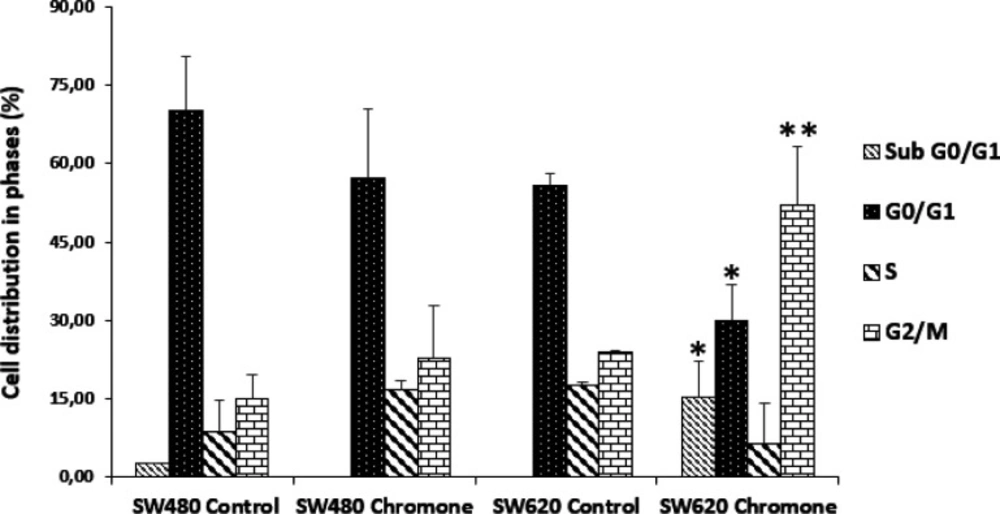
Figure 4 shows the different peaks for each phase of the cycle distribution of SW480 and SW620 cells after treatment. The highest peak represents the cells in G0/G1 phase; the middle region indicates the population in the S phase of the cycle and the final peak on the right represents the cells in the G2/M phase. All results were compared with the control group (SW480: G0/G1 = 62.66%; S = 12.92%; G2/M = 18.13%; SW620: G0/G1 = 57.52%; S = 17.86%; G2/M = 24.11%). According to the results with SW480 cells, the chromone slightly increased the number of cells in the S phase (17.42%) and G2/M (29.99%), with a decrease in G0/G1 (47.12%); however, these changes were not significant (
Figure 5).
On the other hand, the results in SW620 cells showed a significant arrest in G2/M (44.18%) with a consequent reduction in G0/G1 (24.97%). Besides, in this metastatic cell line, there was an important population of cells in the subG0/G1 phase, indicating that the chromone induces cell death in this cell line at the conditions evaluated. Similar results were reported by other authors with different chromones. Huang et al. reported in 2009 a series of chromone derivatives with the antiproliferative activity of SW480 and MDA-MB-435s (mammary adenocarcinoma) cells, with dose-dependent effect in G2/M phase after 48 h treatment (
27). On the other hand, Mahdavian and colleagues showed that a fusarochromanone produced by a fungus induced antiproliferative effect of SRB12-p9 (malignant skin SCC cells), increasing the fraction of cells in the G2/M phase, probably through an effect on the transition from G2 to mitosis (
28). Finally, Tsui and others showed that capillarisin, an active chromone of Artemisia capillaris root extracts, displayed an inhibitory effect of human prostate cancer cells (DU145 and LNCaP) through arrest at the G0/G1 phase (
29). All these findings suggest that the chromone moiety could be an important scaffold in anticancer drug discovery.
Changes in ΔΨm induced by the chromone
Since mitochondria play key roles in activating apoptosis (
30-
32), and due to the previous results of viability and antiproliferative activity of the chromone, we evaluated the ability of this metabolite to induce changes in the ΔΨm that could cause mitochondrial dysfunction of SW480 and SW620 malignant cell lines. After 48 h of treatment with the chromone or DMSO/Ethanol 1% (1:1; vehicle control), SW480 and SW620 cells were stained with the carbocyanine dye DiOC6 and propidium iodide (PI) and analyzed by flow cytometry. DiOC6, a fluorescent dye that accumulates in mitochondria due to its large negative membrane potential, is released to the cytosol after a membrane depolarization (membrane with reduced ΔΨm), staining intracellular membranes (
15,
16).
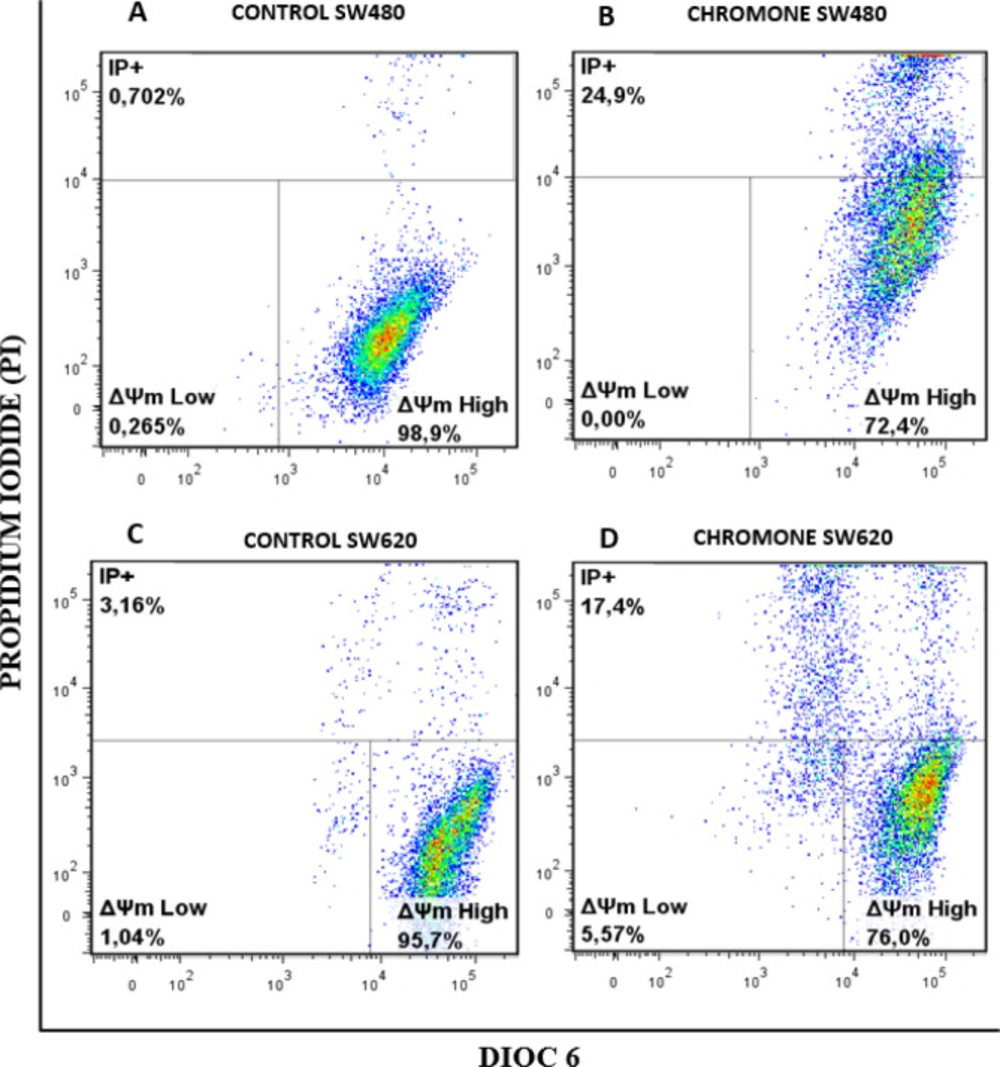
Figure 6 shows the results for the ΔΨm. The right lower quadrant (ΔΨm High) indicates the amount of live cells with high membrane polarization. The left lower region (ΔΨm Low) and the upper quadrant (PI+) indicate cells in latency that lose membrane polarization, with membrane damage and dead cells.
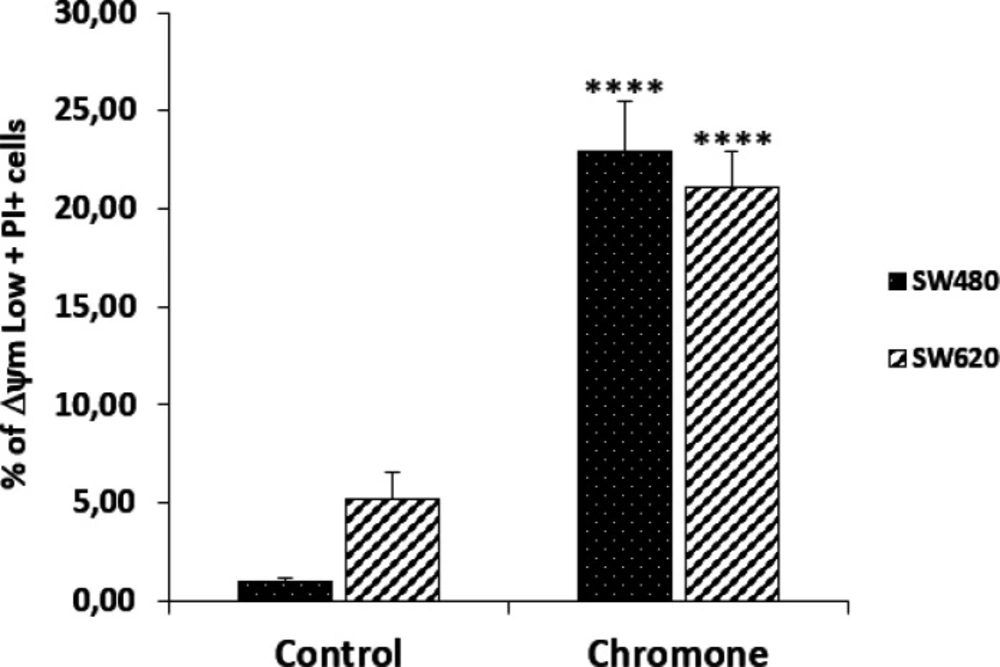
According to the results, the chromone caused a significant loss in mitochondrial membrane potential, as shown in the population with ΔΨm High (SW480 = 72.4%; SW620 = 76%) regarding the control group (SW480 = 98.9%; SW620 = 95.7%). Besides, this chromone significantly increased the population with positive staining for PI in SW480 and SW620 cells (24.9% and 17.4%, respectively). Cells in latency together with dead cells are clearly seen in
Figure 7 with their statistical significance. All these results suggest that the chromone evaluated induce damage in cell membrane and death in SW480 and SW620 cells at the conditions tested.
Determination of ROS
The formation of radical oxygen species (ROS) is a normal process in the body, regulated by different antioxidant systems. This is an equilibrated activity for maintaining low doses of these molecules to preserve their physiological functions since they regulate a variety of cellular signaling pathways, among them, proliferation, migration, cell cycle progression, differentiation, and cell death. When ROS quantity dramatically increases due to an imbalance between production and elimination, there is an association with oxidative stress and signal transduction, which causes damage to membranes, lipids, nucleic acids, proteins and organelles, leading to activation of cell death processes, such as apoptosis (
33-
35). Because of this, since the chromone induced important damage to cells in the previous mitochondrial membrane potential test, we evaluated it in order to determine if it induces oxidative stress that could be associated with this mitochondrial damage. We used the indicator CM-H2DCFDA to know the effect on the production of radical oxygen species (ROS). It is a non-fluorescent dye that passively diffuses into cells, where the acetate groups are cleaved by intracellular esterases. Subsequent production of ROS induces oxidation, producing a fluorescent compound that is trapped inside the cell. After measured the fluorescence intensity of CM-H2DCFDA through flow cytometry, we did not observe changes in ROS production (data not shown) after treatment with the chromone, suggesting this molecule does not act as an antioxidant or prooxidant agent. Similar findings were reported by Yasser
et al. (
36), who evaluated the antioxidant effect of a different chromone using a cellular lipid peroxidation antioxidant activity (CLPAA) in HepG2 cells.
Effect of the chromone on the expression of apoptotic biomarkers
Deficient apoptosis is often associated with numerous human cancers; thus, regulation of apoptotic cell death by targeting antiapoptotic and proapoptotic proteins is an important strategy for anticancer drug discovery that is needed to find more selective agents able to increase efficacy and reduce side effects. The apoptotic pathway involves the sequential activation of caspases, a family of proteases classified as an initiator (caspase-8 and -9) or executioner caspases (caspase-3, -6, and -7). Among them, caspase 3 is considered one of the most important and its activation is a critical step in the pathway leading to cell shrinkage, membrane blebbing and DNA fragmentation, biochemical and morphological changes that underlie apoptosis (
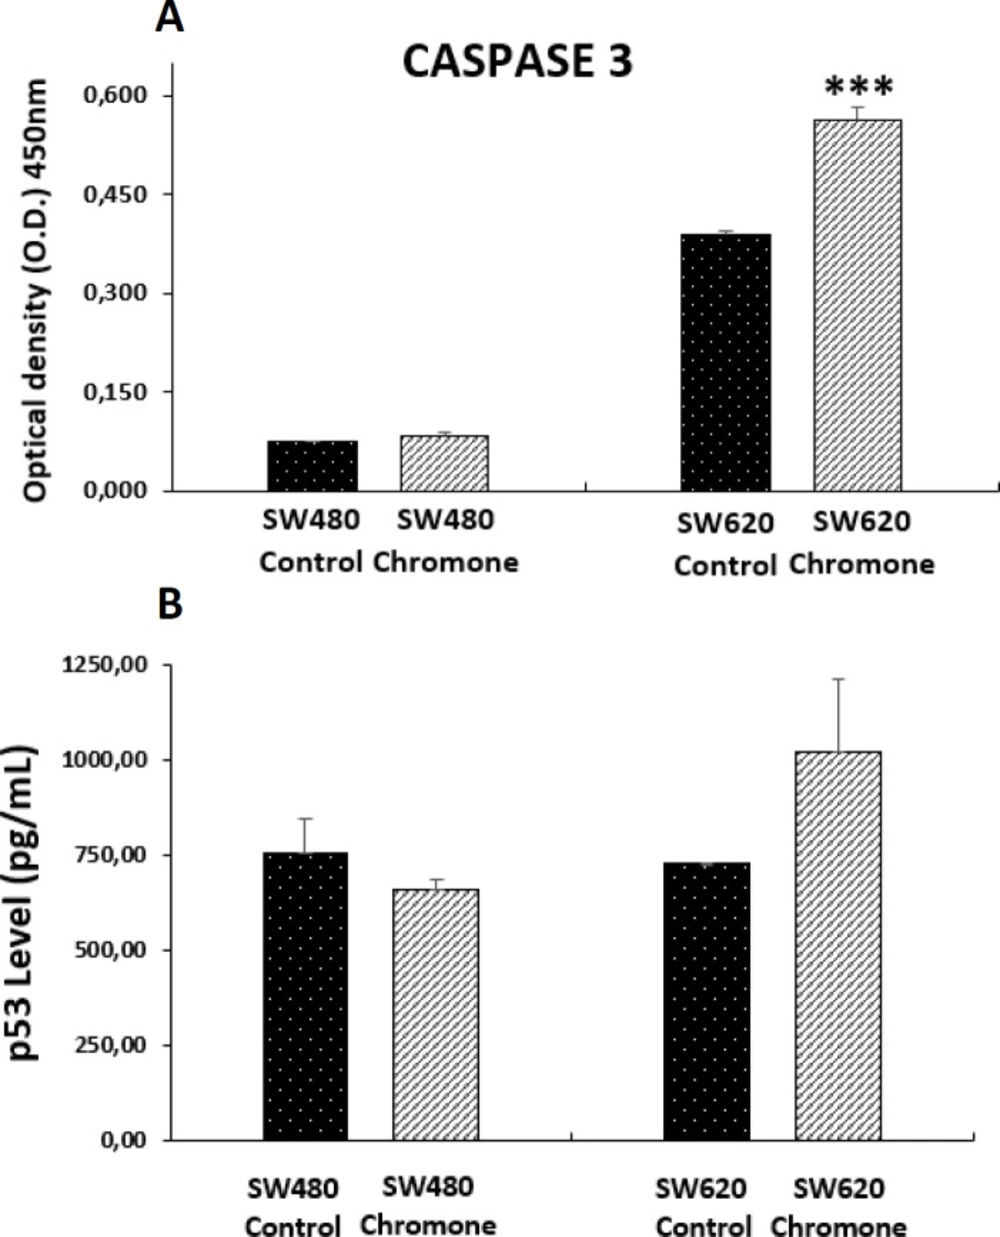
37). Because of this, we tested the effect of the chromone on the levels of the active form of this protease in colon adenocarcinoma cells after 48 h of treatment. We observed that this compound induced a significant increase of cleaved caspase 3 in SW620 cells, suggesting a possible mechanism of apoptosis in an
in-vitro model of CRC (
Figure 8a). Similar results were reported by Mahdavian and colleagues, which demonstrated that another chromone isolated from a fungus (fusarochromanone) induced the cleavage of caspase 3 in MDA-MB-231 breast cancer cells, initiating degradation in the final stages of apoptosis (
28). In addition, given the importance of the tumor-suppressor protein p53 in regulating different cellular processes such as apoptosis (
38), the effect of the chromone on this protein was also tested. Although this protein is mutated in SW480 and SW620 cells, which results in an abnormal protein, other authors have demonstrated that it is possible to activate it both
in-vitro and
in-vivo through different mechanisms (
39,
40), suggesting that p53 retains some of the functions as it maintains residual DNA-binding ability (
39). Because of this, we evaluated this protein in the mentioned colon cancer cells. According to the results, we found that the chromone did not induce the increase in the active form of p53 (
Figure 8b), suggesting a different pathway in the apoptotic process, independent from p53.
Chemical structure of 2-henicosyl-5,7-dihydroxy-4H-chromen-4-one
Antiproliferative effect of ethanol extract of Bomarea setacea against (A) SW480 cells and (B) its metastatic derivative SW620. Data are presented as the mean ± SE of at least three independent experiments (**p < 0.01; ***p < 0.001; ****p < 0.0001). Optical density (O.D.) is directly proportional to cell mass of adherent cells
Antiproliferative effect of the chromone from Bomarea setacea against (A) SW480 cells and (B) its metastatic derivative SW620. Data are presented as the mean ± SE of at least three independent experiments (*p < 0.05; ****p < 0.0001). Optical density (O.D.) is directly proportional to cell mass of adherent cells
Effect of the chromone on cell cycle distribution of (A-B) SW480 cells (C-D) SW620. One representative image of three independent experiments is shown
Cell cycle distribution of SW480 and SW620 cells after treatment for 48 h with DMSO/Ethanol (1:1) or the chromone (0.1075 mM). p-values lower than 0.05 were considered statistically significant (*p < 0.05; **p < 0.01)
Mitochondrial membrane potential (Δ m) in (A-B) SW480 cells and (C-D) SW620 treated with either the chromone or 1% DMSO/Ethanol (1:1) as control, during 48 h. Flow cytometric analysis of cells stained with DiOC6 and PI; Δ m High: live cells with high membrane polarization; Δ m Low and PI+: cells in latency that lose membrane polarization and dead cells, respectively
Representation of data with total Δ m Low plus PI+ cells in bar chart form. Data are presented as the mean of these two populations ± SE of three independent experiments. p-values lower than 0.05 were considered statistically significant (****p < 0.0001).
Level of apoptotic biomarkers in SW480 and SW620 cells 48 h post-treatment with 0.1075 mM of the chromone or 1% DMSO/Ethanol (Control). (A) Levels of cleaved caspase 3. (B) Levels of the active form of tumor suppressor protein p53. Data are represented as the average of two independent experiments. The optical density (O.D.) is directly proportional to the amount of protein of living cells. p-values lower than 0.05 were considered statistically significant (***p < 0.001).
| 48 (h) |
|---|
| Cell line | Ethanol extract | Chromone | 5-fluorouracil |
|---|
| IC50 (mM) | SI | IC50 (mM) | SI | IC50 (mM) | SI |
|---|
| CHO-K1 | >10 | ---- | >10 | ---- | 0,027 ± 0,002 | ---- |
| SW480 | >10 | >1 | 0,100 ± 0,006 | >100**** | 0,042 ± 0,006 | 0,64 |
| SW620 | >10 | >1 | 0,115 ± 0,019 | >86,9**** | 0,080 ± 0.027 | 0,34 |