Materials
We prepared the RPMI-1640 medium from Gibco, Grand Island, USA, and fetal bovine serum (FBS) and penicillin-streptomycin from Biowest, France. 3-(4,5-dimethylthiazol-2- yl)-2, 5-diphenyltetrazolium bromide (MTT) was from Atocel, Austria. For cell treatment, cisplatin (Platinol) and gemcitabine (Gemzar) were purchased from Vianex S.A, Greece and Sobhan, Iran, respectively, and menadione (Cat. No. M5625) was from Sigma-Aldrich. FITC anti-human CD44 antibody (Cat. No. 560977; BD Biosciences, San Jose, CA, U.S.A), PE anti- Human CD133/2 (clone: 293C3; Miltenyi Biotec, Bergisch Gladbach, Germany), PE anti-Human CD243 (ABCB1) antibody (Cat. No 919405; Biolegend, San Diego, C.A, U.S.A), Propidium iodide (PI) (Cat. No. P4170; Sigma-Aldrich) and 7-amino-actinomycin D (7-AAD) (Cat. No. 559763; B.D Bioscience) were used for flow cytometry. Total RNA isolation kit was purchased from DENAzist Asia, Mashhad, Iran. RNase-free DNase I (Cat. No. EN0521) and M-MuLV reverse transcriptase (Cat. No. EP0441) was from Thermo Scientific, Wilmington, USA. The real-time PCR was performed using Real QPCR 2x SYBR Green master mix (Cat. No. 5000850-1250; Amplicon, UK). Oligo(dT)18 primer and dNTP were obtained from Yekta Tajhiz Azma, Tehran, Iran.
Cell culture and treatment
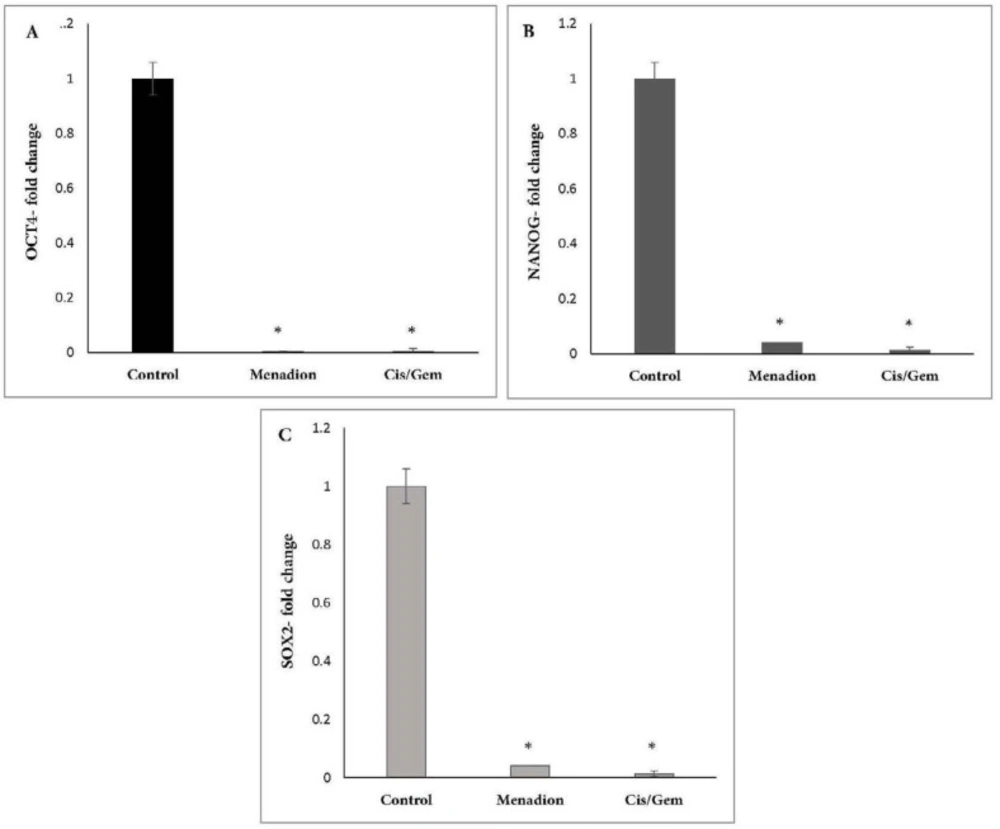
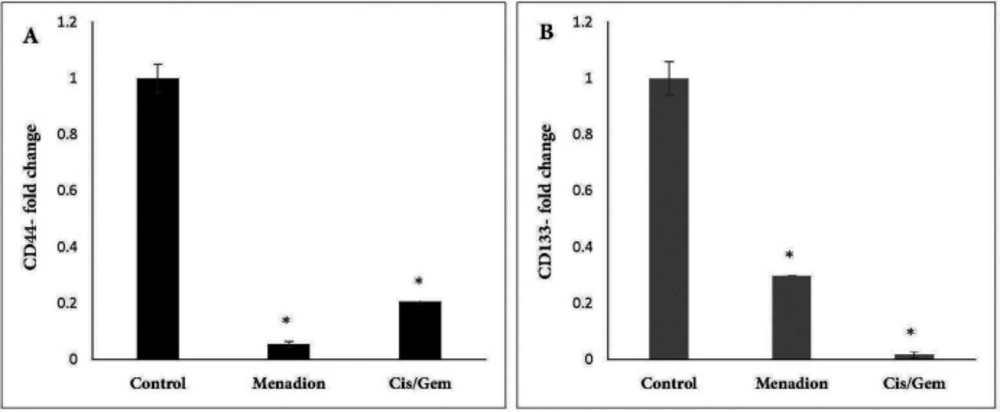
Human lung cancer cell line A549 was obtained from the National Cell Bank of Iran (Pasteur Institute of Iran, Tehran). They were cultured in RPMI-1640 medium supplemented with 10% FBS, 100 U/mL penicillin, and 100 mg/mL streptomycin and maintained at 37 °C in humidified air with 5% CO2. For treatment experiments, A549 cells were treated for 7 days by combination of cisplatin (0.25 µM)/gemcitabine (5 µM) and 16 µM menadione separately. RNA isolation, quantitative reverse transcription PCR (qRT-PCR) and flow cytometry analysis was carried out on untreated and treated cells to evaluate the gene expression level.
Measurement of cell viability
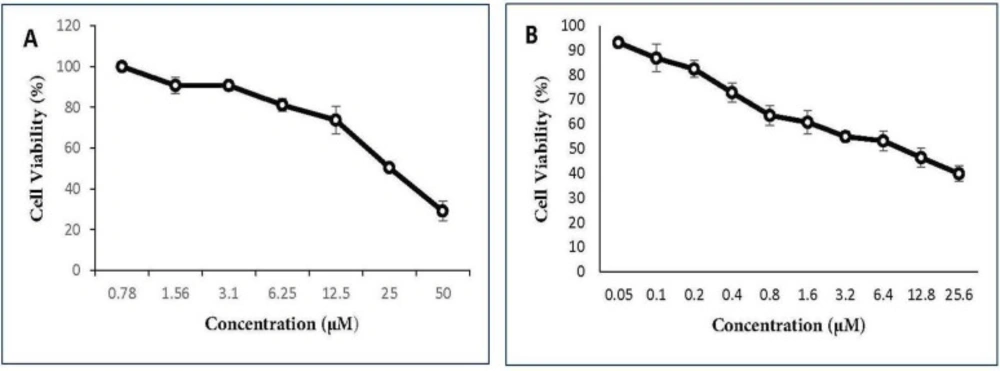
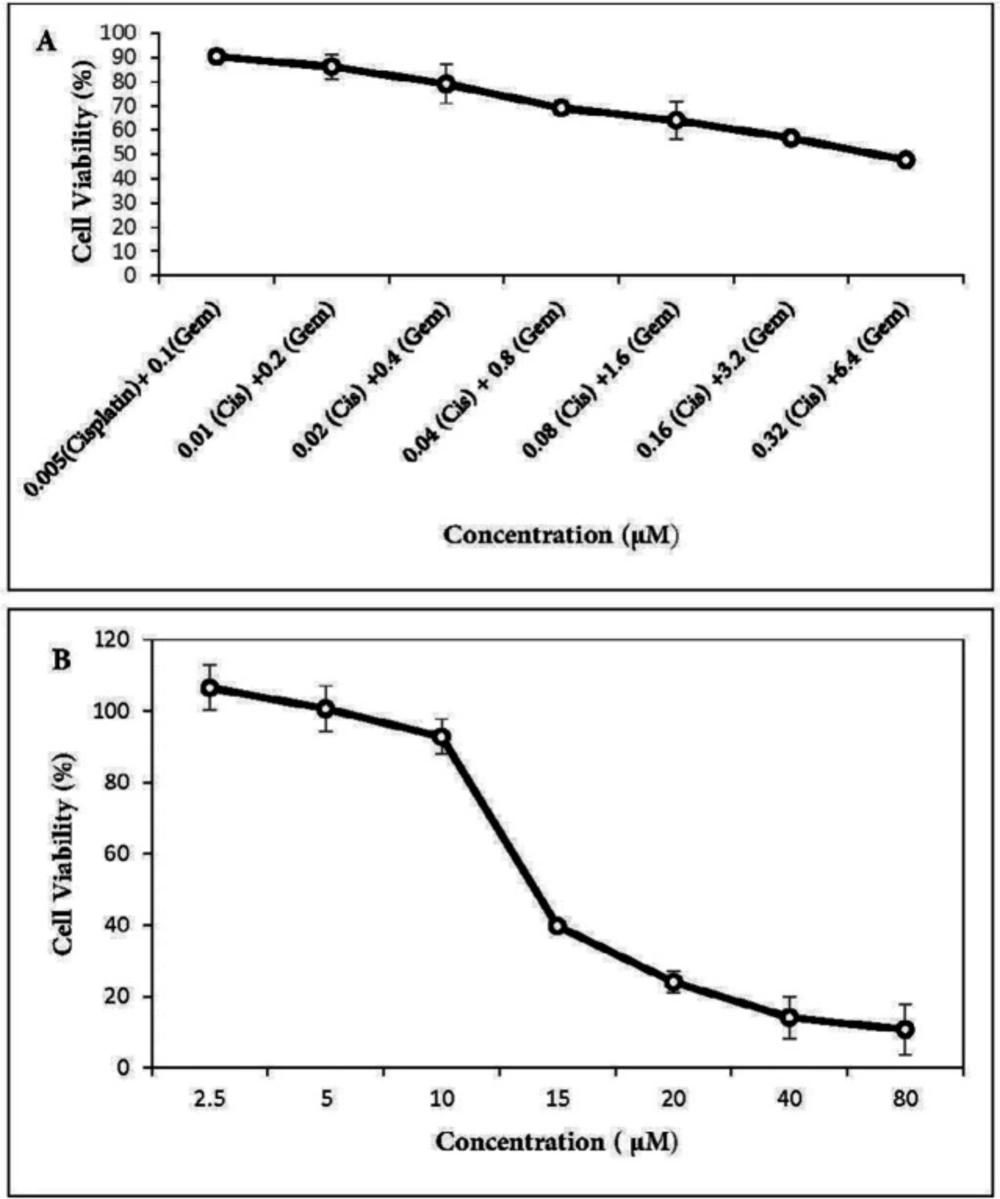
MTT (3-[4,5-dimethylthiazol-2-yl]-2,5-diphenyltetrazolium bromide) assay was conducted to evaluate
in-vitro cytotoxicity of gemcitabine and cisplatin as single agents and their combinations as well as menadione on the A549 cell line. The cells were seeded in 96-plates at a density of 5 × 10
3 cells/well and allowed to adhere overnight. Cells were exposed to different concentrations of each drug as shown in
Figures 1 and
2. After 48 h incubation, 20 µL MTT stock solution (5 mg/mL) was added into each well and cells were incubated for 3 h at 37 °C. Thereafter, 100 μL dimethyl sulfoxide (DMSO) was added to each well to dissolve the formazan crystals. The absorbance was measured at a wavelength of 540 nm by spectrofluorometry (BioTekELx800, USA). The percentage of cell viability calculated as: [(OD 490 treated cells)/OD 490 control cells] × 100. The IC
50 values of agents were calculated using Prism 6.0 (GraphPad Software, Inc., San Diego, California, USA).
Quantitative reverse-transcription PCR (qRT-PCR)
Total RNA was extracted using an RNA isolation kit according to the manufacturer’s instructions and was reverse-transcribed by using M-MuLV reverse transcriptase as described in the protocol.
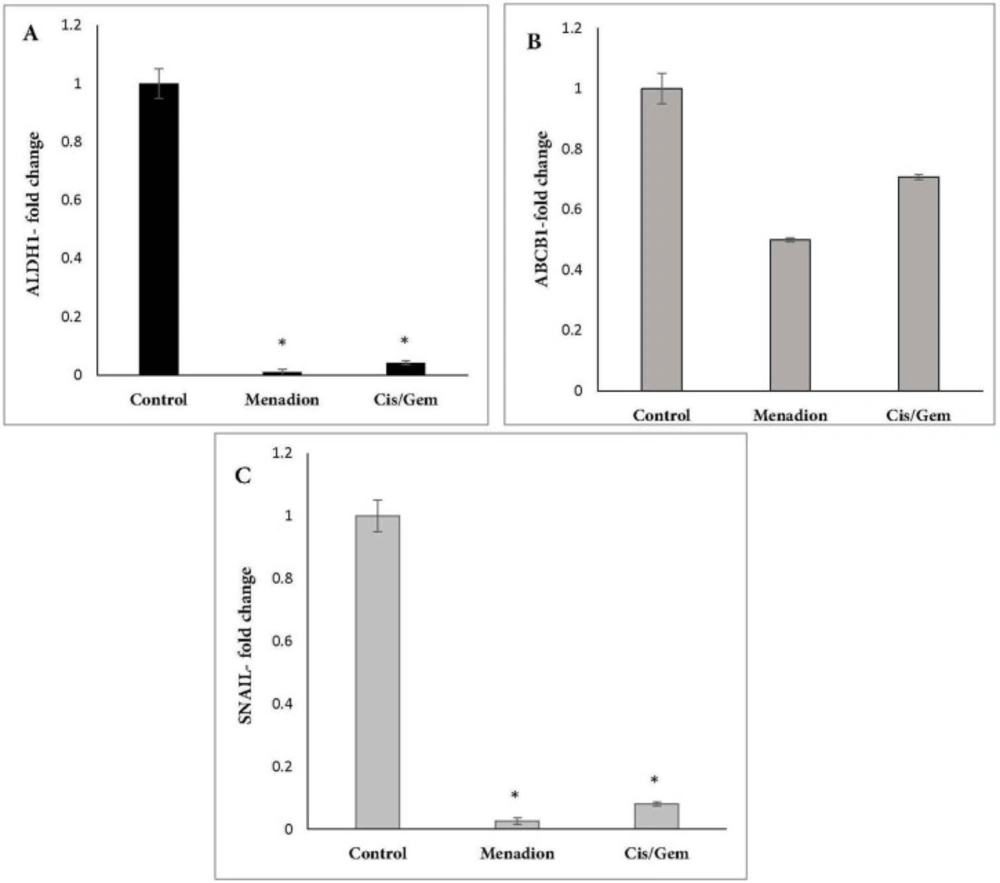
Real-time PCR was carried out on Thermocycler (Analytik Jena, Jena, Germany). Each reaction consists of 1X SYBR Green Real-time PCR Master Mix, 1 µL cDNA template, and each primer at 250 nM in a 20 µL reaction volume. Gene-specific primers were designed using Oligo7 Primer Analysis Software. The sequence of primers and product length are described in Table 1. Amplification conditions for Oct4, Nanog, Aldh1a1, Abcb1, CD133, CD44, Gapdh and Snail were: 95 ºC for 15 min, followed by 40 cycles of 95 ºC for 20 sec, 64 ºC for 30 sec, and 72 ºC for 15 sec. The same program was used for Sox2, except that the annealing temperature was 66 ºC. At the end of the PCR runs to derive melting curves, the temperature was increased in steps of 1 ºC for 5 sec from 60 ºC to 95 ºC. Analysis of melting curves clearly indicated that each of the primer pairs amplified a single expected product with a distinct Tm. The accuracy of the amplification reaction was validated by gel electrophoresis. Gapdh was used as an endogenous control to normalize each sample. Relative quantification of mRNA within the samples was examined using the comparative Ct method (ΔCt treated cells – ΔCt control cells = ΔΔC; relative quantity = 2 -ΔΔct).
Flow cytometry
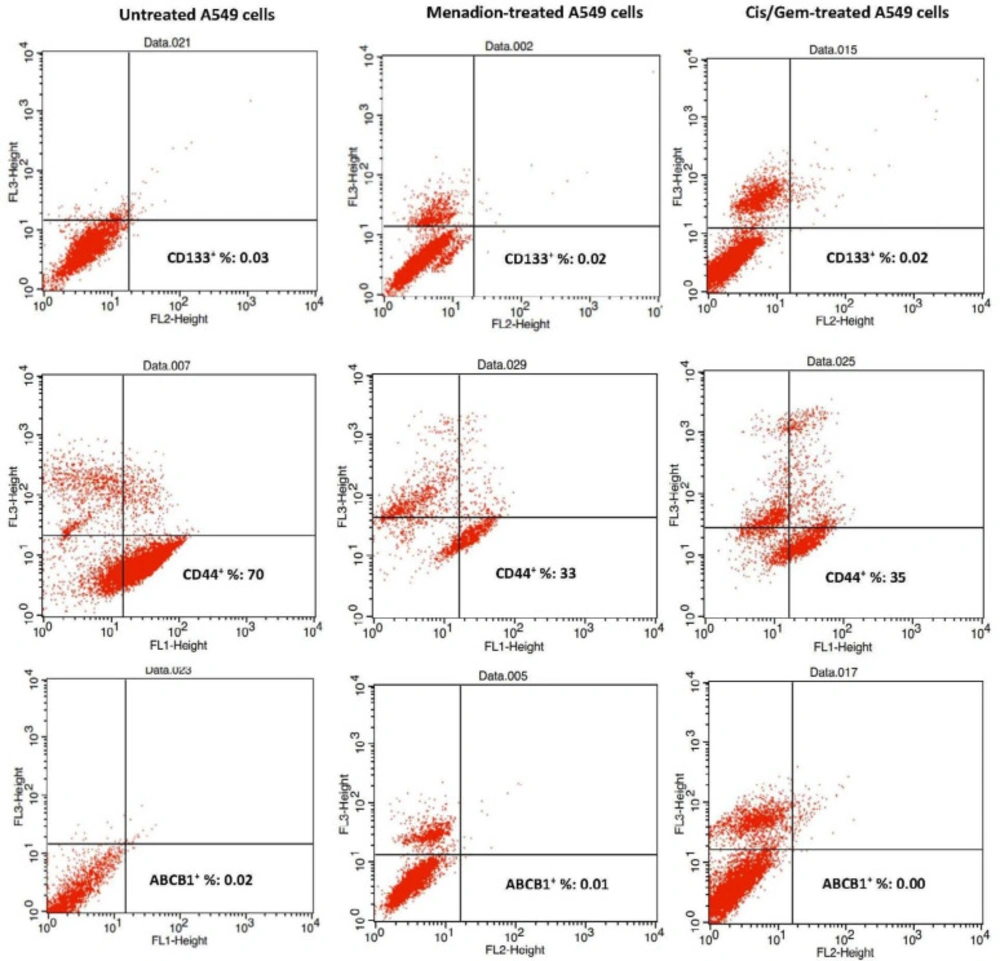
The following protocol was employed to examine the expression of cell surface markers CD44, CD133, and ABCB1 by flow cytometry. Cells were dissociated with trypsin-EDTA and after washing, one million cells were suspended in PBS/2% FBS. The antibodies were added to cells at a 1:5 dilution for FITC-CD44 antibody and 1:10 dilution for PE-CD133 and PE-ABCB1 antibodies for 30 min in the dark. Finally, after washing, cells were suspended in 0.5 mL of PBS/2% FBS and then analyzed by flow cytometry. To detect dead cells, PI was used with FITC-CD44 antibody and 7-AAD was used with PE-CD133 and PE-ABCB1 antibodies. Flow cytometry was done using a FACSCalibur (BD Biosciences, San Jose, CA, USA). Data were analyzed by Flow Jo software, which is provided with the system.
Statistical analysis
All data were expressed as Mean±SD and analyzed using SPSS 16.0 software (SPSS Inc, Chicago, IL, USA). Data analysis was performed using Student’s t-test, and P < 0.05 was considered to indicate a statistically significant difference. All the experiments were repeated for 3 times.