Centrality Analysis of Protein-Protein Interaction Networks and Molecular Docking Prioritize Potential Drug-Targets in Type 1 Diabetes

authors:

avatar Asma Soofi a , avatar Mohammad Taghizadeh b , avatar Seyyed Mohammad Tabatabaei c , avatar Mostafa Rezaei Tavirani d , avatar Heeva Shakib e , avatar Saeed Namaki f , avatar Nahid Safari Alighiarloo g , *

Department of Physical Chemistry, School of Chemistry, College of Sciences, University of Tehran, Tehran, Iran.
Bioinformatics Department, Institute of Biochemistry and Biophysics, Tehran University, Tehran, Iran.
Medical Informatics Department, School of Medicine, Mashhad University of Medical Sciences, Mashhad, Iran.
Proteomics Research Center, Department of Basic Science, Faculty of Paramedical Sciences, Shahid Beheshti University of Medical Sciences, Tehran, Iran.
Cellular and Molecular Endocrine Research Center, Research Institute for Endocrine Sciences, Shahid Beheshti University of Medical Sciences, Tehran, Iran.
Immunology Department, Faculty of Medical Sciences, Shahid Beheshti University of Medical Sciences, Tehran, Iran.
Endocrine Research Center, Institute of Endocrinology and Metabolism, Iran University of Medical Sciences, Tehran, Iran.

how to cite: Soofi A, Taghizadeh M, Tabatabaei S M, Rezaei Tavirani M, Shakib H, et al. Centrality Analysis of Protein-Protein Interaction Networks and Molecular Docking Prioritize Potential Drug-Targets in Type 1 Diabetes. Iran J Pharm Res. 2020;19(4):e124382. https://doi.org/10.22037/ijpr.2020.113342.14242.

Abstract

Type 1 diabetes (T1D) occurs as a consequence of an autoimmune attack against pancreatic β- cells. Due to a lack of a clear understanding of the T1D pathogenesis, the identification of effective therapies for T1D is the active area in the research. The study purpose was to prioritize potential drugs and targets in T1D via systems biology approach. Gene expression data of peripheral blood mononuclear cells (PBMCs) and pancreatic β-cells in T1D were analyzed and differential expressed genes were integrated with protein-protein interactions (PPI) data. Multiple topological centrality parameters of extracted query-query PPI (QQPPI) networks were calculated and the interaction of more central proteins with drugs was investigated. Molecular docking was performed to further predict the interactions between drugs and the binding sites of targets. Central proteins were identified by the analysis of PBMC (MYC, ERBB2, PSMA1, ABL1 and HSP90AA1) and pancreatic β-cells (HSP90AB1, ESR1, RELA, RAC1, NFKB1, NFKB2, IKBKE, ARRB2 and SRC) QQPPI networks. Thirteen drugs which targeted eight central proteins were identified by further analysis of drug-target interactions. Some drugs which investigated for diabetes treatment in the experimental models of T1D were prioritized by literature verification, including melatonin, resveratrol, lapatinib, geldanamycin, eugenol and fostaminib. Finally, according on molecular docking analysis, lapatinib-ERBB2 and eugenol-ESR1 exhibited highest and lowest binding energy, respectively. This study presented promising results for the prioritization of potential drug-targets which might facilitate T1D targeted therapy and its drug discovery process more effectively.

Introduction

Type 1 diabetes (T1D) is characterized by partial or absolute insulin deficiency as a result of chronic immune-mediated destruction of pancreatic β-cells, leading to hyperglycemia and consequent polyuria, polydipsia, and weight loss (1). At first glance, it seems like a single autoimmune disease but it presumably results from a complex interplay between environmental factors and microbiome, genome, metabolism, and immune systems with individual variations (2). The mainstay treatment for T1D is daily injections or continuous subcutaneous infusion of insulin to control blood sugar (3). Despite advances in the production, purification, formulation, and insulin delivery methods, it is difficult for patients to achieve optimal glucose control. Therefore, various adjunctive therapies for patients with T1D are available (4). Further, the other important aspect of T1D management is pancreatic β-cells preservation. In this line, numerous clinical trials have uncovered how immune modulation can impede the β-cell loss either by blocking the autoimmune response or by re-establishing immune tolerance (3, 5). Despite noticeable improvement in patients’ survival and health, especially in the past 25 years, a treatment for T1D is elusive (6).

Nowadays, scientific researches show noticeable shift to systems-based understanding of molecular mechanism underlying biological resources, which remarkably affected drug discovery studies and represented the necessity of movement from traditional pharmacology (7). Systems pharmacology applies systems biology principles and combines high throughput experimental studies with computational analysis to study drugs, drug targets, and drug effects (8). Network-based gene expression profiling constructed by integrating multiple factors including disease genes, gene expression intensities and proteins network provides efficient strategy to discover therapeutic signatures.

Transcriptome analysis of the target organ, i.e., pancreatic β-cells, and peripheral blood mononuclear cells (PBMCs) are informative entities for the investigation of genes expression profiles in T1D (9, 10). Till date, gene expression profiles have been integrated with protein-protein interactions (PPI) data to ameliorate their predictive performance (11-13). Networks of interacting proteins in diseases’ pathways have been analyzed for identifying candidate drug targets (14-16). Since well-connected proteins in the PPI networks have more potential to play crucial role in a cellular function, their targeting would be more effective rather than ordinary proteins.

The main goal of a network analysis is the connecting of a network structure to a function. For instance, different classes of disease genes presented distinction features based on their connectivity patterns in the human PPI network analysis (17, 18). The topological analysis of PPI networks provides a whole view of the network and helps to identification of the components with a central role in the network connectivity (19-21). Investigating of the network centrality measures can be a source of essential nodes’ discovery in various species’ interactomes (22). In this line, Peng et al. study explored standard pathways and gene expression-based pathways’ information and showed how network centrality measures have been effective in reorganization of potential therapeutic targets. They also alter the network topology, which resulted in different therapeutic targets discovery and introduced tissue-specific data (23). It has been also reported that topologically closer genes in PPI networks, i.e., having a lower shortest path distance in a network, were more regulated by structurally similar drugs rather than dissimilar drugs (24).

Here, we integrated gene expression profiles with interactome (protein-protein interactions at the whole genome level) data to construct PPI networks using abnormally expressed genes in paired pancreatic β-cells and PBMCs in T1D. Topologically central proteins in PPI networks were identified. Candidate drugs and targets were then prioritized from the analysis of central proteins and drugs interactions. Docking analysis disclosed the interactions between candidate drugs and targets at the atomic level.

Exprimental

Gene expression data processing

Gene expression profiles of PBMCs (GSE9006) and pancreatic β-cells (GSE35296) were used to determine abnormally expressed genes in T1D (19). A total of 43 newly diagnosed T1D patients and 24 healthy subjects were present in GSE9006 dataset. Gene expression profile of pancreatic β-cells was provided from human isolated islet samples which cultured under normal conditions as well as in the presence of cytokines (IL-1B and IFN-γ). According to our earlier work, GSE9006 data (HG-U133A and HG-U133B) was normalized by RMA algorithm in the affy package within R software and differentially expressed genes were determined by ANOVA test (p < 0.05). For each gene, the minimal p-value (between HG-U133A and HG-U133B) was chosen. In the case of GSE35296, up and downregulated genes were extracted by Fisher’s exact test and p-values were corrected by the Benjamin–Hochberg procedure (p < 0.05) (9, 10 and 19).

PPI network construction and centralityanalysis

Experimentally proved PPI data provided by International Molecular Exchange (IMEx) consortium were obtained from IntAct MINT DIP databases (25-27). Differentially expressed genes in PBMCs and pancreatic β-cells were separately located on the human PPI network to construct Query-Query PPI (QQPPI) networks which involved the direct interactions among the query proteins as the nodes. The QQPPI networks were visualized with the yFiles organic layout algorithm in Cytoscape software (28). The following five more important centrality parameters were calculated using CentiBiN software to determine biologically significant nodes (29). Degree centrality is the number of links to a given node. In PPI networks, nodes with a higher degree are considered as hubs and they are usually located at the center of the network (30). Betweenness centrality measures the number of shortest paths passing through a node within a network. High betweenness nodes, named as bottlenecks, monitor the flow of information within a network (31). Closeness centrality calculates the average distance of all the shortest paths between a node and every other node within a network. High closeness should indicate the proximity of a node to all other nodes (31). Eigen vector centrality measures the relative significance of all nodes in the network. Thereby, a node that is connected to highly important nodes achieves more weight than a node that is connected to low important nodes. Since a node with a high eigenvector connects to numerous central nodes, it is considered the central and influential node (31). Centroid value is the most complex node centrality index and considers couples of nodes (i, j). The centroid value of a node i is the number of nodes with minimum shortest path which are closer to i than j. The highest centroid node has the highest number of neighbors separated by the shortest path to it (31). Centrality values of nodes were calculated and nodes were arranged in ascending order of the centrality values. Thirty nodes which had the highest values for each centrality parameter were identified. More central nodes had at least two high centrality parameters.

Drug enrichment analysis

Central nodes in both PBMCs and pancreatic β-cells QQPPI networks were screened as targets. To find potential drugs, central proteins were curated through a manual search in DrugBank database (version 5.4.1). The parameters were set as: FDA approved, experimental and investigational. This information was subsequently used to evaluate the association of drug-targets with T1D treatment by literature survey.

Molecular docking analysis

Molecular docking has been widely used to predict the interactions between a small molecule and the binding site of the target at the atomic level. Docking analysis was performed for potential targets and their candidate drugs which investigated for diabetes treatment in experimental models (32-34). The crystallographic structures of reference targets (ESR1, ERBB2, RAC1 and HSP90AB1) were extracted from RCSB PDB (http://www.pdb.org/). The selected PDB IDs have following quality parameters. The ESR1 structure with PDB ID = 3ERT (resolution = 1.90 Å, R-value and R-free equal to 0.229 and 0.262, respectively) and the ERBB2 structure with PDB ID = 3PP0 (resolution = 2.25 Å, R-value and R-free equal to 0.185 and 0.260, respectively), the RAC1 structure with PDB ID = 3TH5 (resolution = 2.30 Å, R-value and R-free equal to 0.229 and 0.264, respectively), and the HSP90AB1 structure with PDB ID = 1UYM (resolution = 2.45 Å, R-value and R-free equal to 0.235 and 0.294, respectively), which warranted adequate quality for further docking analysis.

The macromolecule structures were separated from the co-crystallized ligands and unnecessary water molecules were removed using Discovery Studio Visualizer 4.5. The structures of Lapatinib, Azathioprine, Geldanamycin, and Eugenol (PubChem CID 208908, 2265, 5288382, and 3314 respectively) were obtained from PubChem (https://pubch em.ncbi.nlm.nih.gov/). The 3D structures of the compounds were created by Openbabel 2.4.1 and different formats for both receptor and ligand molecules were converted using this software. Prior to any calculation, all 3D structures of ligands were initially energy minimized with MMFF94S force field using conjugate-gradient algorithm with 5000 run repetition. AutoDock-4 software in PyRx Virtual Screening tool was used to carry out molecular docking calculations. The protein coordinates were kept rigid, while the ligands were flexible and moved on the grid map which was set around the co-crystallographic ligands. In order to prepare the receptor molecules, polar hydrogens and kollman charges were added in AutoDock tool. The ligand was prepared by adding Gasteiger charges to each ligand atom. AutoDock 1.5.6.40 was utilized for the molecular docking simulation. Lamarckian genetic algorithm (LGA) with 150 independent runs per ligand was used to get best docking conformations. The number of individual population was set to 150. The max number of energy evaluations was set to 2,500,000 and the max number of generation was set to 27000. The quality of the docking has been assessed by removing co-crystallized ligands from the active site of each protein and re-docking into the binding pocket. A root mean square deviation (RMSD) was obtained from re-docking of each protein indicating that the docking procedure used in the current study could be relied upon to be capable of reproducing a similar conformation at the active site of each protein. Discovery Studio 4.5 Client was used for the visualization of docking results shows the study workflow. Figure 1 shows the study workflow.

Results

Identification of differential expressed genes

Gene expression analysis was performed on PBMCs and pancreatic β-cells samples. In the case of PBMCs, 2466 genes were determined as differentially expressed ones (p < 0.05), of which 1024 were upregulated and 1442 were downregulated (Supplementary file 1). For pancreatic β-cells, 3068 genes were significantly differential expressed (FDR < 0.05), of these genes, 1416 were upregulated and 1652 were downregulated (9).

PPI network construction and topological centrality analysis

To investigate the interactions among the differential expressed genes in T1D at the protein level, two QQPPI networks were established using the three IMEx databases. The QQPPI networks which included 949 proteins and 1776 interactions in PBMCs and 1358 proteins and 3505 interactions in pancreatic β-cells were used for further analysis. Five centrality parameters were measured for all the nodes presented in the QQPPI networks. MYC, YBX1, SRPK1, ERBB2, PSMA1, ABL1, HSP90AA1 and XRCC6 were more central nodes in PBMC QQPPI network. HSP90AB1, ESR1, CDC5L, RELA, RAC1, NFKB1, NFKB2, IKBKE, ARRB2, TP53, SRC, CFTR, HSP90AA1, PIK3R1 and PPP1CA were more central nodes in pancreatic β-cells QQPPI network. The list of nodes’ centrality values in PBMCs and pancreatic β-cells QQPPI networks were provided in Supplementary file 2 and 3, respectively. More central nodes of PBMCs and β-cells QQPPI networks are illustrated in (Figures 2A and Figure 2B), respectively. Besides, centrality parameters of fourteen more central proteins which identified as drug targets are provided in (Table 1).

Prioritization of potential drugs and targets

Twenty-three and thirty proteins in the high-confidence PBMCs and pancreatic β-cells QQPPI networks were curated for identifying of related drugs, respectively, using DrugBank database. At first screening, twenty-one drugs which targeted fourteen proteins obtained by this approach. Potential drugs and their protein targets are presented in Table 2; they were then verified if their associations with diabetes treatment were reported by the retrieved literatures (Table 2). The results showed that one drug, glyburide, was approved for the treatment of type 2 diabetes (T2D) and three drugs are being explored in several clinical trials for T1D (imatinib) and pre-diabetes or T2D (resveratrol and melatonin) treatment. In this line, the association of resveratrol and melatonin were studied in the experimental models of T1D. Azathioprine was earlier investigated by some clinical trials for T1D treatment. Both imatinib and azathioprine were immunosuppressive drugs. Lumacaftor/Ivafactor is being studied for glycemic control in cystic fibrosis related diabetes by clinical trials. Further, the association of six drugs with hyperglycemic or other diabetic condition has been reported in the experimental models of T1D or T2D, including, lapatinib, geldanamycin, eugenol, fostaminib, dasatinib and forskolin. Finally, four drug-target interactions (lapatinib-ERBB2, geldanamycin-HSP90AB1, azathioprine-RAC1 and eugenol-ESR1) were selected for further investigation by docking analysis.

Molecular docking and binding energy analysis

Single molecular docking was carried out to explore the characteristics of the binding conformation and the interacting residues of four targets and candidate drugs related to diabetes. Autodock-4 was used in this study to repeatedly dock each ligand to the binding pocket of the target. The docking analysis resulted in 150 conformations for all 4 complexes, and the docked conformation corresponding to the lowest binding energy for each receptor-ligand complex was selected as the most probable binding conformation. The ligands were embedded within the active site of proper target protein individually. The formation of hydrogen bonds was observed in order to analyze the establishment of the active site of the target protein. The analysis of binding site residues lying within 4 Å distance of the ligand for each complex indicated that the drugs were surrounded by both hydrophobic and hydrophilic residues (Table 3). The binding pocket of all targets was generally surrounded by both hydrophobic and hydrophilic residues.

Before docking the drug to a receptor structure, the docking protocol was validated by docking of the co-crystallized ligand into the binding pocket to obtain the docked pose. The RMSD in the range of 2–3 Å indicated appropriate docking, and as shown in the Supplementary file 4, overall docking conformations produced by Autodock-4 were within 0.5-1.5 Å of RMSD; this was showed the enough quality of the parameters for docking simulation in reproducing of the X-ray crystal structures.

Hydrogen bonds play a role in stabilizing the protein-ligand complex. The best conformation of each inhibitor at properly biological target formed great number of interactions with the main residues in the active site of the target. As shown in (Table 4), lapatinib was oriented inside the active site of ERBB2 in a way that formed hydrogen bond with residues LEU-785 (3.160Å) and MET-801 (3.149Å) of the loop region. Furthermore, the analysis of docked complex of lapatinib- ERBB2 showed binding energy of -10.59 kcal/mol (RMSD 1.16 Å), (Figure.3A). Lapatinib-ERBB2 complex showed highest binding energy among four complexes in this study. The analysis of docking complex of azathioprine-RAC1 revealed the binding energy of -9.32 kcal/mol (RMSD 2.0 Å), respectively and exhibited two binding interactions with GLY-15 (2.991 Å) and THR-17 (3.172 Å) residue of the loop region, (Table 4 and Figure 3B). The docked complex of geldanamycin-HSP90AB1showed binding affinities of -8.83 kcal/mol (RMSD 1.93 Å) which is bound with alpha helix residues such as GLY-137 (3.105 Å) and PHE-138 (3.06537 Å), (Table 4 and Figure 3C). In case of eugenol-ESR1, the complex has binding energy of -5.23 kcal/mol (RMSD 1.21 Å) and formed tow hydrogen bond with GLU-353 (1.791 Å) and ARG-394 (2.885 Å), (Table 4 and Figure.3D). Eugenol-ESR1 complex showed the lowest binding energy in compare to other complexes.

Discussion

Systems biology approach gives us a comprehensive view to improve our understanding of disease mechanisms and introduce new way for a discovery of novel drugs and repurposing of existing drugs (
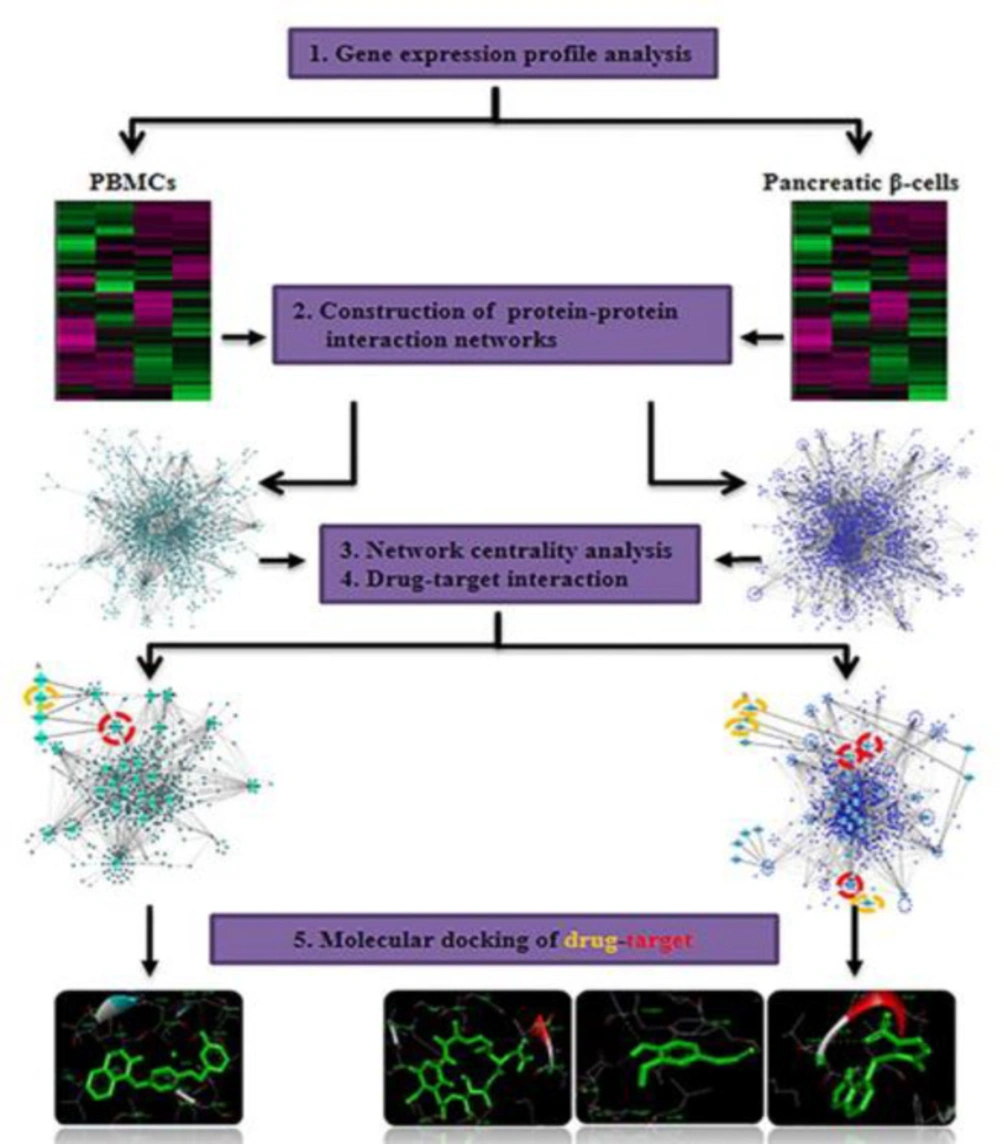
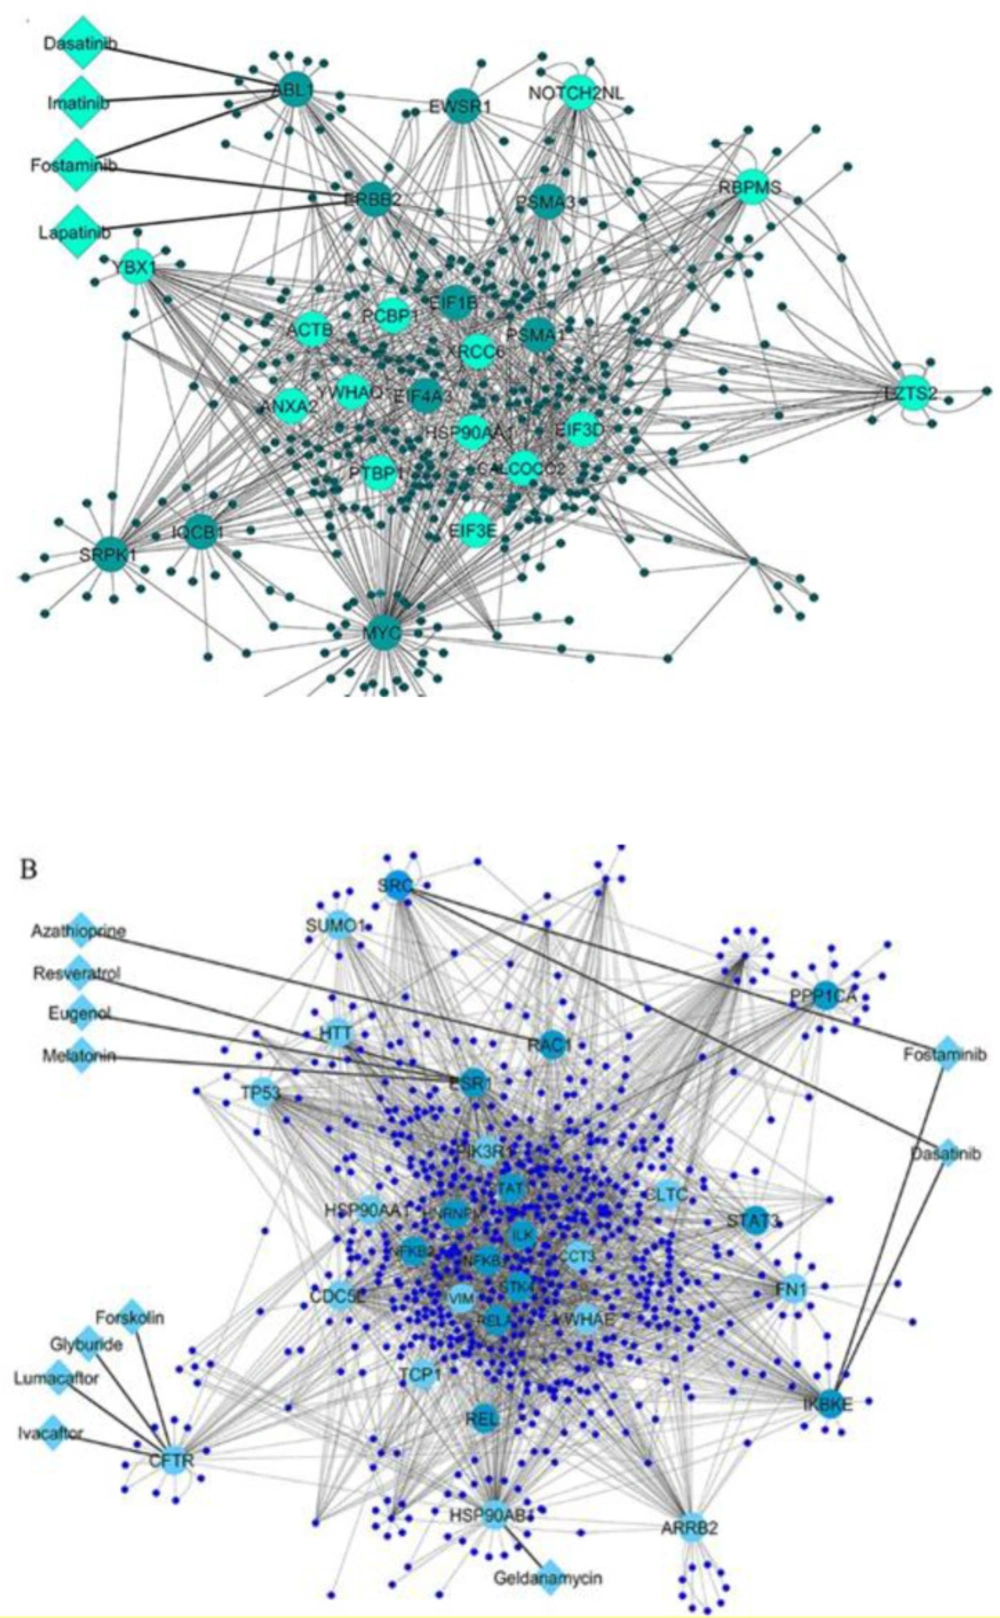
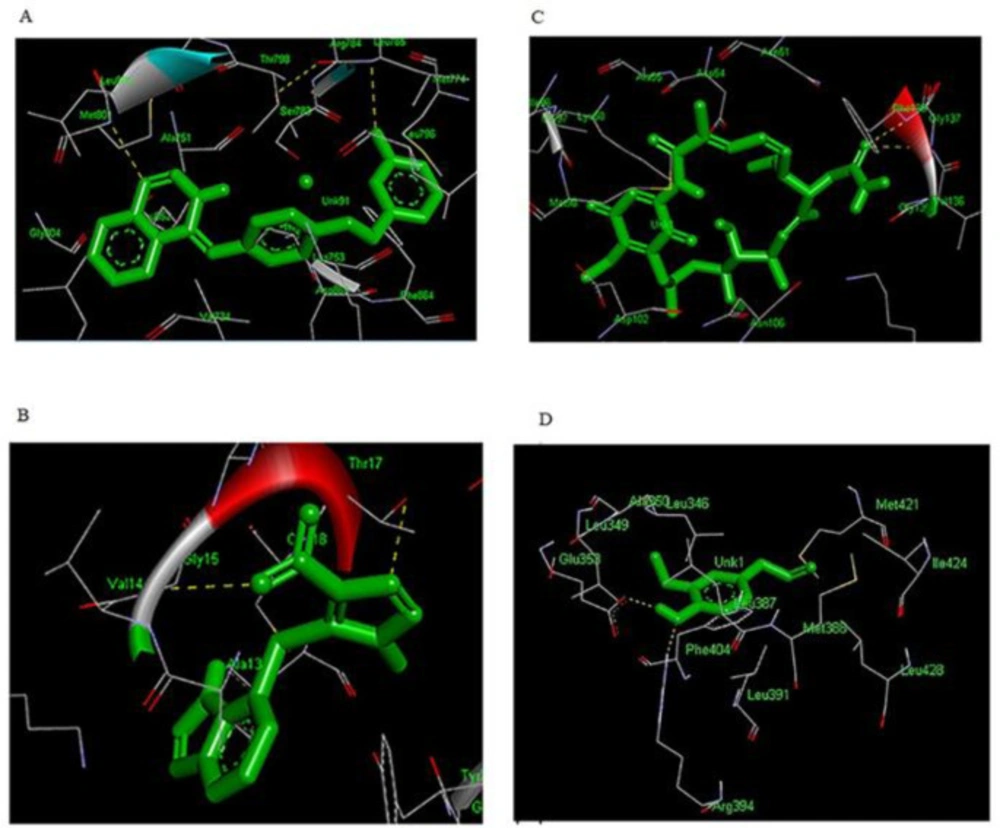
35). In this study, differentially expressed genes of PBMCs and pancreatic β-cells in T1D integrated with PPI data. Five centrality parameters, degree, betweenness, closeness, centroid value and eigenvector were measured for nodes in PBMCs and pancreatic β-cells QQPPI networks to find central proteins. A protein is considered a key molecule only if it is selected in at least two centrality measures. By analysis of central proteins and drugs interactions, several candidate drugs and targets were prioritized for T1D. Furthermore, some predicted drug-targets with a relevant to diabetes were used as an input for docking analysis which can calculate the probability of a physical interaction with the given drug and candidate targets.

In the current study, fourteen targets and twenty-one candidate drugs were identified. By literature review, thirteen drugs which targeted eight key proteins showed association with diabetes. Some of them such glyburide has been approved for T2D and some ones like imatinib, resveratrol and melatonin are being evaluated in the clinical trials in patients with diabetes. Glyburide targets CFTR gene and it is second-generation sulfonylureas which approved for diabetes management. Glyburide is an antagonist of CFTR. The results of a study revealed a role of CFTR in glucose-induced electrical activities and insulin secretion in β-cells (36).  Grishman et al. study proposed a glyburide as one of the potential therapies to decrease the progression of T1D due its ability to decrease IL1β levels (37). Imatinib targets ABL gene. Endoplasmic reticulum stress in β-cell was increased in the NOD mouse as a result of the c-Abl tyrosine kinase activity. Consequently, the unfolded protein response was promoted that ultimately leading to β-cell death; this process might be affected via inhibition of c-Abl by imatinib (38). Moreover, insulin response was ameliorated in the experimental model of T1D by imatinib. Now, phase II clinical trial of imatinib treatment is ongoing in early-onset patients with T1D (39). Resveratrol targets ESR1 gene and is being evaluated in the clinical trials in patients with insulin resistance and T2D. Resveratrol binds to estrogen receptors which might be linked to the anti-diabetic effect in diabetes (40). It is well established that resveratrol diminish blood glucose levels in animals with experimental T1D (41). In this line, the results of a study demonstrated that resveratrol or 17β-estradiol apparently protected against STZ-induced diabetes in OVX mice; they probably improve antioxidant activities and islet function, promote muscle glucose uptake and prohibit the expression of p-ERK (42). Melatonin also targets ESR1 gene; it is being assessed in the clinical trials in patients with T2D. Melatonin interferes with estrogen-signaling pathways (43). The increased level of melatonin synthesis was reported in an animal model of STZ-induced T1D (44). The improvement of immune response and the anti-inflammatory effect were mentioned as the consequence of melatonin, which might inhibit the disease onset or ameliorate the survival of islet grafts transplanted for T1D therapy (45).

Moreover, four targets and their candidate drugs that their associations have been proved in the experimental models of diabetes were also prioritized. First, geldanamycin targets HSP90AB1 gene. Geldanamycin is specific HSP90 inhibitor. HSP90 inhibitors such as geldanamycin and its derivatives target HSP90 N terminus and block its ATPase activity; they have been identified as potential treatment strategy in cancer and promising drugs for immune and inflammatory diseases, including diabetes (46). The result of a study presented that heat shock proteins as well as treatment with geldanamycin noticeably improve diabetic macrophages activation, resulting in compromising mounting of inflammatory and immune responses (47). Besides, hyperglycemia was reversed by chronic dosing of HSP90 inhibitors in the diabetic db/db mouse model, and insulin sensitivity was made better in the diet-induced obese mouse model of insulin resistance (32). The second, eugnol targets ESR1. Eugenol is an estrogen receptor antagonist. Several medicinal applications were reported for the eugenol treatment such as antibacterial, antiviral, antioxidant, anti-inflamatory agent (48). The result of Al-Trad et al. study showed significant anti-oxidative and anti-inflammatory effect of eugenol in HFD/STZ-induced diabetic rats. Moreover, insulin sensitivity was improved by eugenol and skeletal muscle glucose uptake was stimulated via activation of the GLUT4-AMPK signaling pathway (33). The third, lapatinib targets ErbB2 gene. Lapatinib is a member of tyrosin kinase inhibitors (TKIs) which can target tyrosine kinase enzymes and interfere with downstream intracellular messaging pathways (49). Numerous studies represented the glucose-lowering potential of TKIs, which suggest careful attention to apply these drugs to patients with diabetes (50). Lapatinib is a dual inhibitor of EGFR and ErbB2 receptor tyrosine kinases, by which high glucose-induced apoptosis and vascular dysfunction were refined via resistance to signaling changes influenced by diabetes in the experimental T1D models (34, 51). The last, azathioprine targets Rac1 gene. Azathioprine suppresses both T and B-lymphocyte function (52). Tiede et al. reported that azathioprine induces immunosuppression by prohibition of Rac1 activation in T cells, which may clarify the beneficial immunosuppressive effects of azathioprine. Therefore, it might help to design the novel specific therapies for organ transplantation and autoimmune diseases (53). Furthermore, Veluthakal et al. identified a known inhibitor of Rac1, NSC23766, which remarkably suppresses reactive oxygen species (ROS) generation in pancreatic islet β-cells in in-vitro, and significantly inhibits the development of spontaneous diabetes in the NOD mice (54). Different trials were earlier conducted using azathioprine as an immunosuppressive drug to treat children newly diagnosed with T1D (52, 55). Although there were partly successful in improving metabolic outcomes in diabetic patients, the reported side effects made it unpopular. However, recently Geliebter et al. showed the first recent case reports exhibiting the possible positive effect of azathioprine in tertiary prevention of T1D (56).

A workflow shows a network-based approach to prioritize drug-targets in T1D
(A) PBMCs QQPPI network and (B) pancreatic β-cells QQPPI network. Protein-protein interaction (PPI) networks of differentially expressed genes which involved the first neighbors of central nodes. Nodes with high centrality measures are illustrated by bigger size and different colors than others. The interaction of drugs with targets is shown in each QQPPI network. Up-regulated and down-regulated genes are colored by light green and dark green, respectively in (A), and light blue and dark blue in (B)
(A) Lapatinib-ERBB2 (B) Azathioprine-RAC1 (C) Geldanamycin-HSP90AB1 (D) Eugenol-ESR1. Molecular docking complexes. Drugs are shown in green stick model. H-bonds formed between residues and drugs are shown as yellow lines
Table 1

Centrality parameters of targets extracted form PBMCs and pancreatic β-cells QQPPI networks

NameDegreeBetweennessCentralityClosenessCentralityCentroid valueEigen vector
PBMCs
ABL1270.06270.2917-3780.0605
ERBB2320.07620.2942-3330.0758
MYC1170.36300.35843190.6041
Pancreatic β-cells
FN1860.09850.3439-2030.1258
CFTR350.02890.3007-7930.0499
IKBKE690.04980.3276-4390.1760
NFKB1350.01970.3329-3760.1219
NFKB2550.02910.3495-1920.2166
PIK3R1550.02920.3275-3560.0873
RAC1360.03370.3162-4350.0362
RELA740.06200.3525-1600.2143
SRC460.03090.3195-4560.0772
HSP90AB11120.14180.3686640.2870
ESR1980.11500.3600-840.2335
Table 2

The list of potential drugs and their targets extracted from PBMCs and pancreatic β-cells QQPPI networks

Gene nameDrugBank IDDrug nameActionsDrug group
PBMCs
ABL1DB00619ImatinibinhibitorApproved
DB01254Dasatinibmultitargetapproved, investigational
DB04868Nilotinibinhibitorapproved, investigational
DB12010Fostamatinibinhibitorapproved, investigational
ERBB2DB01259Lapatinibinhibitorapproved, investigational
DB12010Fostamatinibinhibitorapproved, investigational
MYCDB08813Nadroparininhibitorapproved, investigational
Pancreatic β-cells
FN1DB08888OcriplasmincleavageApproved
CFTRDB01016GlyburideantagonistApproved
DB00887BumetanideantagonistApproved
DB08820IvacaftorpotentiatorApproved
DB09280LumacaftormodulatorApproved
DB02587Colforsin- Forskolininhibitorexperimental, investigational
IKBKEDB12010Fostamatinibinhibitorapproved, investigational
NFKB1DB08814Triflusalantagonistapproved, investigational
NFKB2DB01296Glucosamineantagonistapproved, investigational
PIK3R1DB01064Isoprenalineagonistapproved, investigational
RAC1DB00993Azathioprine-Approved
RELADB08908Dimethyl fumarate-approved, investigational
SRCDB01254Dasatinibmultitargetapproved, investigational
DB12010Fostamatinibinhibitorapproved, investigational
HSP90AB1DB02424Geldanamycin-experimental, investigational
ESR1DB09086Eugenol-Approved
DB02709Resveratrol-approved, experimental, investigational
DB01065MelatoninantagonistApproved
Table 3

The list of residues presented around the 4 Å distances of each ligand in a specific receptor after docking

DrugReceptorResidues
LapatinibERBB2LEU-726,VAL-734,TYR-735,ALA751,ILE752,LYS-753,ILE-767,GLU-770,ALA-771,MET-774,SER-783,ARG-784,LEU-796,THR-798-PRO-802,CYC-805,ASP-863,PHE-864
AzathioprineRAC1GLY-10,ASP-11,GLY-12,ALA-13,VAL-14,GLY-15,LYS-16,THR-17,CYS-18,LEU-19,PHE-28,GLY-30,GLU-31,TYR-32,ILE-33,PRO-34,THR-35
GeldanamycinHSP90AB1GLE-47,LEU-48,ASN-51SER-52,ASP-54,ALA-55,LEU-56,LYS-58,ILE-96,GLY-97,MET-98,THR-98,ASP-102,ASN-106,PHE-134,GLY-135,VAL-136,GLY-137,HIS-154
EugenolESR1MET-342,LEY-345,LEU346,THR-347,ASN-348,ALA-350,ILE-386,LEU-387,GLY-390,VAL-392,ARG-394,PHE-404,MET-421,ILE-424,MET-517,LEU-525
 Table 4

Binding free energy of ligand-receptor complexes and their corresponding interaction energies

DrugReceptorAutoDock-4(Kcal/mole)RMSD in ÅHydrogen bonding interactions
Interacting ResiduesDistance (Å)Angle (Degree)
LapatinibERBB2-10.591.16LEU-7853.16087.979
MET-8013.149113.787
AzathioprineRAC1-9.322.0GLY-152.991105.258
THR-173.17295.738
GeldanamycinHSP90AB1-8.831.93GLY-1373.105-
PHE-1383.065-
EugenolESR1-5.231.21GLU-3531.791148.321
ARG-3942.885-

Conclusion

This study showed that the investigation of interactions between targets with drugs at the system-level as well as in the context of biological and disease networks could resulted in drugs and targets prioritization. By integrative systems biology approach, we identified thirteen drugs which targeted eight central proteins in PBMCs and pancreatic β-cells QQPPI networks and represented significant associations with diabetes. One drug (imatinib) is being explored in clinical trial for T1D, which shown the robustness of our strategy. Moreover, we prioritized drug-targets such as melatonin, resveratrol, eugenol, lapatinib, geldanamycin and azathioprine which interacted with ESR1, ERBB2, HSP90AB1 and RAC1, respectively and shown associations in diabetes treatment in experimental models of T1D. Lastly, the interaction of some drug-targets was predicted by molecular docking analysis. After further validation, these prioritized targets and drugs could be a potential candidate for the targeted therapy and facilitate the drug discovery for patients with T1D.

Acknowledgements

References

  • 1.

    Craig ME, Jefferies C, Dabelea D, Balde N, Seth A, Donaghue KC. Definition, epidemiology, and classification of diabetes in children and adolescents. Pediatr. Diabetes. 2014;15:4-17. [PubMed ID: 25182305].

  • 2.

    DiMeglio LA, Evans-Molina C, Oram RA. Type 1 diabetes. Lancet. 2018;391:2449-62. [PubMed ID: 29916386].

  • 3.

    Atkinson MA, Eisenbarth GS, Michels AW. Type 1 diabetes. Lancet. 2014;383:69-82. [PubMed ID: 23890997].

  • 4.

    Harris K, Boland C, Meade L, Battise D. Adjunctive therapy for glucose control in patients with type 1 diabetes. Diabetes Metab. Syndr. Obes. 2018;11:159-73. [PubMed ID: 29731652].

  • 5.

    Hartemann A, Bensimon G, Payan CA, Jacqueminet S, Bourron O, Nicolas N, Fonfrede M, Rosenzwajg M, Bernard C, Klatzmann D. Low-dose interleukin 2 in patients with type 1 diabetes: a phase 1/2 randomised, double-blind, placebo-controlled trial. Lancet Diabetes Endocrinol. 2013;1:295-305. [PubMed ID: 24622415].

  • 6.

    Skyler JS. Hope vs hype: where are we in type 1 diabetes? Diabetologia. 2018;61:509-16. [PubMed ID: 29275427].

  • 7.

    Sams-Dodd F. Is poor research the cause of the declining productivity of the pharmaceutical industry? An industry in need of a paradigm shift. Drug. Discov. Today. 2013;18:211-7. [PubMed ID: 23131208].

  • 8.

    Berger SI, Iyengar R. Role of systems pharmacology in understanding drug adverse events. Wiley Interdiscip. Rev. Syst. Biol. Med. 2011;3:129-35. [PubMed ID: 20803507].

  • 9.

    Eizirik DL, Sammeth M, Bouckenooghe T, Bottu G, Sisino G, Igoillo-Esteve M, Ortis F, Santin I, Colli ML, Barthson J. The human pancreatic islet transcriptome: expression of candidate genes for type 1 diabetes and the impact of pro-inflammatory cytokines. PLoS Genet. 2012;8:e1002552.

  • 10.

    Kaizer EC, Glaser CL, Chaussabel D, Banchereau J, Pascual V, White PC. Gene expression in peripheral blood mononuclear cells from children with diabetes. J. Clin. Endocrinol. Metab. 2007;92:3705-11. [PubMed ID: 17595242].

  • 11.

    Chuang HY, Lee E, Liu YT, Lee D, Ideker T. Network-based classification of breast cancer metastasis. Mol. Syst. Biol. 2007;3:140-50. [PubMed ID: 17940530].

  • 12.

    Pujana MA, Han J-DJ, Starita LM, Stevens KN, Tewari M, Ahn JS, Rennert G, Moreno V, Kirchhoff T, Gold B. Network modeling links breast cancer susceptibility and centrosome dysfunction. Nat. Genet. 2007;39:1338-49. [PubMed ID: 17922014].

  • 13.

    Taylor IW, Linding R, Warde-Farley D, Liu Y, Pesquita C, Faria D, Bull S, Pawson T, Morris Q, Wrana JL. Dynamic modularity in protein interaction networks predicts breast cancer outcome. Nat. Biotechnol. 2009;27:199-204. [PubMed ID: 19182785].

  • 14.

    Melak T, Gakkhar S. Comparative genome and network centrality analysis to identify drug targets of mycobacterium tuberculosis h37rv. Biomed. Res. Int. 2015;0.2015:1-10.

  • 15.

    Módos D, Bulusu KC, Fazekas D, Kubisch J, Brooks J, Marczell I, Szabó PM, Vellai T, Csermely P, Lenti K. Neighbours of cancer-related proteins have key influence on pathogenesis and could increase the drug target space for anticancer therapies. NPJ. Syst. Biol. Appl. 2017;3:1-13. [PubMed ID: 28649429].

  • 16.

    Mahboubi M, Azodi MZ, Tavirani MR, Mansouri V, Ahmadi NA, Hamdieh M, Tavirani MR, Gargari BN. Protein-Protein Interaction Analysis of Common Top Genes in Obsessive-Compulsive Disorder (OCD) and Schizophrenia: Towards New Drug Approach Obsessive-Compulsive disorder (OCD) and Schizophrenia Comorbidity Gene Analysis. Iran. J. Pharm. Res. 2018;17:173-86. [PubMed ID: 31086558].

  • 17.

    Piñero J, Berenstein A, Gonzalez-Perez A, Chernomoretz A, Furlong LI. Uncovering disease mechanisms through network biology in the era of Next Generation Sequencing. Sci. Rep. 2016;6:1-12. [PubMed ID: 28442746].

  • 18.

    Safari Alighiarloo N, Rezaei Tavirani M, Taghizadeh M, Tabatabaei SM, Namaki S. Analysis of protein-protein interactions network based on differentially expressed genes in cerebrospinal fluid for multiple sclerosis. Koomesh. 2018;20:81-8.

  • 19.

    Safari-Alighiarloo N, Taghizadeh M, Tabatabaei SM, Shahsavari S, Namaki S, Khodakarim S, Rezaei-Tavirani M. Identification of new key genes for type 1 diabetes through construction and analysis of protein–protein interaction networks based on blood and pancreatic islet transcriptomes. J. Diabetes. 2017;9:764-77. [PubMed ID: 27625010].

  • 20.

    Safari-Alighiarloo N, Rezaei-Tavirani M, Taghizadeh M, Tabatabaei SM, Namaki S. Network-based analysis of differentially expressed genes in cerebrospinal fluid (CSF) and blood reveals new candidate genes for multiple sclerosis. Peer J. 2016;4:e2775. [PubMed ID: 28028462].

  • 21.

    Safari-Alighiarloo N, Taghizadeh M, Tabatabaei SM, Namaki S, Rezaei-Tavirani M. Identification of common key genes and pathways between type 1 diabetes and multiple sclerosis using transcriptome and interactome analysis. Endocrine. 2020;68:81-92. [PubMed ID: 31912409].

  • 22.

    Csermely P, Korcsmáros T, Kiss HJ, London G, Nussinov R. Structure and dynamics of molecular networks: a novel paradigm of drug discovery: a comprehensive review. Pharmacol. Ther. 2013;138:333-408. [PubMed ID: 23384594].

  • 23.

    Peng Q, Schork N. Utility of network integrity methods in therapeutic target identification. Front. Genet. 2014;3:5-12.

  • 24.

    Kotlyar M, Fortney K, Jurisica I. Network-based characterization of drug-regulated genes, drug targets, and toxicity. Methods. 2012:57. 499-507.

  • 25.

    Kerrien S, Aranda B, Breuza L, Bridge A, Broackes-Carter F, Chen C, Duesbury M, Dumousseau M, Feuermann M, Hinz U. The IntAct molecular interaction database in 2012. Nucleic Acids Res. 2011;40:D841-D6. [PubMed ID: 22121220].

  • 26.

    Licata L, Briganti L, Peluso D, Perfetto L, Iannuccelli M, Galeota E, Sacco F, Palma A, Nardozza AP, Santonico E. MINT, the molecular interaction database: 2012 update. Nucleic Acids Res. 2011;40:D857-D61. [PubMed ID: 22096227].

  • 27.

    Xenarios I, Salwinski L, Duan XJ, Higney P, Kim SM, Eisenberg D. DIP, the Database of Interacting Proteins: a research tool for studying cellular networks of protein interactions. Nucleic. Acids Res. 2002;30:303-5. [PubMed ID: 11752321].

  • 28.

    Shannon P, Markiel A, Ozier O, Baliga NS, Wang JT, Ramage D, Amin N, Schwikowski B, Ideker T. Cytoscape: a software environment for integrated models of biomolecular interaction networks. Genome Res. 2003;13:2498-504. [PubMed ID: 14597658].

  • 29.

    Junker BH, Koschützki D, Schreiber F. Exploration of biological network centralities with CentiBiN. BMC. Bioinformatics. 2006;2015:7-219.

  • 30.

    Barabási A-L, Gulbahce N, Loscalzo J. Network medicine: a network-based approach to human disease. Nat. Rev. Genet. 2011;12:56-68. [PubMed ID: 21164525].

  • 31.

    Zhang A. Protein interaction networks: computational Analysis. Cambridge University Press; 2009.

  • 32.

    Lee JH, Gao J, Kosinski PA, Elliman SJ, Hughes TE, Gromada J, Kemp DM. Heat shock protein 90 (HSP90) inhibitors activate the heat shock factor 1 (HSF1) stress response pathway and improve glucose regulation in diabetic mice. Biochem. Biophys. Res. Commun. 2013;430:1109-13. [PubMed ID: 23261432].

  • 33.

    Al Trad B, Alkhateeb H, Alsmadi W, Al-Zoubi M. Eugenol ameliorates insulin resistance, oxidative stress and inflammation in high fat-diet/streptozotocin-induced diabetic rat. Life Sci. 2019;216:183-8. [PubMed ID: 30448265].

  • 34.

    Benter IF, Sarkhou F, Al-Khaldi AT, Chandrasekhar B, Attur S, Dhaunsi GS, Yousif MH, Akhtar S. The dual targeting of EGFR and ErbB2 with the inhibitor Lapatinib corrects high glucose-induced apoptosis and vascular dysfunction by opposing multiple diabetes-induced signaling changes. J. Drug Target. 2015;23:506-18. [PubMed ID: 26114862].

  • 35.

    Turanli B, Altay O, Borén J, Turkez H, Nielsen J, Uhlen M, Arga KY, Mardinoglu A. Systems biology based drug repositioning for development of cancer therapy. Semin. Cancer Biol. https://doi.org/10.1016/j.semcancer.2019.09.020 . 2019.

  • 36.

    Guo JH, Chen H, Ruan YC, Zhang XL, Zhang XH, Fok KL, Tsang LL, Yu MK, Huang WQ, Sun X. Glucose-induced electrical activities and insulin secretion in pancreatic islet β-cells are modulated by CFTR. Nat. Commun. 2014;5:4420. [PubMed ID: 25025956].

  • 37.

    Grishman EK, White PC, Savani RC. Toll-like receptors, the NLRP3 inflammasome, and interleukin-1β in the development and progression of type 1 diabetes. Pediatr. Res. 2012;71:626-32. [PubMed ID: 22337228].

  • 38.

    Morita S, Villalta SA, Feldman HC, Register AC, Rosenthal W, Hoffmann-Petersen IT, Mehdizadeh M, Ghosh R, Wang L, Colon-Negron K. Targeting ABL-IRE1α signaling spares ER-stressed pancreatic β cells to reverse autoimmune diabetes. Cell Metab. 2017;25:883-97. [PubMed ID: 28380378].

  • 39.

    Louvet C, Szot GL, Lang J, Lee MR, Martinier N, Bollag G, Zhu S, Weiss A, Bluestone JA. Tyrosine kinase inhibitors reverse type 1 diabetes in nonobese diabetic mice. Proc. Natl. Acad. Sci. USA. 2008;105:18895-900. [PubMed ID: 19015530].

  • 40.

    Catanuto P, Xia X, Pereira-Simon S, Elliot S. Estrogen receptor subtype ratio change protects against podocyte damage. Curr. Trends Endocinol. 2017;9:19-29. [PubMed ID: 29367812].

  • 41.

    Szkudelski T, Szkudelska K. Resveratrol and diabetes: from animal to human studies. Biochim. Biophys. Acta. 2015;1852:1145-54. [PubMed ID: 25445538].

  • 42.

    Li Y, Huang J, Yan Y, Liang J, Liang Q, Lu Y, Zhao L, Li H. Preventative effects of resveratrol and estradiol on streptozotocin-induced diabetes in ovariectomized mice and the related mechanisms. PloS One. 2018;13:e0204499. [PubMed ID: 30273360].

  • 43.

    del Río B, Pedrero JMG, Martínez-Campa C, Zuazua P, Lazo PS, Ramos S. Melatonin, an endogenous-specific inhibitor of estrogen receptor α via calmodulin. J. Biol. Chem. 2004;279:38294-302. [PubMed ID: 15229223].

  • 44.

    Peschke E, Wolgast S, Bazwinsky I, Pönicke K, Muhlbauer E. Increased melatonin synthesis in pineal glands of rats in streptozotocin induced type 1 diabetes. J. Pineal. Res. 2008;45:439-48. [PubMed ID: 18624957].

  • 45.

    Lin GJ, Huang SH, Chen SJ, Wang CH, Chang DM, Sytwu HK. Modulation by melatonin of the pathogenesis of inflammatory autoimmune diseases. Int. J. Mol. Sci. 2013;14:11742-66. [PubMed ID: 23727938].

  • 46.

    Lazaro I, Oguiza A, Recio C, Mallavia B, Madrigal-Matute J, Blanco J, Egido J, Martin-Ventura JL, Gomez-Guerrero C. Targeting HSP90 ameliorates nephropathy and atherosclerosis through suppression of NF-κB and STAT signaling pathways in diabetic mice. Diabetes. 2015;64:3600-13. [PubMed ID: 26116697].

  • 47.

    Vega VL, Charles W, Alexander LEC. Rescuing of deficient killing and phagocytic activities of macrophages derived from non-obese diabetic mice by treatment with geldanamycin or heat shock: potential clinical implications. Cell Stress Chaperones. 2011;16:573-81. [PubMed ID: 21626279].

  • 48.

    Yan X, Zhang G, Bie F, Lv Y, Ma Y, Ma M, Wang Y, Hao X, Yuan N, Jiang X. Eugenol inhibits oxidative phosphorylation and fatty acid oxidation via downregulation of c-Myc/PGC-1β/ERRα signaling pathway in MCF10A-ras cells. Sci. Rep. 2017;7:12920.

  • 49.

    Agostino NM, Chinchilli VM, Lynch CJ, Koszyk-Szewczyk A, Gingrich R, Sivik J, Drabick JJ. Effect of the tyrosine kinase inhibitors (sunitinib, sorafenib, dasatinib, and imatinib) on blood glucose levels in diabetic and nondiabetic patients in general clinical practice. J. Oncol. Pharm. Pract. 2011;17:197-202. [PubMed ID: 20685771].

  • 50.

    Karbownik A, Szałek E, Sobańska K, Klupczynska A, Plewa S, Grabowski T, Wolc A, Moch M, Kokot ZJ, Grześkowiak E. A pharmacokinetic study on lapatinib in type 2 diabetic rats. Pharmacol. Rep. 2018;70:191-5. [PubMed ID: 29471066].

  • 51.

    Roskoski Jr R. The ErbB/HER family of protein-tyrosine kinases and cancer. Pharmacol. Rep. 2014;79:34-74.

  • 52.

    Cook JJ, Hudson I, Harrison LC, Dean B, Colman PG, Werther G, Warne GL. Double-blind controlled trial of azathioprine in children with newly diagnosed type I diabetes. Diabetes. 1989;38:779-83. [PubMed ID: 2656346].

  • 53.

    Tiede I, Fritz G, Strand S, Poppe D, Dvorsky R, Strand D, Lehr HA, Wirtz S, Becker C, Atreya R. CD28-dependent Rac1 activation is the molecular target of azathioprine in primary human CD4 + T lymphocytes. J. Clin. Invest. 2003;111:1133-45. [PubMed ID: 12697733].

  • 54.

    Veluthakal R, Sidarala V, Kowluru A. NSC23766, a known inhibitor of Tiam1-Rac1 signaling module, prevents the onset of type 1 diabetes in the NOD mouse model. Cell Physiol. Biochem. 2016;39:760-7. [PubMed ID: 27467102].

  • 55.

    Harrison LC, Colman PG, Dean B, Baxter R, Martin F. Increase in remission rate in newly diagnosed type I diabetic subjects treated with azathioprine. Diabetes. 1985;34:1306-8. [PubMed ID: 3905463].

  • 56.

    Geliebter R, Chia D, Derrick K. SUN-275 Azathioprine for Tertiary Prevention of Diabetes in Patients with Newly Diagnosed Type 1 Diabetes. J. Endocr. Soc. 2019;3:275.