Animals
Sixty adult Wistar male rats, weighing between 250–300 g, were purchased from lab house of Iran University of Medical Sciences. They were kept in an under controlled temperature room (22 ± 0.5 °C) with 12-h light/dark cycle and had free access to food and water. This manuscript was prepared from supplementary data which obtained from research project with ethical code: IR.IAU.PS.REC.1398.348.
Drug
Curcumin and lead acetate were purchased from Sigma-Aldrich (USA) and dissolved freshly in normal saline just before administration.
Experimental design
Group 1 (control group) were administrated with normal saline (0.2mL/rat, i.p) for 21 days and Group 2 (lead treatment) received drinking water containing 0.075% of lead acetate for 21 days.
Groups 3, 4, and 5 concurrently were treated by drinking water containing 0.075% of lead acetate and curcumin with a dosage of 10, 20, 40, and 80 mg/kg, as intraperitoneally, respectively for 21 days.
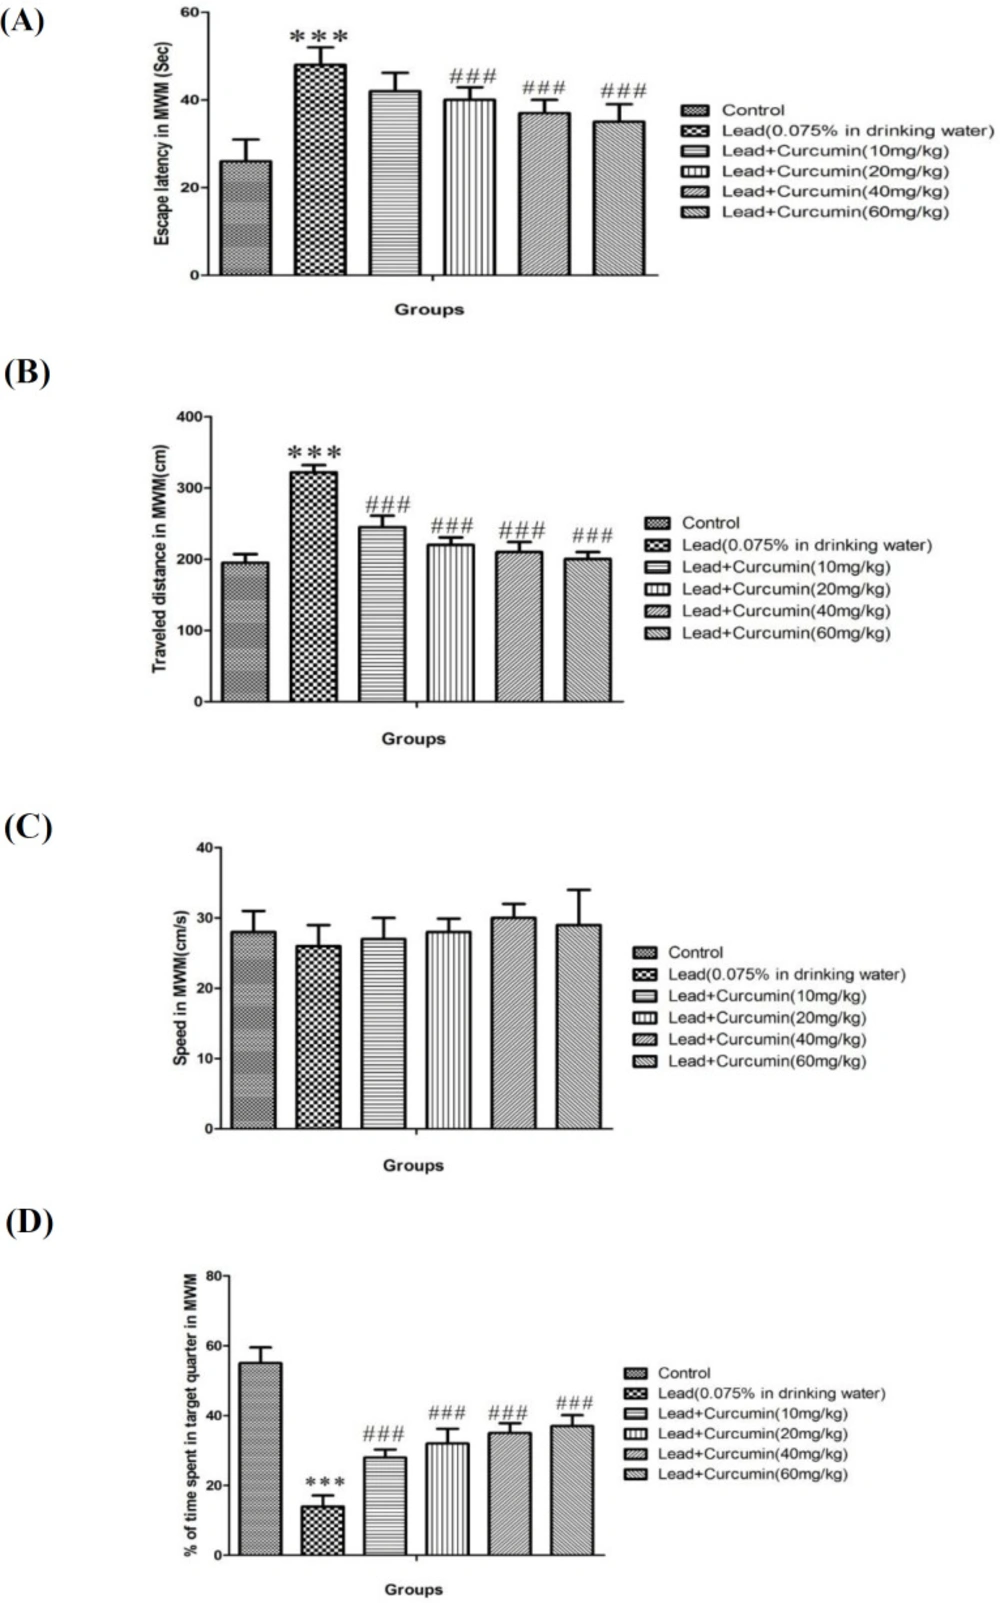
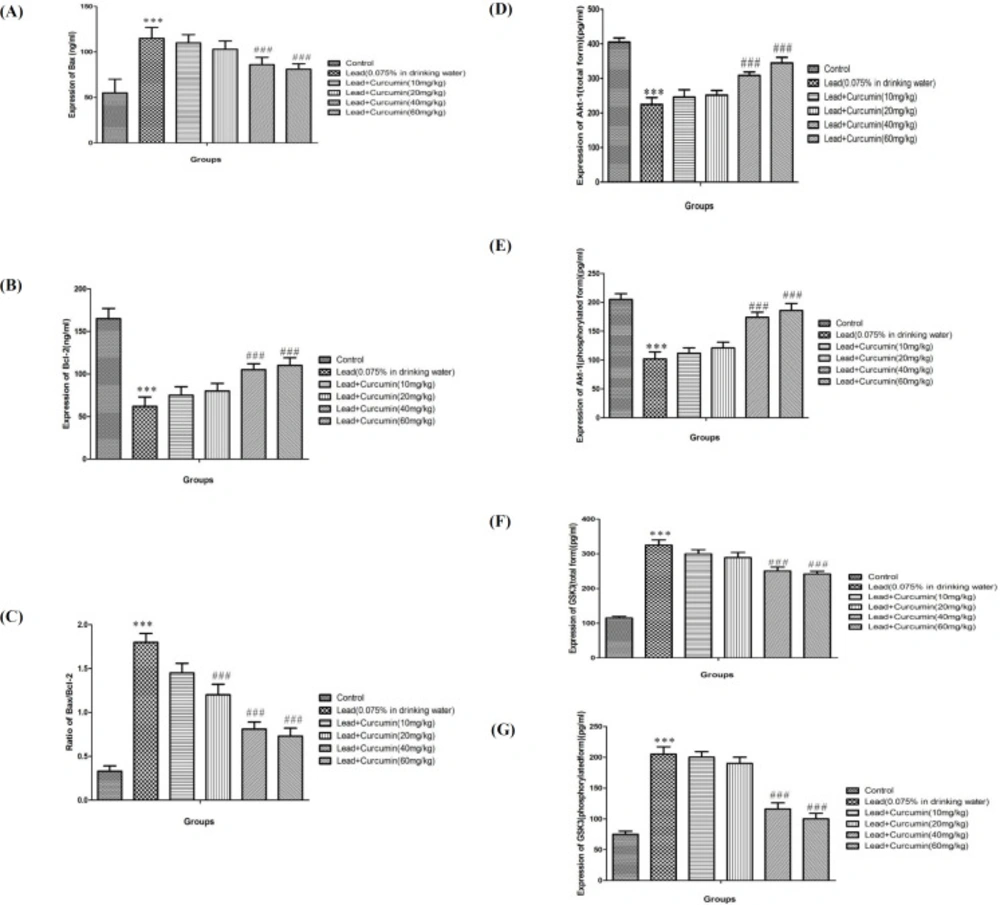
During the 17th and 21st day, Morris water maze (MWM) task, a standard behavioral method for evaluation of learning and memory, was done in the animals. After 22nd day all animals were sacrificed. Oxidative stress, inflammation and apoptosis were also evaluated in hippocampal tissues. Keeping in view the importance of Akt/GSK3 signaling in the effect of curcumin on lead-induced disturbances in the Akt/GSK3 signaling pathway was studied in hippocampal tissues.
Behavioral methods
morris water maze task(MWM)
MWM apparatus includes a black colored circular tank, filled with water, 160 cm in diameter and 90 cm in height, which was fixed in the center of the experimental lab. This equipment was divided into four quadrants (North, East, West, and South) and was filled with water to the height of 50 cm. The operator stays in the North-East part of the room. A disk on the platform with 15 cm diameter, which was hidden, was located 1 cm beneath the surface of the water. In the first 4 days of the experiment, which called training procedure, mentioned platform was randomly inserted persistently in one of the quarter. An automated infrared tracking system (CCTV B/W camera, SBC-300 (P), Samsung Electronics Co, Ltd, Korea) recorded the position of the experimented animal in the tank. The camera was mounted 2.4 m above the surface of the water (
22,
23).
Handling
On the first day before the start of the experiment, all of the rats one by one were positioned in the tank filling with 40 centigrade degree water, and room temperature (25 ± 2 ºC) and the experimenter guided the rat to swim and to reach to the quarter in which the mentioned platform was placed. In our experiment, the platform was situated in South-East quarter of a tank (
22,
23).
Training procedure
Some discriminate landmarks (such as a distinguish picture, window, door, etc.) as put in the extra maze in the room for spatial cues for learning about the platform’s position for animals. As mentioned above, the position of the platform was set up in the South-East quarter of the MWM tank with 25 cm distance from the edge of the tank, and 1 cm beneath the surface of the water. For evaluation of learning procedure, each rat experimented for 4 trials in a day for 4 days. Each animal was randomly located in from four quarters (North, East, West, and South) respectively. During the learning procedure if the rats found the platform within the 60 Sec, the trial would be automat closed by a computer, but if they could not reach and found the platform within 60 sec the trial automat would be stopped by the computer.In learning experiment, two parameters were evaluated.
1. The time of escape latency characterized by time to find the hidden platform
2. Traveled distance which was confirmed by the distance each animal spent to reach and find the hidden platform.
In memory assessment procedure, on the fifth day (probe day), the platform was removed and animal randomly was terrified of the water from one of the above-mentioned directions (almost East) and the percentage of presence of animal in target quarter (South-East quarter) was recorded and calculated (
22-
26).
Mitochondrial preparations
The animals were anesthetized using sodium thiopental (50 mg/kg, i.p) and the hippocampus was isolated from each rat. The isolated tissues were homogenized in cold homogenization buffer (25 mmol/L 4-morpholinepropanesulfonic acid, 400 mmol/L sucrose, 4 mmol/L magnesium chloride (MgCl
2), 0.05 mmol/L ethylene glycol tetraacetic acid (EGTA), pH = 7.3) and the homogenized tissues were centrifuged at 450 ×
g for 10 min. The supernatants obtained were re-centrifuged at 12000 ×
g for 10 min. Finally, the sediments were re-suspended in homogenization buffer and stored at 0 °C. Total mitochondrial proteins in tissues were determined using a Dc protein assay kit (Bio-Rad). Briefly; Bradford reagent (1 part Bradford: 4 parts dH
2O) was added to serial dilution series (0.1-1.0 mg/mL) of a known protein sample concentration; e.g., bovine serum albumin (BSA), dissolved in homogenization buffer. These serial dilution series were prepared and used for providing a standard curve. On the other hand 10, 15, 20, 25, and 30 μL of the protein extract (homogenized cell solutions) were added to multiple wells. Bradford reagent was also added to each well. The density of colors of all wells was read by the plate reader at 630 nm. Finally, by using the standard curve, protein quantity in the extracts was obtained. These homogenized cell solutions, containing mitochondria of hippocampal cells, were analyzed for the measurement of oxidative stress and inflammatory markers (
23,
27-
30).
Measurement of oxidative stress parameters
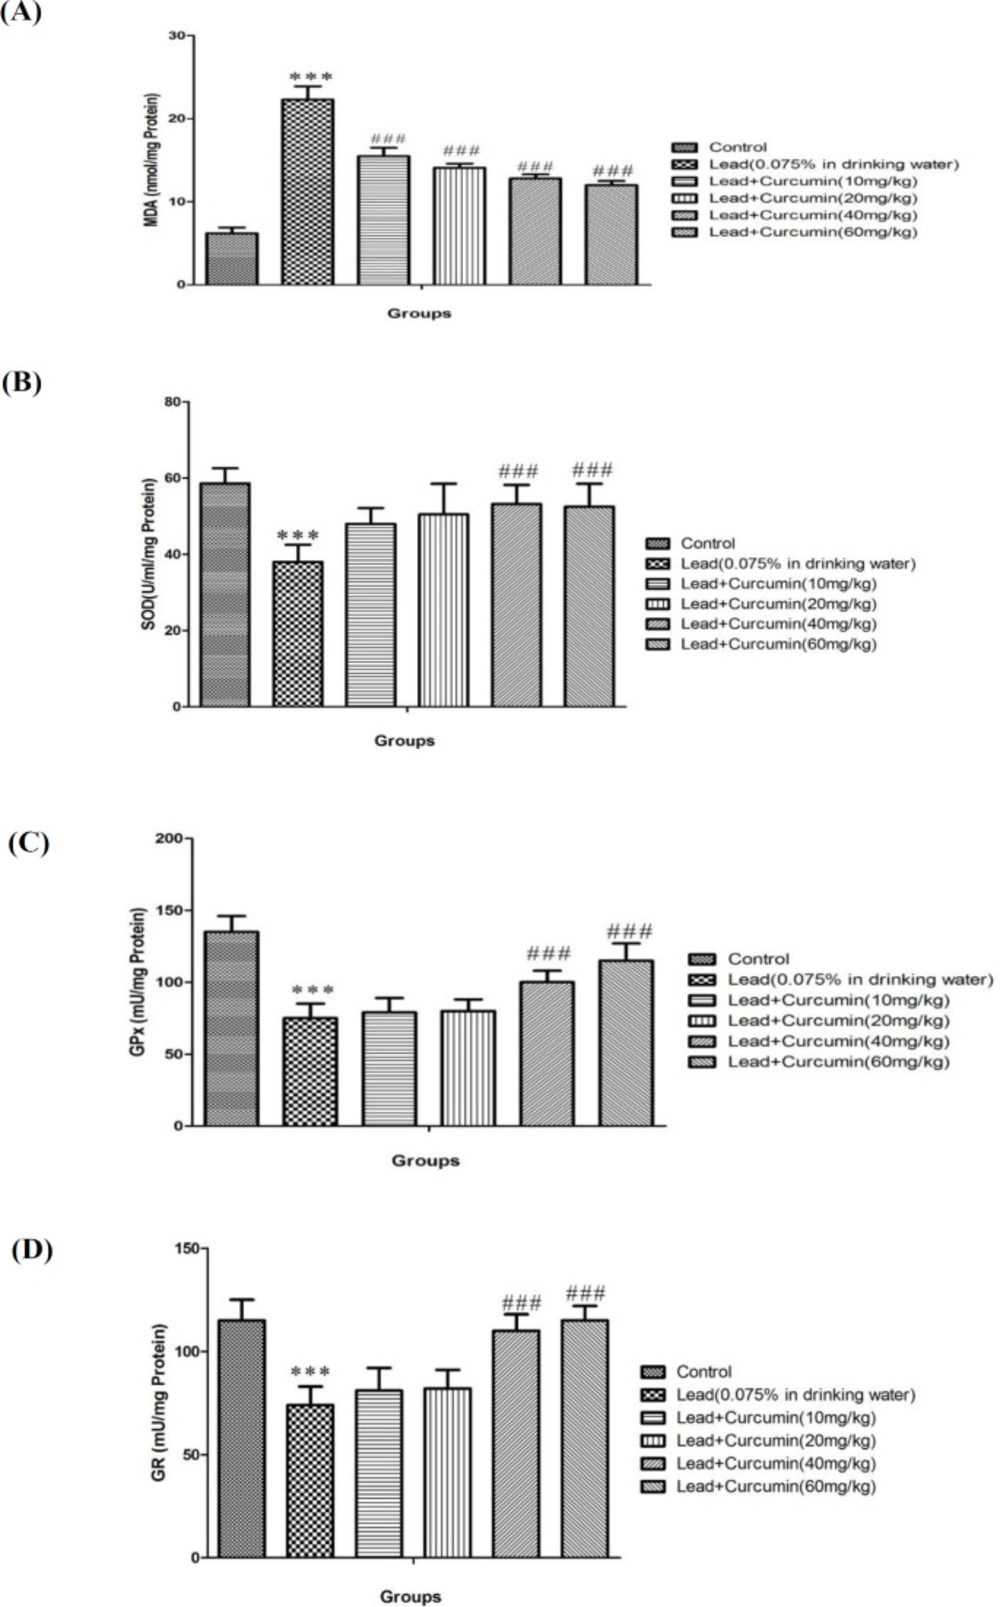
Determination of lipid peroxidation
For assessment of lipid peroxidation, malondialdehyde (MDA) a natural by-product was assessed. Briefly, 100 μL of SDS lysis solution was added to wells containing (100 μL) of sample solution or MDA standard. After shaking and incubation of these wells, 250 μL of thiobarbituric acid (TBA) reagent was added to each well and incubated at 95 °C for 45-60 min. Next, the tubes were centrifuged at 1000 × g for 15 min and 300 μL of n-Butanol was added to 300 μL of the supernatant. Then, the tubes were centrifuged for 5 min at 10,000 × g. Finally, the absorbance was read at 532 nm and the results obtained were expressed as nmol/mg of protein (
27,
30-
32).
Determination of GSH (Glutathione) and GSSG (Glutathione disulfide)
For measuring GSH (Glutathione) and GSSG (Glutathione disulfide) levels, 25 μL of the IX glutathione reductase solution and 25 μL of the IX NADPH solution were added to a 96-well plate containing a standard solution of glutathione or a sample of homogenized solution. Then, 50 μL of the IX Chromogen was added to each well and mixed vigorously. Finally, the absorbance was read at 405 nm for each GSSG/GSH standard and sample. Using the standard curve, the levels of GSSG/GSH were quantified and expressed as nmol/mg of protein (
27,
30,
33).
Determination of manganese superoxide dismutase (MnSOD) activity
The previously described leadod was used to assess SOD activity (
27,
34). SOD activity was measured using the following equation:
Determination of glutathione peroxidase (GPx) activity
GPx activity was assessed as described previously (
27,
34). It was measured based on a change in absorbance [ΔA340/min] by the following equation:
ΔA340/min = A340nm (Start) A340nm (Stop)/Reaction time (min), any change in the absorbance is directly proportional to GPx activity.
GPx activity: ΔA340/min × Reaction volume (mL) × Dilution factor of the original sample/Extinction coefficient for NADPH at 340 nm× Volumes of the tested sample. Results were expressed as mU/mg protein (
27,
34).
Determination of and glutathione reductase (GR) activity
GR activity was assessed as described previously (
27,
34,
35). It was measured based on a change in absorbance [ΔA340/min] by the following equation:
ΔA340/min= A340nm (Start) A340nm (Stop)/Reaction time (min), any change in the absorbance is directly proportional to GR activity.
GR activity: ΔA340/min × Reaction volume (mL) × Dilution factor of the original sample/Extinction coefficient for NADPH at 340 nm× Volumes of the tested sample. Results were expressed as mU/mg protein (
27,
35).
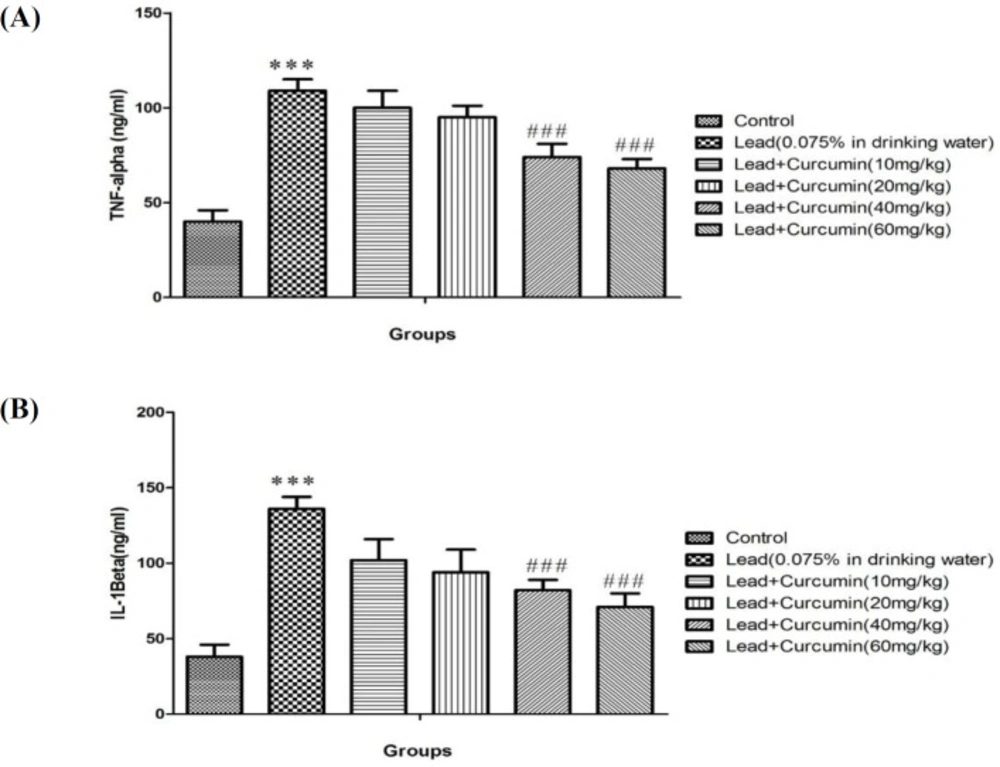
Determination of protein expression alteration
Concentrations (expression of protein) of Akt or GSK3 (total and phosphorylated), TNF-α, IL-1β,
Bax, and
Bcl-2 was measured in cell lysate of hippocampal tissue and for this part commercially available ELISA kit (Genzyme Diagnostics, Cambridge, U.S.A) was used. Briefly, the wells containing sheep anti-rat BDNF,CREB (total and phosphorylated), IL-1β and TNF-α polyclonal antibody (Sigma Chemical Co., Poole, and Dorset, UK) were washed three times with washing buffer (0.5 mol/L of Sodium chloride (NaCl), 2.5 mmol/L sodium dihydrogen phosphate (NaH
2PO
4), 7.5 mmol/L Na
2HPO
4, 0.1% Tween 20, pH 7.2). Then, 100 mL of 1% (w/v) ovalbumin (Sigma Chemical Co., Poole, Dorset, UK) solution was added to each well and incubated at 37 °C for 1 hr. Following three washes, 100 mL of samples and standards were added to each well and incubated at 48 °C for 20 h. After three washes, 100 mL of the biotinylated sheep anti-rat IL-1β or TNF-α antibody (1: 1000 dilutions in washing buffer containing 1% sheep serum, Sigma Chemical Co., Poole, and Dorset, UK) was added to each well. Next, after 1-hour incubation and three washes, 100 mL avidin-HRP (Dako Ltd, UK) (1:5000 dilution in wash buffer) was added to each well and the plate was incubated for 15 min. After washing three times, 100 mL of TMB substrate solution (Dako Ltd., UK) was added to each well and then incubated for 10 min at room temperature. Then, 100 mL of 1 mol/L H
2SO
4 was added and absorbance was read at 450 nm. The results were expressed as ng IL-1β/mL or TNF-α/mL or
Bax and
Bcl-2 of suspension of hippocampus tissues and about the Akt or GSK3 (total and phosphorylated) were reported as pg/mL of suspension of hippocampus tissues (
36-
39)
Statistical analysis
The data were analyzed by GraphPad PRISM v.6 Software and averaged in every experimental group and expressed as Means ± Standard error of the means (SEM). Then, the differences between control and treatment groups were evaluated by ANOVA. To evaluate the severity of the behaviors, the differences between averages in each group were compared using the Tukey test at a significant level of (P < 0.001).