Cloning, expression, and purification of IMe-AGAP
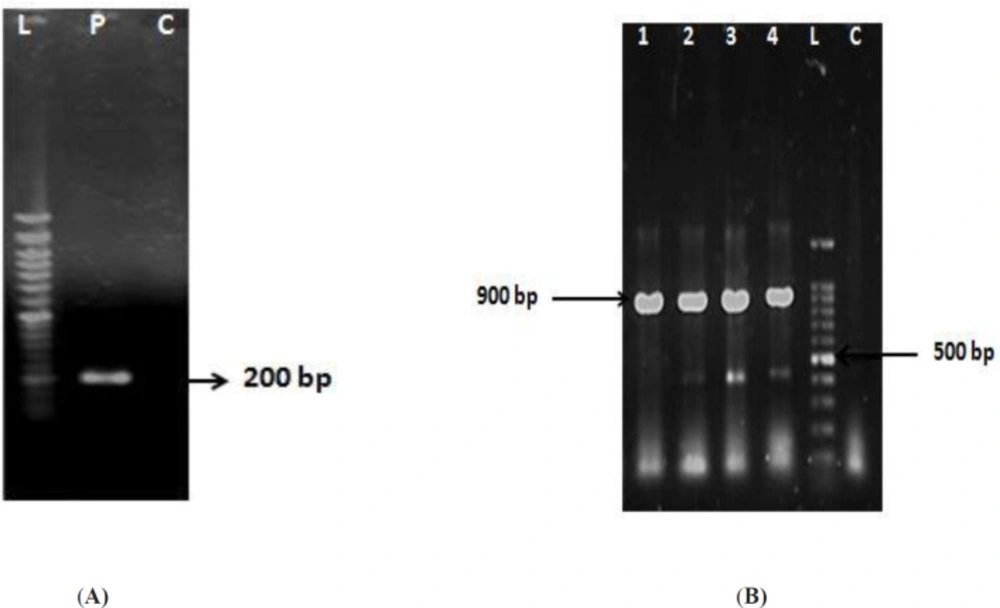
IMe-AGAP gene was amplified and cloned in the corresponding site of pET32b (
Figure 1A). The recombinant vector was verified by PCR (
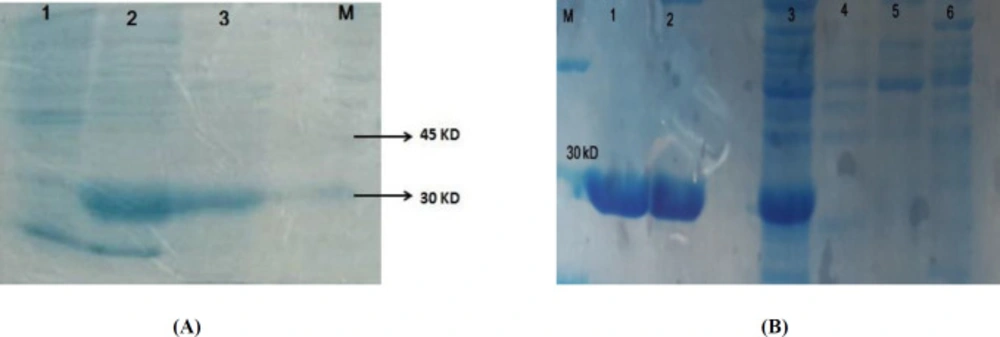
Figure 1B) and sequencing. Expression of soluble recombinant protein was analyzed in 12% SDS-PAGE. In comparison with the induced cells and non-induced cells, one band about 26 kD was seen that was calculated theoretically (total weight of recombinant protein~7.3 kD and thioredoxin as a fusion part of vector~ 18.5 kD). Most of the recombinant protein was detected in soluble fraction (
Figure 2A). The recombinant protein was purified by Ni-NTA column that the existence of the His-tag on IMe-AGAP was indicated (
Figure 2B).
Comparison of toxin protein sequences
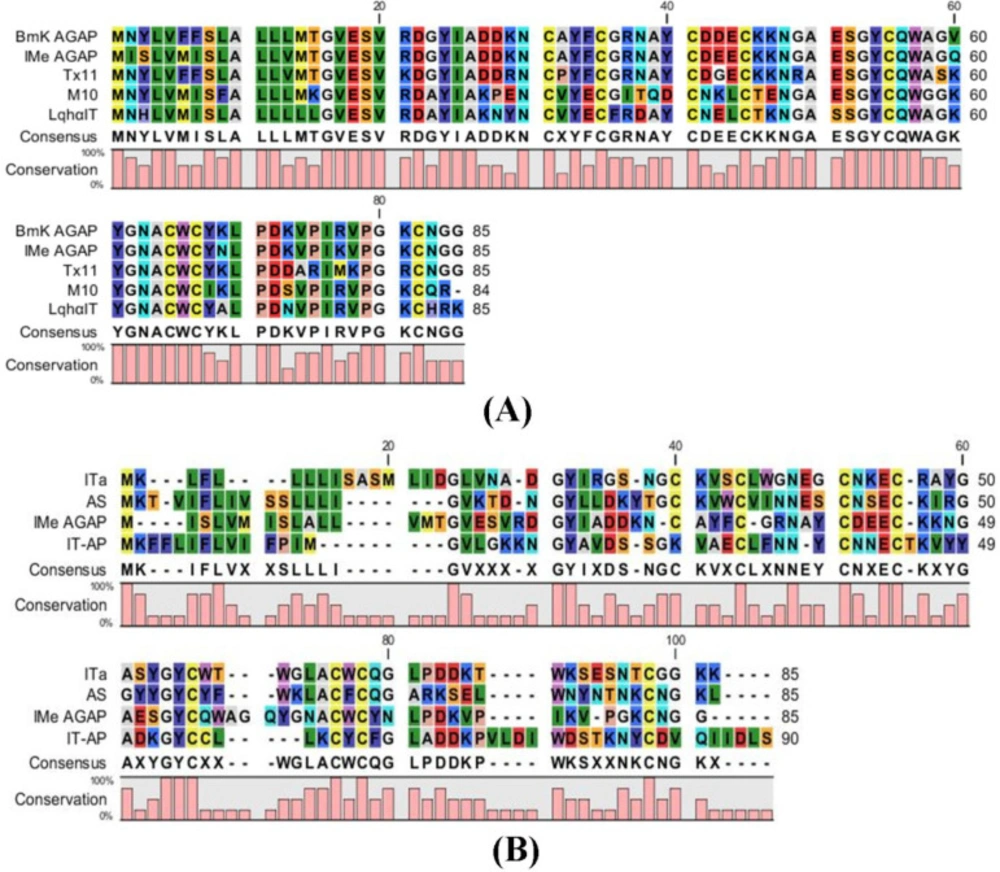
Comparative studies of peptide sequences were done to find the structure and function of IMe-AGAP. Comparison of IMe-AGAP protein sequence with α-toxins (BmKAGAP, M10, TX11, and LqhαIT) and β-toxins (BmKIT-AP, BmKITa and BmKAS) was performed by CLC software and showed the high similarity of IMe-AGAP with alpha toxins compared with beta toxins. Alpha toxins contain 60-72 amino acids in mature form. The SignalP 4.1 server revealed that the signal peptides of toxins are about 18-22 amino acids. The similarity between whole IMe-AGAP and BmKAGAP (along with signal peptide) sequence protein was calculated 92%, although the similarity of the mature peptide sequences is about 96%. Four residues of signal peptides [1-19] are different in BmKAGAP and IMe-AGAP which are respectively; Asp/Ile [2], Tyr/Ser [3], Phe/Met [6], and Phe/Ile [7]. The regions encoding the mature peptide of two toxins are different in three amino acids. Polar negatively charged aspartic acid [43], nonpolar valine [60], and polar positively charged lysine [69] in the BmKAGAP peptide changed by polar negatively charged glutamic acid [43], polar glutamine [60], and polar asparagine [69] amino acids in the IMe-AGAP peptide (
Figure 3).
Disulfide bonds in cysteine amino acids play an important role in toxin folding and are conserved in alpha and beta toxins. Results of DIANNA server showed that IMe-AGAP disulfide bonds are similar to BmKAGAP peptide. The disulfide bonds are formed between 12-63, 16-36, 22-46, and 26-48 cysteine residues (
Table 3).
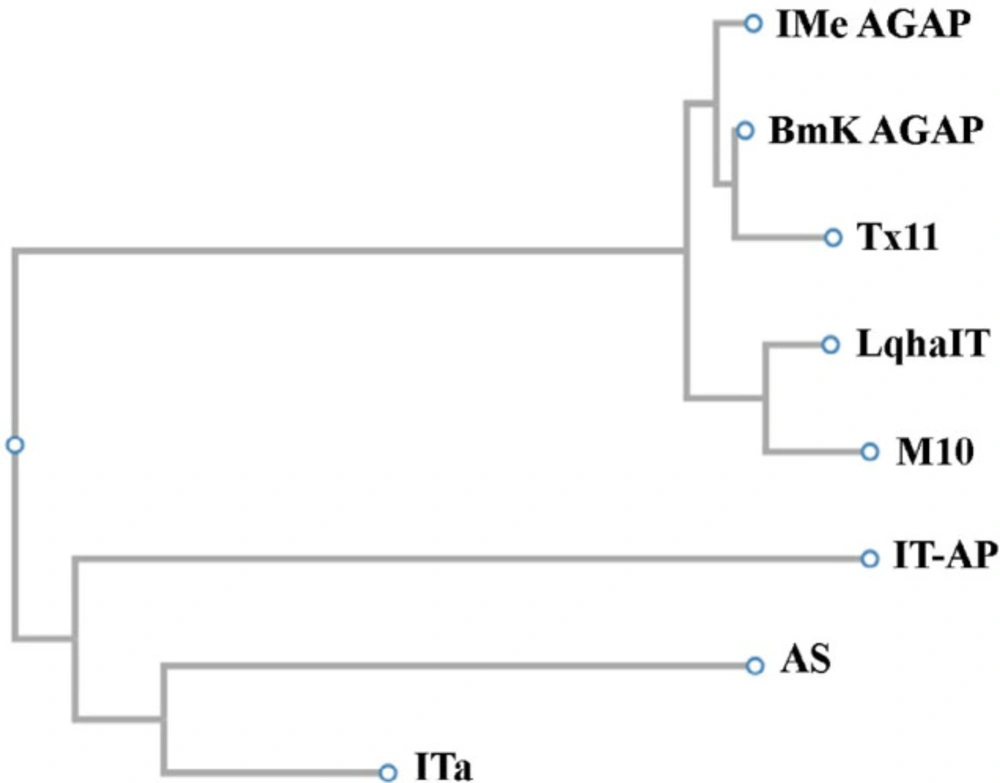
Phylogenetic studies between some α-toxins showed that IMe-AGAP from
Mesobuthus eupeus scorpion and BmKAGAP toxin from
Buthus martensii are in a branch of the evolutionary tree. ITα and AS toxins both isolated from
Mesobuthus martensii scorpion are very similar, these toxins were created from an ancestral gene. M10 and LqhαIT which are isolated from
Mesobuthus martensii and
Leiurus quinquestriatus hebraeus scorpion respectively are a branch of the evolutionary tree so these toxins can be derived from an ancestral gene (
Figure 4). These results are consistent with taxonomy data in NCBI website.
3D structure determination and comparison analysis
The three-dimensional structures of toxins were determined by CPHmodel and phyre2 web servers and showed that both alpha and beta toxins bind to Na
+ channel despite different amino acids in their structure. These toxins have a protected Knottin domain. Knottin domain is formed when the III-VI disulfide bridge passes between disulfide bonds of I-IV and II-V cysteines. Structural evaluation of modeled structures was performed by using RAMPAGE web server Ramachandran plots (
Table 4).
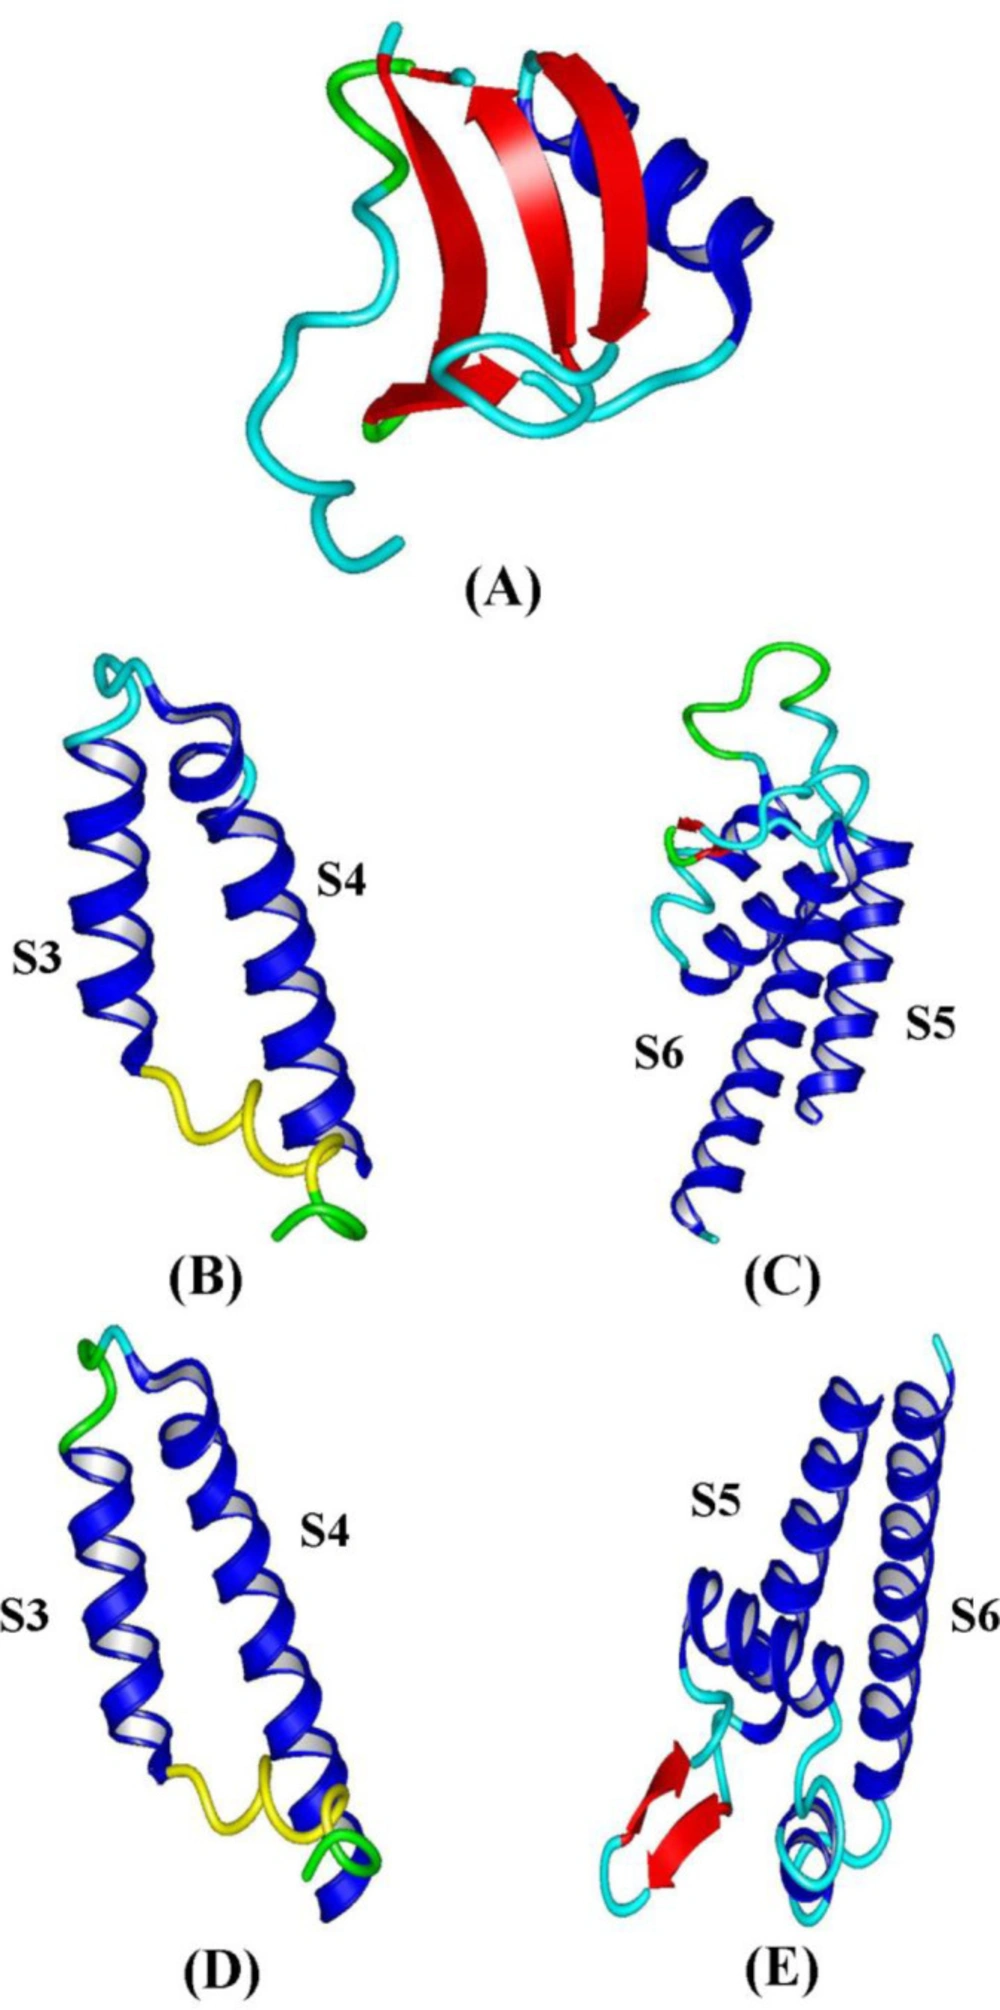
Phyre2 web server was used to the prediction of the structure of S3-S4 and S5-S6 segments in NaV1.8 and NaV1.9 sodium channels. S3-S4 segment has two transmembrane alpha-helices and one extracellular short loop. S5-S6 segment has also two transmembrane alpha-helices, one extracellular alpha-helix with two short loops. Toxins and sodium channels structure is shown in
Figure 5.
The results of IMe-AGAP and alpha toxins structural comparison revealed that the IMe-AGAP has the most similarity (93/85%) with BmKAGAP and the lowest similarity (67.74%) with BmKM10. The distance between structures is in positions Glu [41]/IMe-AGAP and Val [41]/BmKAGAP, Ile [18]/IMe-AGAP and Gly [39]/BmKM10, Glu [41] and Pro [56]/IMe-AGAP and Lys [41] and Arg [56]/BmKTX11, Ala [39] and Gly [65,66] /IMe-AGAP and Trp [38] ,Arg [65] and Lys [66] /Lqα-IT. These results are shown in
Table 5.
Docking analysis
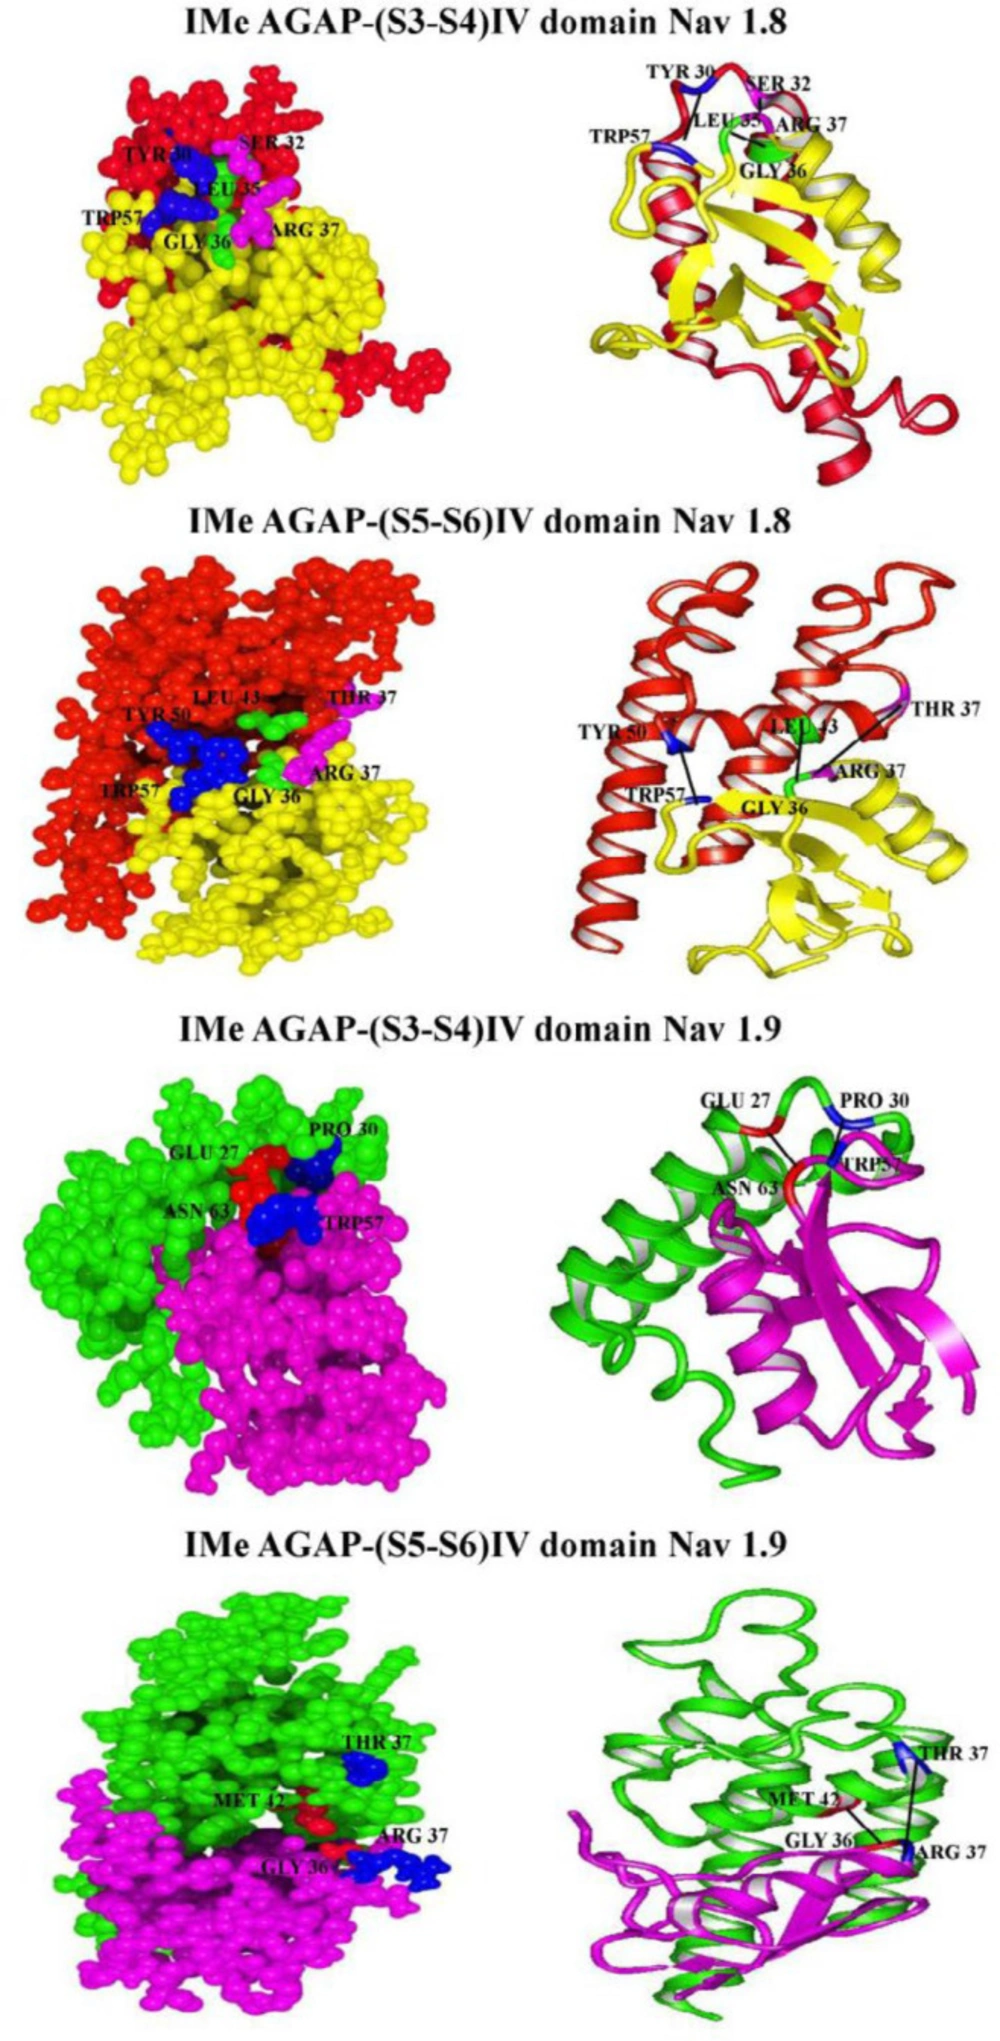
To investigate the interactions between IMe-AGAP and IV domain of sodium channels, we used hex server (
Figure 6). The lowest free energy of interaction and also the best tendency interaction to the ligand was obtained.
Table 6 shows residues involved in hydrogen bonds and hydrophobic interactions between IMe-AGAP and IV domain, and also interaction between total energies and bond lengths. The docking results between IMe-AGAP and Na1.8 showed that two hydrogen bonds, Trp [57] – Tyr [50] and Arg [37] – Thr [37], in addition to one hydrophobic interaction, Gly [36] – Leu [43] are formed in IMe-AGAP-IVS5-S6 complex. The binding energy of these interactions is -847.4 j/mol. The same results were seen between IVS3-S4 domain of channel and toxin. In IMe-AGAP-IVS3-S4 domain complex, two hydrogen bonds, Tyr [30] - Trp [57] and Ser [32] - Arg [37], in addition to one hydrophobic interaction, Leu [35] - Gly [36], are formed. These interactions have a binding energy about -943.1 j/mol that is stronger than S5-S6 domain and IMe-AGAP interactions.
Interaction analysis of Na1.9 channel and IMe-AGAP only showed two hydrogen bonds between Glu27 and Pro30 in S3-S4 domain with Asn 63 and Trp 57 in toxin, respectively. The binding energy of these interactions is about -431.8 j/mol. In IMe-AGAP-IVS5-S6 complex, one hydrogen bond, Arg 37 - Thr 37 and one hydrophobic interaction, Gly 36 - Met 42 are formed, that have the binding energy about -518 j/mol. Therefore, in Na1.9 channel, the interaction of S5-S6 domain with toxin is stronger than S3-S4 domain.
| number access | sodium channels |
|---|
| Q9Y5Y9 | Sodium channel protein type 10 subunit alpha (NaV1.8) |
| Q9UI33 | Sodium channel protein type 11 subunit alpha (NaV1.9) |
| Toxins | Toxins group | number access | Species |
|---|
| IMe-AGAP | α- toxin | AJF23104.1 | Mesobuthus eupeus |
| BmK-AGAP | α- toxin | Q95P69 | Mesobuthus martensii |
| BmK-AS | β-toxin | Q9UAC9 | Mesobuthus martensii |
| BmK-M10 | α- toxin | O61705 | Mesobuthus martensii |
| BmK-ITα | β-toxin | Q9XY87 | Mesobuthus martensii |
| BmK-IT-AP | β-toxin | O77091 | Mesobuthus martensii |
| BmK-TX11 | α- toxin | 55741121 | Mesobuthus martensii |
| LqhαIT | α- toxin | 134374 | Leiurus quinquestriatus hebraeus |
| Cysteine position | Distance | Bond | Score |
|---|
| 12 - 63 | 51 | ADDKNCAYFCG - KVPGKCNGGXX | 0.99806 |
| 16 - 36 | 20 | NCAYFCGRNAY - AESGYCQWAGQ | 0.99911 |
| 22 - 46 | 24 | GRNAYCDEECK - QYGNACWCYNL | 0.99728 |
| 26 - 48 | 22 | YCDEECKKNGA - GNACWCYNLPD | 0.9952 |
| Toxins | Amino acid in most favored regions (%) | Amino acid in allowed regions (%) | Amino acid in outlier regions (%) |
|---|
| IMe-AGAP | 98.4 | 1.6 | 0.0 |
| BmKAGAP | 90.6 | 6.2 | 3.1 |
| TX11 | 85.9 | 10.9 | 3.1 |
| M10 | 88.7 | 4.8 | 6.5 |
| LqhαIT | 88.7 | 9.7 | 1.6 |
| AS | 88.1 | 10.2 | 1.7 |
| ITα | 96.6 | 3.4 | 0.0 |
| IT-AP | 95.7 | 4.3 | 0.0 |
| similarity (%) | RMSD | |
|---|
| 93.85 | 0.974 A0 | IMe-AGAP – BmKAGAP |
| 78.46 | 0.959 A0 | IMe-AGAP - TX11 |
| 72.31 | 1.495 A0 | IMe-AGAP - Lqα-IT |
| 67.74 | 1.149 A0 | IMe-AGAP - M10 |
| Energy (j/mol) | Amino acids involved in interaction | Bond distance | Bond type |
|---|
| IMe-AGAP-(S3-S4) IV domain 1.8 | - 943.1 | NaV 1.8 – AGAPTyr 30 – Trp 57Ser 32 – Arg 37Leu 35 – Gly 36 | 9 A09 A012.5 A0 | Hydrogen (O-N)Hydrogen (O-N) Hydrophobic (C-H) |
| IMe-AGAP- (S5-S6)IV domain 1.8 | - 847.4 | NaV1.8 – AGAPThr 50 – Trp 57Leu 43 – Gly 36Thr 37 – Arg 37 | 7.3 A09.8 A014.9 A0 | Hydrogen (O-N)Hydrophobic (C-H)Hydrogen (O-N) |
| IMe-AGAP- (S3-S4) IV domain 1.9 | - 431.8 | NaV1.9 – AGAPGlu 27 – Asn 63Pro 30 – Trp 57 | 6.52 A08.22 A0 | Hydrogen (O-N)Hydrogen(O-N) |
| IMe-AGAP- (S5-S6) IV domain 1.9 | - 518.3 | NaV1.9 - AGAPThr 37 – Arg 37Met 42 – Gly 36 | 12.51 A07.78 A0 | Hydrogen (O-N)Hydrophobic (S-H) |
(A) Amplification of IMe-AGAP gene with product size of ~ 200 bp is seen in P line. L: 50 bp DNA ladder. (B) Results of colony-PCR with T7 promoter primer of vector and reverse primer of gene. L: 100 bp DNA ladder, 1-4: positive clones with size band ~ 900 bp, C: Original vector
(A) Expression of IMe-AGAP protein in E. coli Bl21 strain. Lane 1 is pre-induction culture, lane 2: post- induction soluble form and lane 3 is insoluble fraction of protein extraction. A band around 30 kD is seen in 2 and 3 lines. (B) Purification of IMe-AGAP protein with Ni-NTA column, 1 and 2 are purified elutions. 3 is pre-purification sample. 4 and 5 washing buffer and 6 is sample after purification
Homology analysis of toxin protein sequence performed by CLC Main work bench 5 software. (A) Comparison of IMe-AGAP and alpha toxins protein sequence. (B) Comparison of IMe-AGAP and beta toxin protein sequences
Results of phylogenetic studies that have been achieved by Clustal w server
The three-dimensional structures obtained by Phyre2 and CPHmodel. (A) Analgesic toxins. (B) (S3-S4) IV domain NaV1.9. (C) (S5-S6) IV domain NaV1.9. (D) (S3-S4) IV domain NaV1.8. (E) (S5-S6) IV domain NaV1.8
Ribbon and ball models of IMe-AGAP-sodium channels IV domain complexes. Whole backbones of complexes are shown. The amino acid residues involved in interaction between IMe-AGAP - sodium channels IV are indicated