Loading moxifloxacin hydrochloride into hydrophobic nanoparticles results in low encapsulation efficiency (
38). To solve this problem, PLGA nanoparticles were prepared using various techniques and altering formulation parameters such as a drug to polymer ratio (D:P) and surfactant (PVA) concentration, and optimized formulations for ophthalmic delivery were developed.
Drug Excipients Compatibility Studies
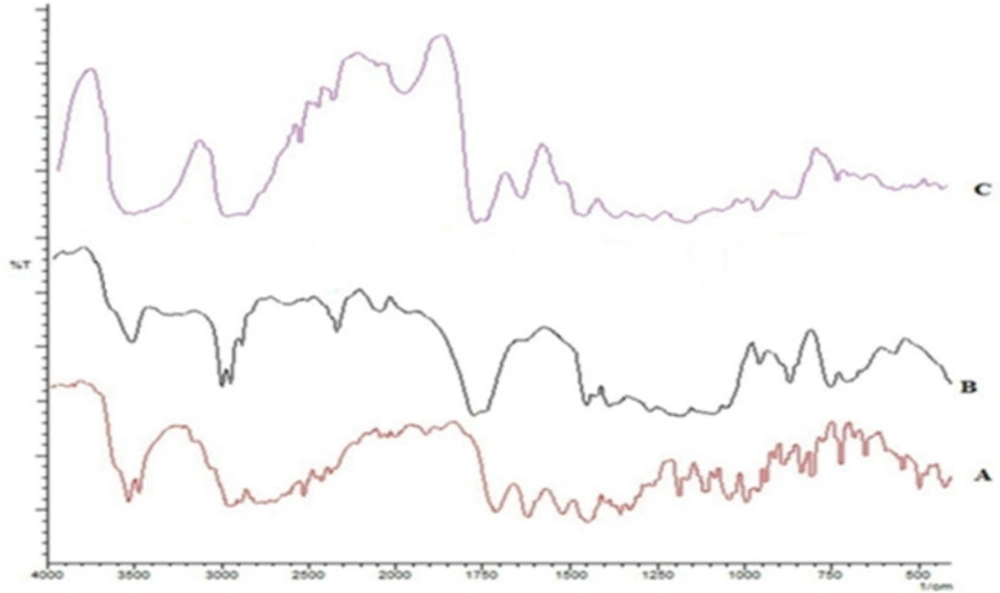
An interaction between MX with PLGA was assessed through FTIR spectroscopy. The spectra are shown in
Figure 1. The spectrum of MX gave characteristic peaks at 1706 cm
-1 due to C=O stretching in the carboxylic acid group, C-N stretching at 1350 cm
-1, and 1620, 1520, and 1460 cm
-1 owing to aromatic C=C stretching. PLGA characteristic bands appeared at 1765 cm
-1 for carbonyl C=O stretching, at1180 cm
-1 for C-O stretching and at 956 cm
-1for OH bending. The presence of peaks for each of these characteristic groups in the spectrum for a 1:1 physical mixture authenticates the lack of any interaction or incompatibility of the drug with the excipients used.
Particle Size, PDI, and Zeta Potential
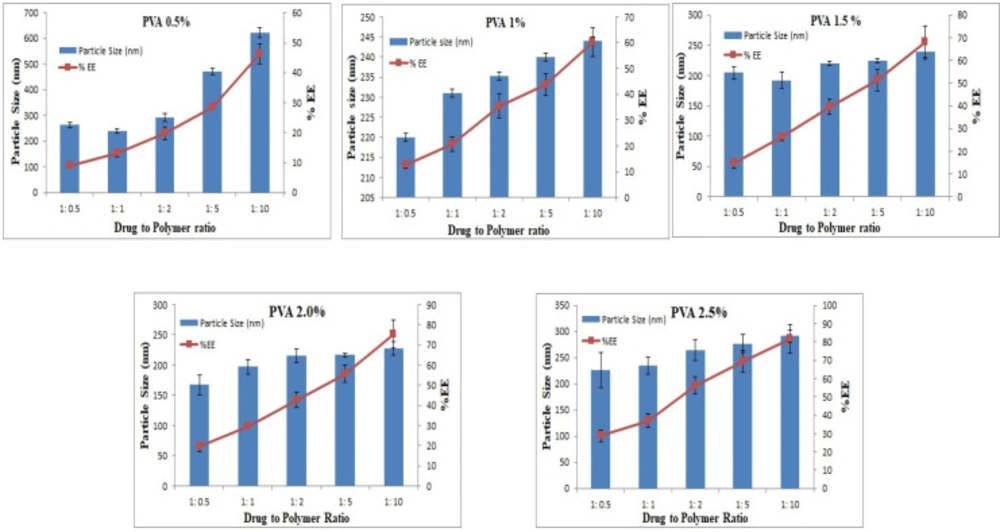
Small-sized particles are usually preferred in ophthalmic delivery, since larger particles cause discomfort and irritation. The mean sizes of the prepared formulations ranged from 167.4 - 622.4 nm. The particle size increased as D:P was increased from 1:1 to 1:10. Increasing the polymer concentration increases the viscosity of the external phase of the primary emulsion which results in larger primary emulsion droplets in the w/o/w emulsion and resistance to size reduction to the nanoparticle level (
39). Larger particles were produced with 0.5% w/v PVA, and the size decreased with an increase in the PVA concentration. For instance, 220, 204, and 167 nm particles were produced with 1, 1.5, and 2% w/v PVA, respectively. However, at 2.5% PVA concentration, the particle size increased to 227 nm, as shown in
Figure 2. The results presented here are in accordance with previously reported results, although only two levels for the polymer and PVA were studied (
40).
The polydispersity index (PDI) was low for each of the formulations, over the range of 0.09-0.48. PDI is a measure of homogeneity and uniformity of the particle size and particles ranging between 0.15–0.3 are considered homogeneous (
41).
The zeta potential results revealed that each type of nanoparticle carried a negative charge, ranging from -1.3 to -14.54 mV. The negative charge on PLGA nanoparticles is due to the presence of carboxylic end groups on the ends of each PLGA backbone (
39).
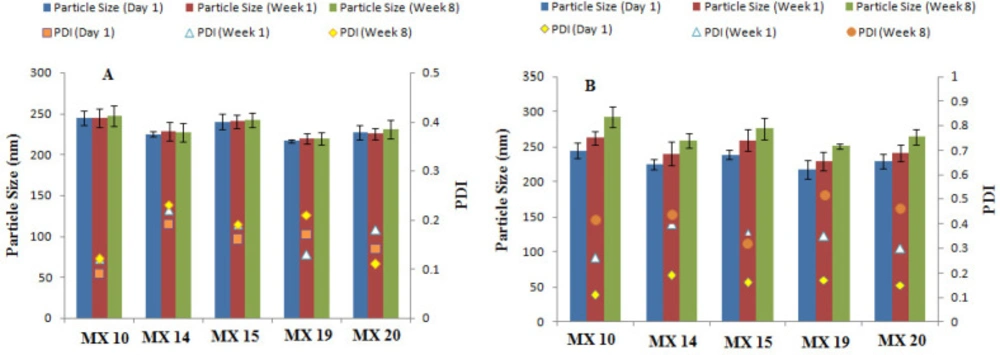
Stability Studies
Stability studies of the freeze-dried nanoparticles stored at refrigerator temperature (4-8 °C) revealed no significant changes in particle size or PDI when stored for 2 months (
Figure 3) as low temperatures decrease the kinetic energy and thus inhibit particle aggregation (
42). Upon storage at room temperature, a significant change in particle size and PDI were detected, thus suggesting storage of nanosuspensions at 4-8°C to prevent any changes in the nanoparticle size and PDI.
X-Ray Diffractometry
XRD spectra of the freeze-dried nanoparticles showed no intensity peaks for the drug, although the broad peaks associated with PLGA and PVA are evident, suggesting the lack of crystalline drug in the polymeric nanoparticles or that the drug is molecularly dispersed in the polymer matrix (
Figure 4). Although amorphous polymers show only broad halos in diffractograms (
43), the multiple broad peaks in
Figure 4, confirms that PLGA is a semi-crystalline polymer (
44). The height of the PLGA peak is diminished in
Figure 4D because the level of PLGA in the mixture is less than in the pure PLGA.
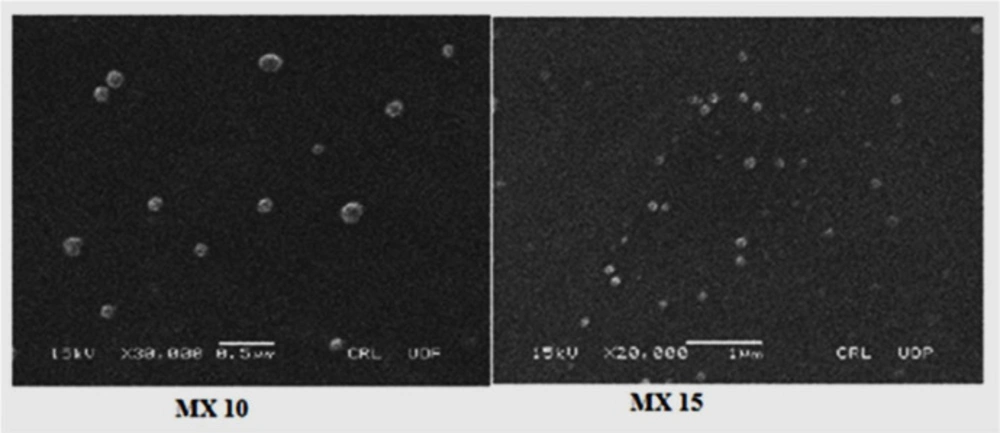
Scanning Electron Microscopy
The morphology of the nanoparticles is shown in SEM images (
Figure 5) which reveal that the nanoparticles are spherical with smooth surfaces. This is in agreement with reports on the spherical appearance of PLGA nanoparticles produced by a similar technique (
45).
Drug Loading and Release
The percent encapsulation efficiency, EE (%), of nanoparticles was significantly affected by the polymer concentration as it is the most influential parameter for this response. Results show that the highest EE (%) of 81.7% was observed at a D:P ratio of 1:10 and 2.5% PVA concentration. When D:P was 1:1, the EE (%) was 13.2%, whereas with increasing the D:P ratio, higher EE (%) was achieved, as shown in
Figure 2.
Based on the particle size, polydispersity and EE (%) values, five formulations with the smallest particle size and highest encapsulation efficiency, namely MX 10, MX 14, MX 15, MX 19, and MX 20, were selected for further in-vitro and in-vivo evaluation.
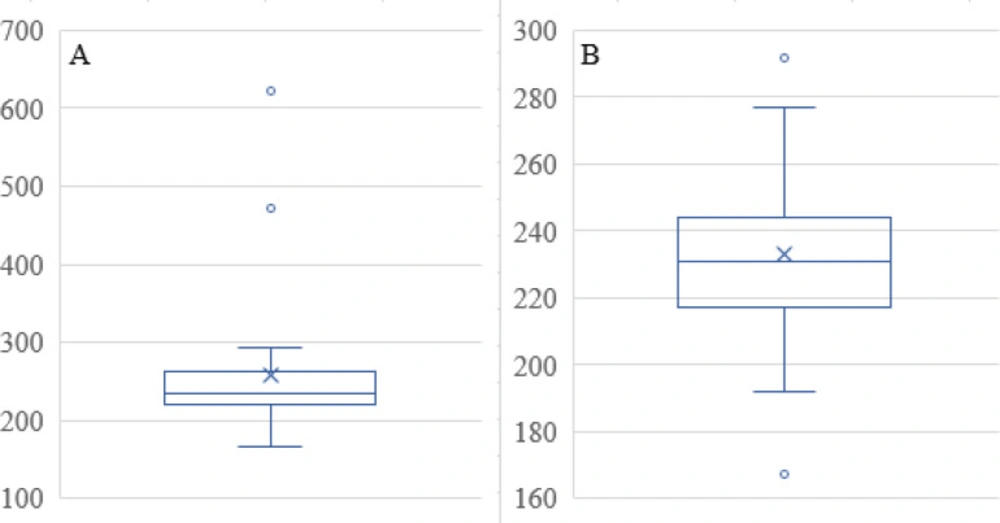
The Mean Size in Table 1 has three outliers that were removed. The two data points that were removed from the data set are evident in the Box and Whisker Plot in
Figure 6A, namely 471 and 622, as data points that exceed the upper whisker in the plot. The remaining data reveal two more values for outliers in
Figure 6B. Since there are two examples of the value that is too high in
Figure 6B, at 292 nm, neither of these was removed, even though the low value, specifically 167, was considered an outlier and removed from the data set before further data analysis. Predicted Mean Size as a function of the factor levels with the squared response data transforms provided an excellent fit to the data. Equation 3 included two-factor interaction and quadratic terms:
(Mean Size)2 = 85000 – 2470A – 82400B – 82400C – 17000AB – 750BC + 171AC + 27.8A2 + 26800B2 + 25200C2
Equation 3.
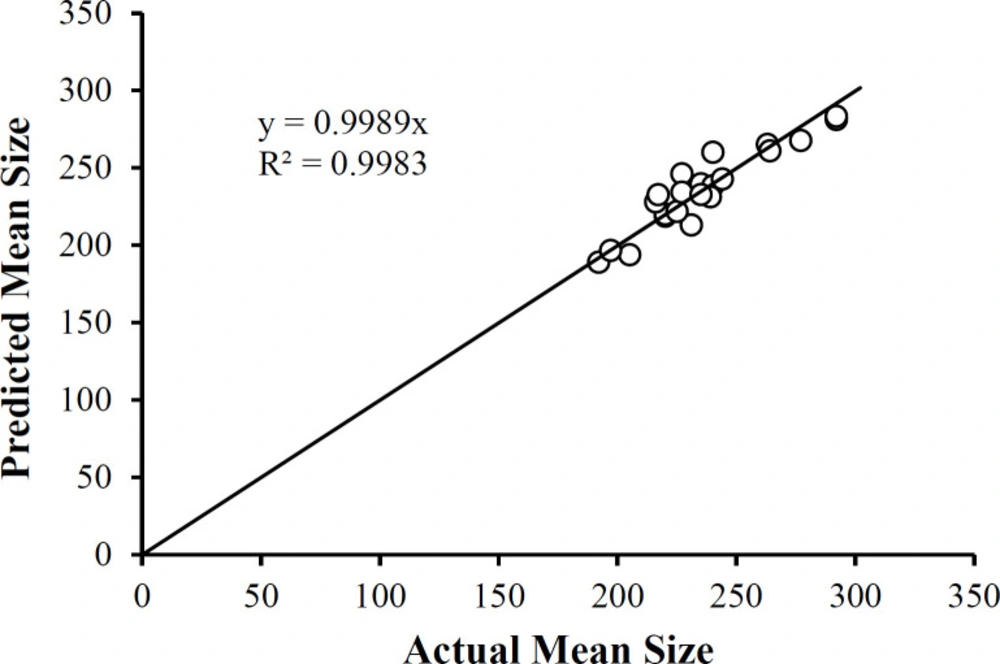
Where A = PLGA (mg), B = Drug to Polymer Ratio, C = PVA (% w/v) using the actual factor values. Equation 3 reveals that main factors B and C profoundly influence the Mean Size not only individually but at the quadratic terms for these two factors. In addition, the two-factor interaction terms in A and B is also substantially influencing the Mean Size. Therefore, each of the three studied factors affects the mean size of the nanoparticles. A plot of the predicted mean size values as a function of the actual mean size values (
Figure 7) shows the correlation between the two sets of data. Not only is the correlation coefficient high (R
2 = 0.8576), but the slope of the linear regression equation reveals the identity relationship between the two sets of data (slope = 0.9989). Note that the data clusters around 250 nm, comparable to that reported by Dillen
et al. (
46).
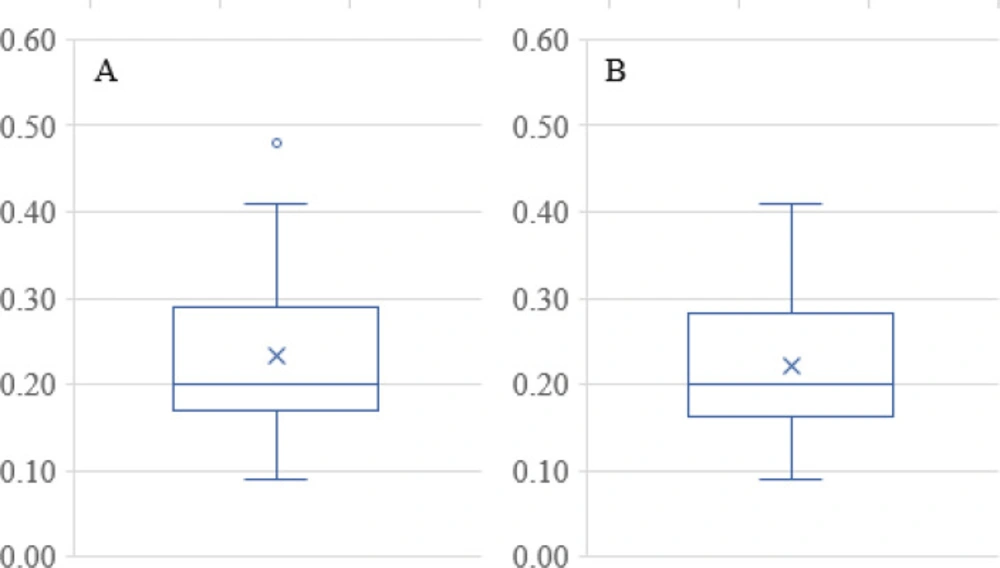
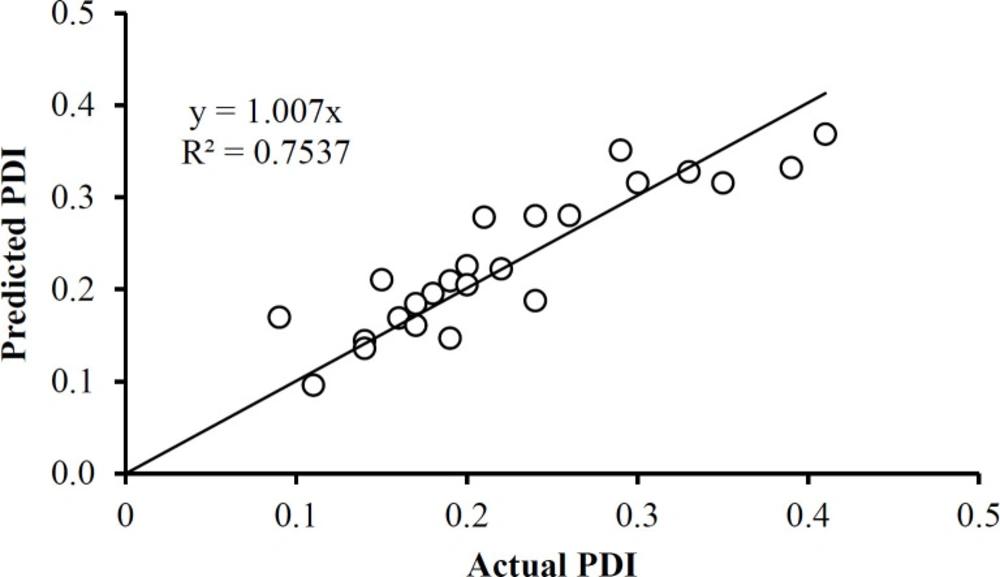
The PDI data in Table 1 has only one outlier, at 0.48 in the Box and Whisker Plot in
Figure 8A After eliminating this data point, it was found that no further outliers were evident (
Figure 8B). The PDI data was described well without 0.48 by Equation 4. Note that the data fall essentially on the identity line in
Figure 9. The equation indicates that the only way in which factor A affects PDI is by a two-factor interaction with factor B. Factors B and C influence this response as main factors, in two-factor interaction terms, and quadratic terms, revealing the importance of the proper selection of the drug-to-polymer ratio and the concentration of PVA in the external aqueous phase of the w/o/w emulsion.
PDI = 45.9 + 0.0145A + 0.523B + 0.105C – 9.22AB –0.0366BC + 0.0000161AC – 0.000190A2–0.170B2 – 0.0474C2
Equation 4.
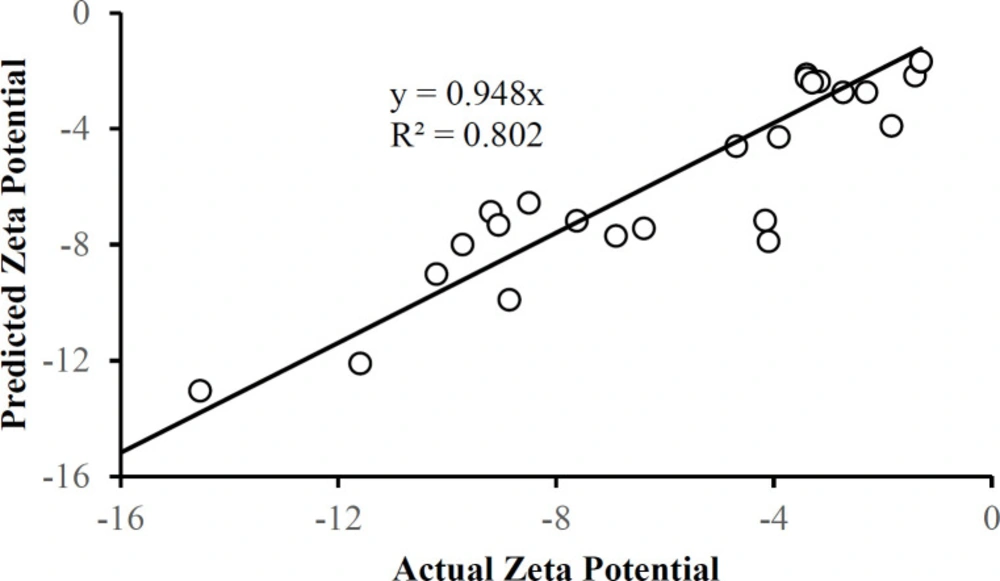
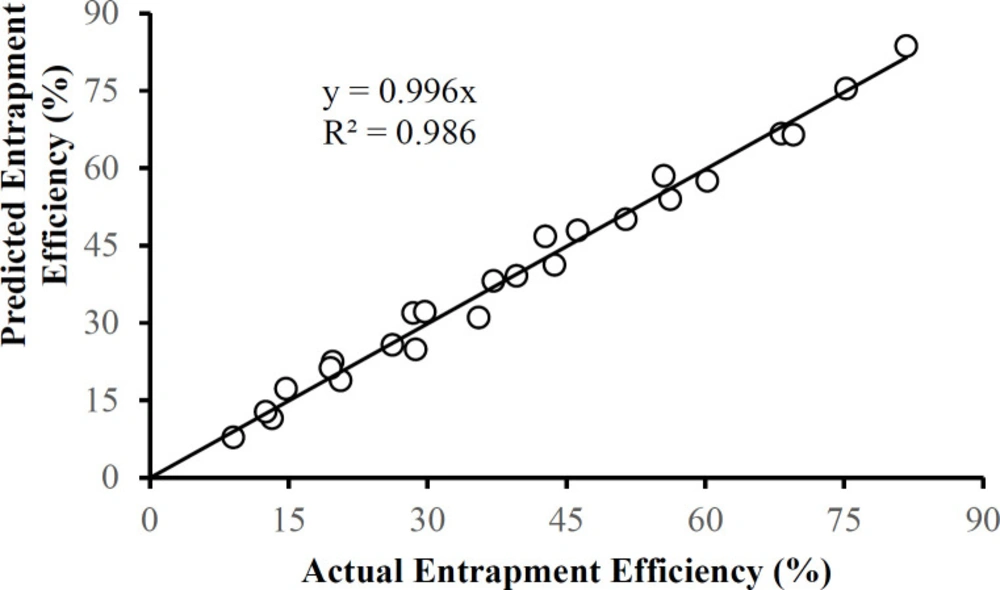
There were no outliers in the zeta potential or the entrapment efficiency data in Table 1. Each of these responses can be described by a corresponding multiple regression equation:
Zeta Potential = 104 – 1.05A – 38.2B + 10.2C – 18.2AB – 0.143BC – 0.0106AC + 0.0126A2 + 12.3B2 – 2.47C2
Equation 5.
Entrapment Efficiency (%) = 116.1 – 0.629A – 44.7B + 20.8C – 15.8AB – 4.79BC + 0.00550AC + 0.0146A2 + 14.0B2 – 0.902C2
Equation 6.
Figures 10 and
11 show that the data is described well by the corresponding equations and that in each case the responses follow the identity line. The drug-to-polymer ratio (Factor B) has the most profound effect on zeta potential as a main factor term, in its quadratic term, and the AB two-factor interaction term. The level of PVA in the external aqueous phase (Factor C) also markedly influences this response in its main factor term. The drug-to-polymer ratio substantially affects the entrapment efficiency as the main factor term, in its quadratic term, and the AB two-factor interaction term. As the main factor term the PVA concentration (Factor C) also markedly affects the entrapment efficiency. In this way, each of the factors markedly affects the entrapment efficiency.
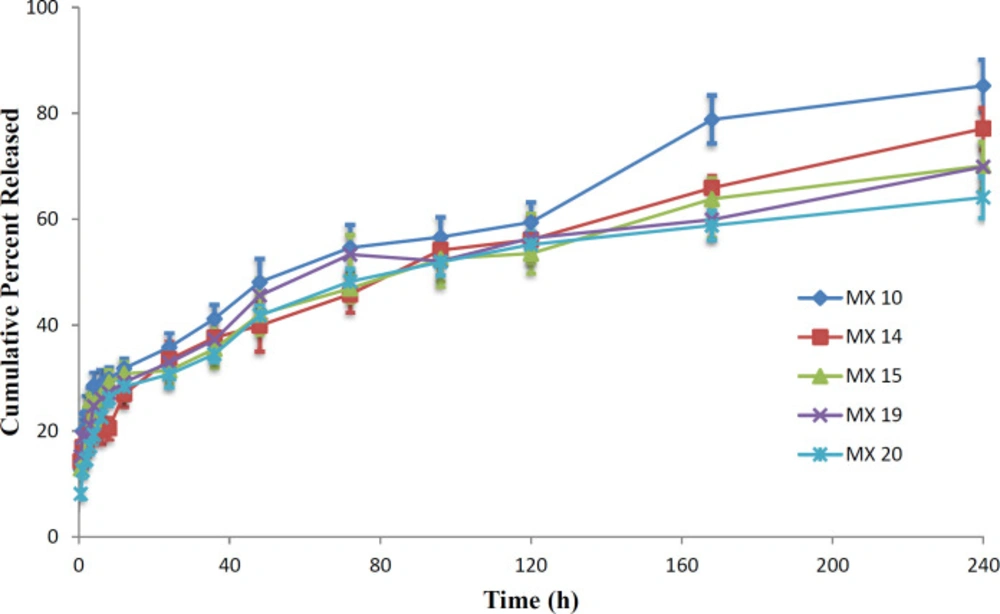
In-vitro Drug Release
In-vitro drug release profile for the preferred MX-loaded nanoparticles is shown in
Figure12. Each of the formulations released the drug in a biphasic manner; with a high release rate at first followed by sustained drug release. This is confirmed by when the mathematical models were fitted to the data, with results in accordance with previous reports (
47,
48). The high release rate is observed up to 6h, followed by consistent release up to 240 h. The initial high drug release rate may be attributed to the surface drug (
38,
49). The release efficiency of the products, RE
24h, equal to the cumulative percent of drug released at 24 h, decreased when the drug-to-polymer ratio or the PVA concentration was increased. The RE
24H obtained for the formulation MX10, MX14, MX15, MX19, and MX 20 was 35.8, 33.5, 31.4, 32.9, and 30.7%, respectively. The trend of a decrease in the drug released can be attributed to the higher polymer concentrations that increase the viscosity of the organic phase that result in less diffusion of the drug from the internal phase to the external phase (
50). Therefore, less drug migrates to the surface of the particle during the preparation of the nanoparticles.
Drug Release Kinetics
Different release models were fitted to the MX nanoparticle release profiles to predict the release mechanism. Since there is a burst release of the drug up to about 6 h, it can be assumed that the release mechanism in effect during that first 6 h is different from the release mechanism that is in effect from 6-240 h in the profile. What is of importance is the mechanism when steady-state drug release is evident, which would exist in the 6-240 h range of the profile, and the value of the burst release is estimated by the model fitting. Therefore, the model equations were fitted only to the 6-240 h data of the release profile and the measure of the burst release is the value at 6 h predicted by the fitted model equation.
The Akaike Information Criterion (AIC) was used to predict the model that best fit the release data with the fewest estimated parameters. The data in Table 2 indicate that the Higuchi model provided the best fit to the release data as obvious from the more negative value for the AIC for formulations MX 10, MX 14, MX 15, and MX 19. The exception was data for MX 20 which is best described by the Weibull equation. This confirms that, even though an apparent biphasic release profile was evident, diffusion of the release medium into the drug-containing nanoparticles, dissolution of the drug, and diffusion of the dissolved drug out of the particles is still the expected release mechanism for most of the entrapped drug.
The value ‘c’ indicates the fraction of drug released due to the rapid release rate in the first 6 h. Based on the fit of the Higuchi model equation to the release data, approximately 16% of the drug was released during the initial burst of the drug from the nanoparticles.
In-vivo Studies
Ocular Tolerance Studies
Administration of moxifloxacin 0.5% resulted in a significant decrease in pupil size compared with baseline (
p = 0.004), believed to be due to a greater release of endogenous prostaglandins (
51). Toxicity studies in rabbits demonstrated a substantial margin of safety for topically administered 0.5-3.0% moxifloxacin solutions, low ocular irritation potential, and no evidence of ocular or systemic toxicity (
52). The hen’s egg test on chorioallantoic membrane (HET-CAM) has been developed as a toxicological method to determine ocular irritation potential (
53). Sparfloxacin-loaded PLGA nanoparticles of 180-190 nm particle size were tested using the HET-CAM assay and earned a 0 score over an 8 h period for the nanosuspension (
18). Therefore it is not surprising that visual examination after the ocular irritation test revealed that no detrimental effects or irritation occurred with any of the formulations, indicating their ocular safety. A minimal redness of the conjunctiva was recorded with the nanoformulations that also resolved within 2 h. The results are presented in Table 3. The obtained results confirm that the nanoformulations can be used for ocular instillation because they were safe, biocompatible with the ocular tissues, and non-irritating.
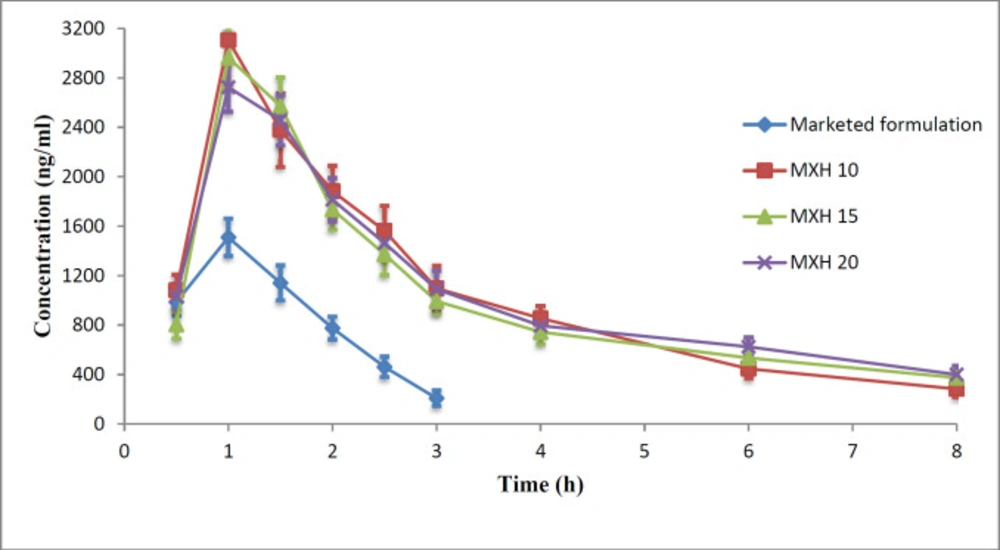
Pharmacokinetic Studies
The commercial product or a nanoformulation at 0.5% w/v MX content was instilled into each rabbit’s eye and aqueous humour samples were taken at predetermined time points. The collected samples were then analyzed for moxifloxacin by HPLC. The aqueous humour drug concentrations as a function of time are plotted in
Figure 13 and the pharmacokinetic parameters are presented in Table 4.
The Cmax achieved after instillation of 30µl of commercial eye drops or an MX 10, MX 15, and MX 20 nanoformulation was 1810 ± 59.4, 3106 ± 45.9, 2965 ± 102.1, and 2725 ± 85.2 ng/mL, respectively. The Cmax achieved with the nanoparticle formulations was 1.5-1.71 times greater than that of the commercial eye drops.
The AUC0-tattained for commercial eye drops and the nanoformulations MX 10, MX 15, and MX 20 were 2640 ± 26, 8290 ± 88, 8030 ± 83, and 8410 ± 100 µg-h/mL, respectively, indicating a three-fold higher bioavailability of the drug from nanoparticle formulations when compared to that achieved with the commercial solution. The MRT for MX 10, MX 15, MX 20, and commercial eye drops was 4.06 ± 0.09, 5.1 ± 0.1, 4.7 ± 0.08, and 1.44 ± 0.04 h, respectively.
The MRT for nanoformulations was 2.82-3.54 times higher than that of the commercial eye drops. The higher MRT of the nanoformulations suggests the influence of their enhanced ocular contact duration when compared with that of the commercial eye drops.
The drug concentration in the aqueous humour was un-detectable 3 h after instillation of the commercial eye drops, which might be due to the rapid pre-corneal drainage ensuing a shorter residence time of the drug at the ocular surface. With nanoformulations, the drug was retained up to 8 h post instillation leading to enhanced bioavailability of the drugs to the aqueous humour. The reason for this improved bioavailability may be that the PLGA nanoparticles are retained longer in the conjunctival sac (
54). As the results of ANOVA, the question of which formulations were significantly different, the statistical least significance difference (LSD) test was applied. The results obtained showed that each of the calculated LSD values is smaller than the tabulated value and hence each of the nanoformulations is unique and significantly different from the other formulations and the commercial product for these pharmacokinetic parameters.
Overlay of FTIR spectra of (A) moxifloxacin hydrochloride, (B) PLGA, and (C) 1:1 physical mixture
The effects of the drug to PLGA ratio on mean Particle Size and percent entrapment efficiency
Stability of nanoparticle formulations after storing at (A) 4-8 °C and (B)27-30°C
X-ray diffractograms of [A] MX, [B] PLGA, [C] PVA, [D] MX-loaded nanoparticles
SEM images of MX-loaded nanoparticles (MX 10, MX 15)
Box and Whisker Plots for Mean Size Data.(A) Full set of data, (B) Data without the outliers evident in A that established new ranges. The X presents the mean value and the top and bottom whiskers on the vertical line show the range outside of which outlier(s) exist. The horizontal line in the box indicates the median value for the mean size data
A Plot of Mean Size Data Predicted Using Equation 1 as a Function of the Actual Mean Sizes
Box and Whisker Plots for PDI data. (A) Full data set revealing a single outlier at 0.48, (B) Data without 0.48 showing no further outliers
Predicted values for PDI as a function of the actual PDI values. The linear relationship is presented in Equation 4
The plot of predicted values for the zeta potential based on Equation 5 as a function of the actual zeta potential values
Entrapment efficiency predicted using Equation 6 as a function of the actual entrapment efficiency
In-vitro Release profiles for MX-loaded nanoparticles
Aqueous humour concentration after MX-loaded nanoparticle or 0.5% w/v commercial eye drop instillation into a rabbit’s eye

![X-ray diffractograms of [A] MX, [B] PLGA, [C] PVA, [D] MX-loaded nanoparticles](https://brieflands.com/journals/ijpr/articles/124496/figures/ijpr-20-592-g008-preview.webp)