The reaction of [Cr(NO3)3·9H2O)] with dafone, opd and phen-dione led to the formation of target complexes. At room temperature, these compounds are air-stable. The results of the elemental analysis were compatible with their formula. The coordination method of the ligands in the complexes was investigated using spectroscopic methods.
FT-IR spectra of complexes (1), (2), and (3)
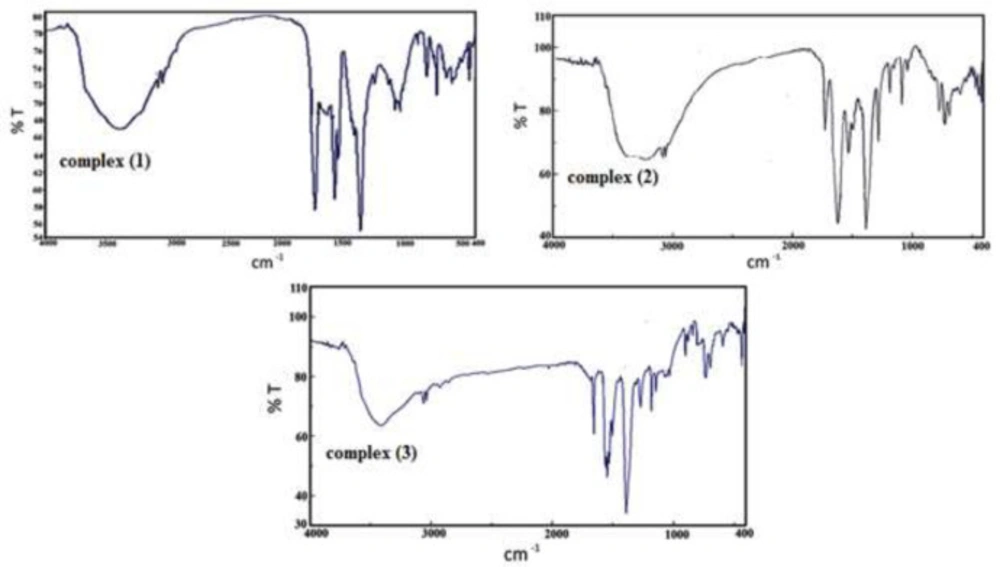
IR spectroscopy is a useful strategy for the characterization of transition metal complexes (
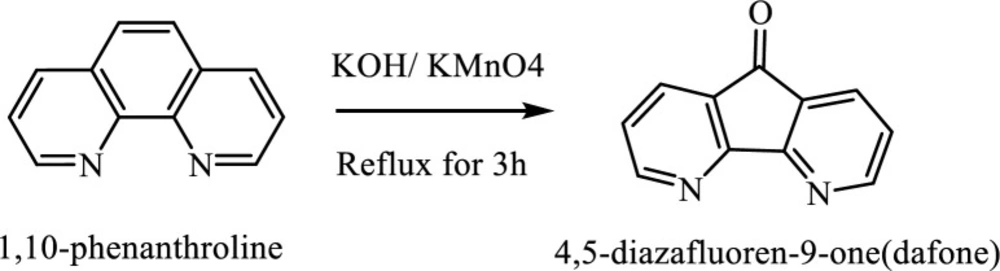
Figure 2). The IR spectrum of 4,5-Diazafluoren-9-one consists of broadband at 2900-3100 cm
-1 associated with ν(C-H) stretching frequency. The detected band at 1719 cm
-1 is assigned to ν (C=O) vibration (
19). The band at 1380 cm
-1 is associated with NO
3- ion (
13,
20,
21). The observed bands at 1571 cm
-1, 1596 cm
-1 and 1565 cm
-1 are assigned to ν(C = N) and ν(C = C) vibrations in Pyridine rings (
22). The bands in the range 750-1000 cm
-1 are attributed to the bending vibration of ν(=C-H) (
23,
24). The vibrational bands at 3088 cm
-1 in complexes are assigned to ν(C–H). The band at 420 cm
−1 is assigned to ν(Cr–N). The broadband around 3500 cm
-1 is associated with stretching band ν(O-H) in the H
2O ligand.
In complex (
3) the stretching band at 1000-1350 cm
-1 at the complex is assigned to ν(C-N) and the bands observed between 1480-1560 cm
-1 are assigned to ν(C = N) and ν(C = C) vibrations in Pyridine rings (
25) The vibrational bands between 2900-3100 cm
-1 in the complex are assigned to v(C–H). The band observed at 1632 cm
-1 is assigned to v(C = O) and phen-dion ligand (
19). Complex
(3) displays a band at 430cm
−1. The broadband at 3500 cm
-1 is related to stretching ν (O-H) in the H
2O ligand (
19).
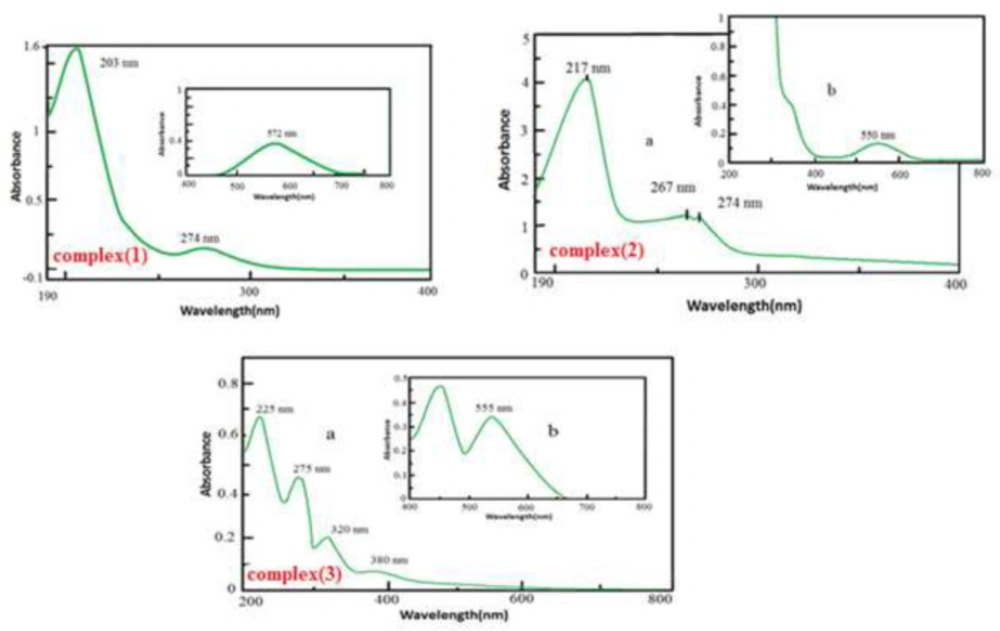
UV-Vis spectra of complexes(1), (2) and (3)
The electronic spectrum of [Cr(dafone)
2(H
2O)
2](NO
3)
3 in an aqueous solution bears some absorption bands in the UV and visible region (
Figure 3). The peak at 572 nm, in the visible region, is attributed to
4A
2g→
4T
2g as d–d transition. Strong UV bands at about 203 nm and 274 nm were assigned to (π→π*, n→π*) dafone intra-ligand transitions. According to the literature transition in 274 nm is related to
4A
2g →
4T
1g
(F) (
26,
27).
In complex (
2), the band at 550 nm in the visible region is attributed to the
4A
2g→
4T
2g transition that is assigned to the d–d transmission electron. Strong UV bands at approximately 217 nm and 267 nm were referred to dafone intra-ligand (π→π*, n→π*) transitions. According to the literature
4A
2g →
4T
1g transmission (F) is placed in the area 274 nm (
26,
27).
In complex (
3), the band at 555 nm in the visible region is attributed to
4A
2g→
4T
2g transition that shows d–d transmission electron. Strong UV peaks at about 200-300 nm were allocated to dafone intra-ligand (π→π*, n→π*) transitions and phen-dione. Absorption bands at 225, 275, 320, and 380 nm are related to intra-ligand (π→π*, n→π*) transitions in dafone and phen-dione(
5,
27). Transmission of chromium (III) is not divisible because of overlap with the intra-ligand transmissions and LMCT transmissions.
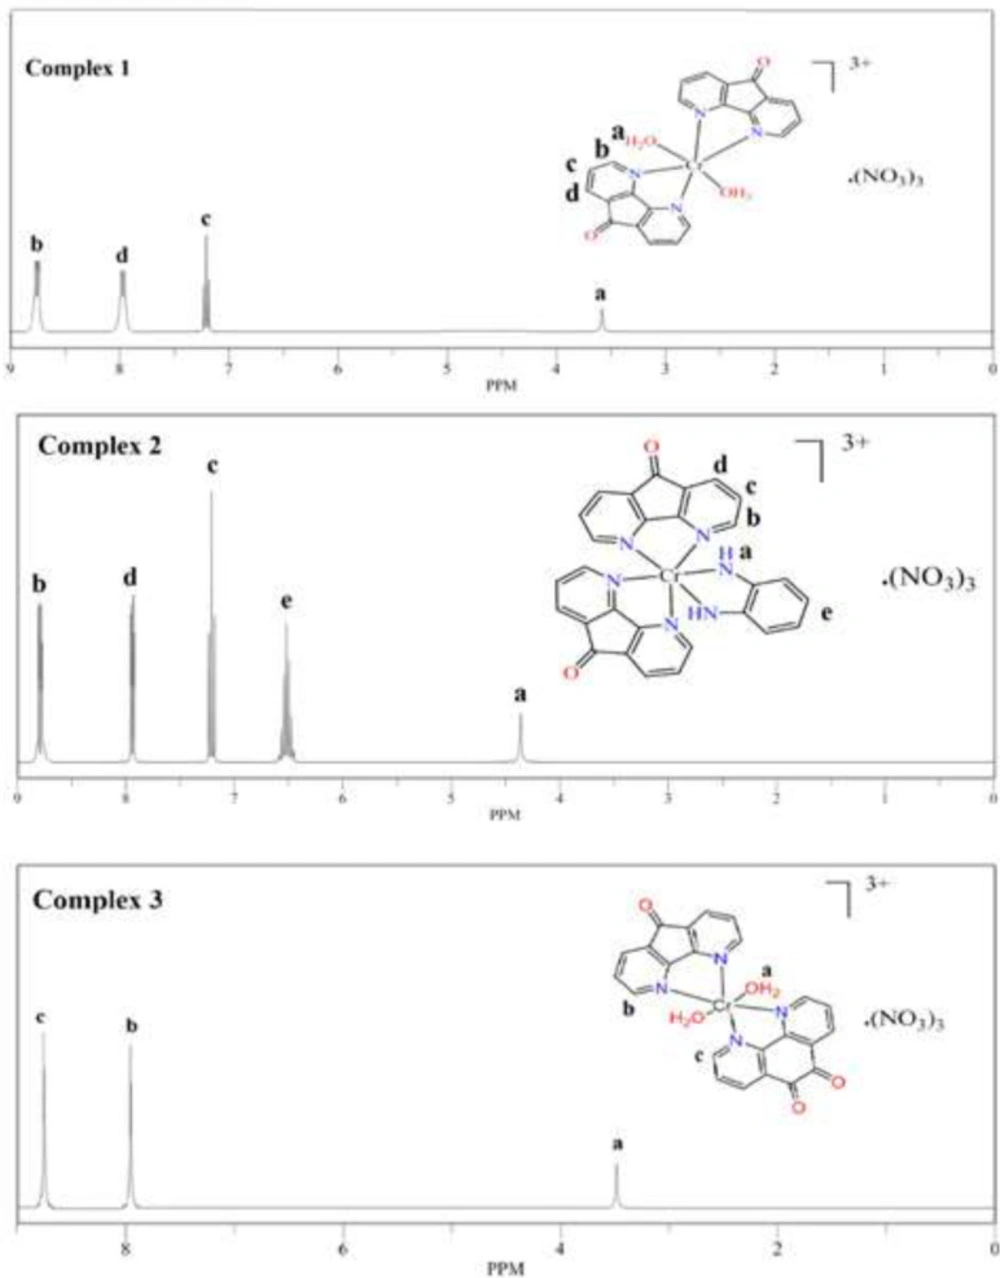
1H-NMR study
1H NMR spectra of complexes
(1),(2) and
(3) in DMSO-d
6 at 25 °C are presented in
Figure 4. The
1H-NMR spectrums of the complexes were analyzed by comparing of their ligands. The signals in the free ligands appear in 6.6-8.5 ppm.
It was also the signals of protons near to paramagnetic center (CrIII) in complexes (1),(2), and (3) that have been less broad and appear in the low field. The signal at 3.6 ppm and 3.4 ppm attributed to H2O molecules in the complex (1) and (3) respectively (30). Amine hydrogen atoms of the opd ring in complexes (2) were observed at 4.7 ppm.
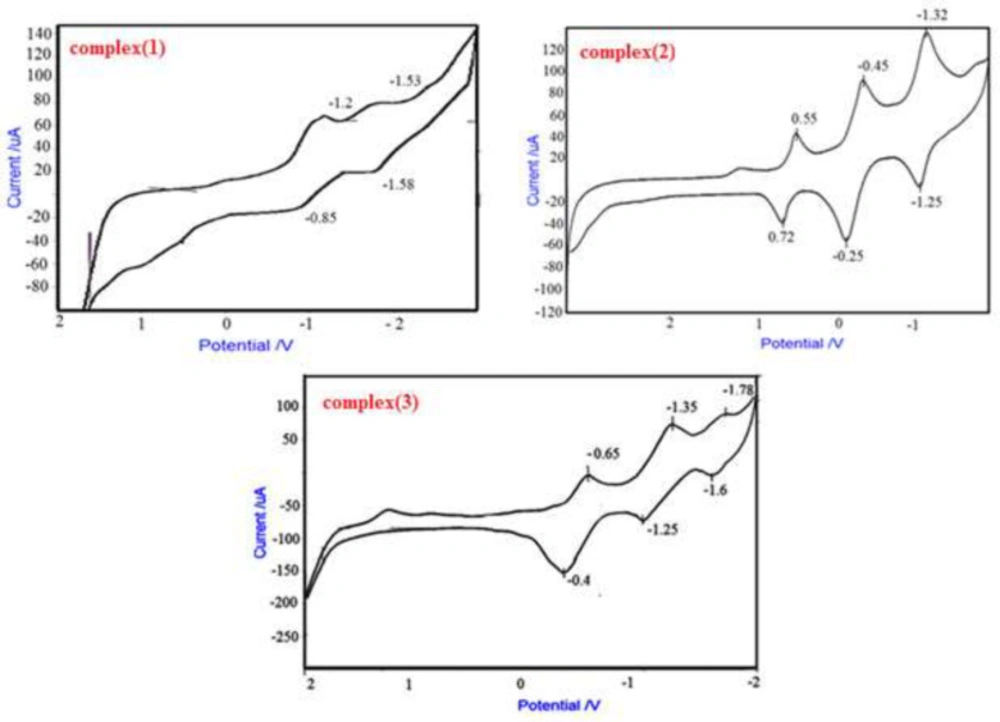
Cyclic voltammetry of complexes (1), (2) and (3)
The cyclic voltammogram for complex (
1) was achieved at 25 °C in DMF solvent containing 0.1M TBAH as secondary electrolyte with a scan rate of 500 mvs
-1. Complex (
1) shows quasi reversible reduction waves at -1.2 V and -0.85V versus Fc/ Fc+ couple attributed to reduction of Cr
+3/Cr
+2. Waves at negative potential -1.58 V are assigned to the reduction of ligand (
8,
26,
27).
Comparing voltammogram of free ligand and complex [Cr(opd)(dafone)(H
2O)
2](NO
3)
3, can be attribute to oxidation and reduction of 1,2-Phenylenediamine (0.72 v, 0.55 v) (
28), complex (
2) shows quasi reversible reduction waves between (-1.25 v, -1.32 v) against the Fc/ Fc
+ pair assigned to reduction of Cr
+3/ Cr
+2 and waves at negative potential (-0.25v, -0.45v) assigned to reduction of dofane (
27).
In this complex three oxidation-reduction peaks can be seen. Comparing voltammogram of free ligand and complex that were acquired at 25 °C in H
2O solution comprising 0.1M TBAH as secondary electrolyte with a scan rate of 500 mvs
-1, peaks at -1.25v and -1.35v can be attributed to oxidation and reduction of free phen-dione, and -0.4 v and -0.65 v to dafone (
24). Complex (
3) displays quasi reversible reduction waves at -1.78 v and -1.6 v against Fc/ Fc
+ couple assigned to reduction of Cr
+3/ Cr
+2 (
Figure 5) (
29).
DNA Binding Investigations
DNA binding experiments
The DNA binding study was carried out using a freshly prepared DNA solution in double-distilled water. The pH value was set at 7.2. Stock solution of Cr(III) complex (1 × 10⁻³ M) was prepared in H2O as the solvent. The interactions of the target complexes Cr(III) with DNA, the electronic absorption titration test was carried out. For this purpose, constant concentrations of the synthesized metal complexes (3.7 × 10⁻⁵, 6.8 × 10⁻⁵, 9.8 × 10⁻⁶ M for complexes 1, 2, and 3, respectively) were titrated with adding the amount of DNA solution ([DNA] = (7-42), (5-50) and (10-40) µM for complexes 1,2 and 3, respectively). The stability of complexes in an aqueous medium was examined comparing their UV–Vis spectra at 12 h intervals and the complexes exhibited high levels of stability.
To achieve equilibrium, DNA-Cr(III) complex solutions were prepared 10 minutes earlier than recording the UV–Vis spectra. Then, the FS-DNA solution was added and compared to the blank DNA solution. Fluorescence spectra were obtained for different concentrations of FS-DNA solution. This study,
Was performed at a constant concentration of synthesized compounds (1.7 × 10⁻⁶, 2.1 × 10⁻⁵, 1.0 × 10⁻⁷ M for complexes 1,2 and 3, respectively) and various concentrations of FS-DNA (0-24), (0-70) and (0-32) mΜ. The excitation wavelength for complexes 1, 2, and 3 was recorded at 310, 351, and 378 nm at different temperatures levels (303, 298, and 293 K). also, gel electrophoresis tests were carried out. Thus, some samples with a constant concentration of DNA and several concentrations of complexes were remained at about 1-hour in a solution of Tris–buffer.
The target samples were mixed with 4 μL of a loading buffer, 5 μL of the DNA solution, and methylene blue. After shaking, the mixture was loaded onto an agarose gel, after running the electrophoresis at 100 V for 30 min and photographed after exposure to UV irradiation.
Viscosity titration measurements
Viscosity tests were performed by an Anubbelohde viscometer immersed in a stated water bath at a constant temperature (27.0 ± 0.1 °C) for three synthesized complexes. The measurement was repeated about three times, so the mean values were reported.
CD spectral measurements
The corresponding circular dichroism spectra of FS-DNA in the absence and presence of chromium (III) compounds were obtained at 25 °C at 190 -330 nm. The circular dichroism spectra were recorded at a scan rate of 200 nm.min-1 and a 1s response period, the results were obtained each 0.2 nm from 190 to 330 nm after 3 repletion.
Electronic absorption spectra
UV-Vis spectral data were applied to define the strength and modes of small molecule binding to DNA. The complex
1 related spectra in the constant concentration of 3.7 × 10
-5M with different DNA concentrations (1.4 × 10
-4 M, 0-42 μL) are shown in
Figure 5 indicating that increasing in FS-DNA concentrations diminish the absorption intensity. The UV-Vis absorptions were recorded for synthesized complexes in interaction with FS-DNA (
Figure 6). The results approve the interaction of complex (
1) and DNA.
The binding constant (K
b) was calculated by means of [DNA]/(ε
a-ε
f)*10
12 versus [DNA]*10
6 plot that is derived from the slope-to-intercept ratio (
Figure 7). The corresponding K
b value from UV-Vis (5.1 × 10
5) is less than the K
b value associated with the traditional intercalator Ethidium bromide (1.4 × 10
6) (
30-
32).
Ethidium bromide has a planar system that can easily bind to DNA and simulate the change in the DNA conformation. Lastly, it is predictable that DNA-compound
1 binding mode was not intercalation. Also, the hyperchromic shift specifies the absence of intercalation mode (
32,
33). Finally, groove binding is the interaction mode of DNA- complex. Consequently, the interaction of DNA with complex
1 is aided by hydrogen bonding. The same procedure was conducted in the case of complexes
2 and
3 and the K
b values are presented in
Table 1.
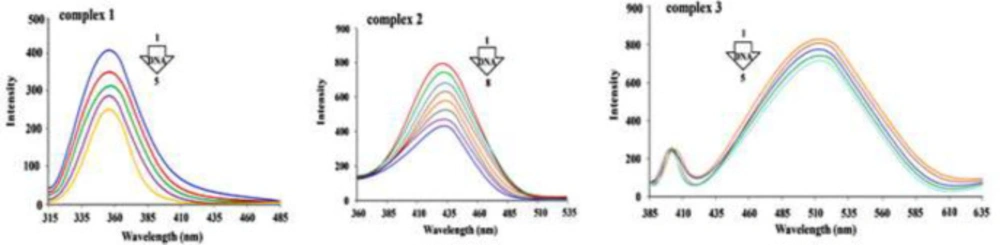
Fluorescence investigations
The fluorescence technique was used to investigate the interactions of DNA macromolecules with synthesized Cr(III) complexes. Electronic absorption analyses for complexes 1, 2 and 3 show that the interactions are non-intercalative. Intercalation is also undesirable as a result of ligand steric constrain surrounding the Cr(III) ion. As a result, the most likely mode of interaction between complexes 1, 2, and 3 and FS-DNA is groove binding.
Figure 8 illustrates the emission spectra of the synthesized compounds in interaction with varying concentrations of DNA. The excitation wavelength for the target complexes 1, 2 and 3 were at 310, 351 and 378 nm, respectively.
Figure 7 depicts that emission spectra intensity decreases with the increase in DNA concentration. data indicate that the fluorescence of the complexes is quenched by DNA solution.
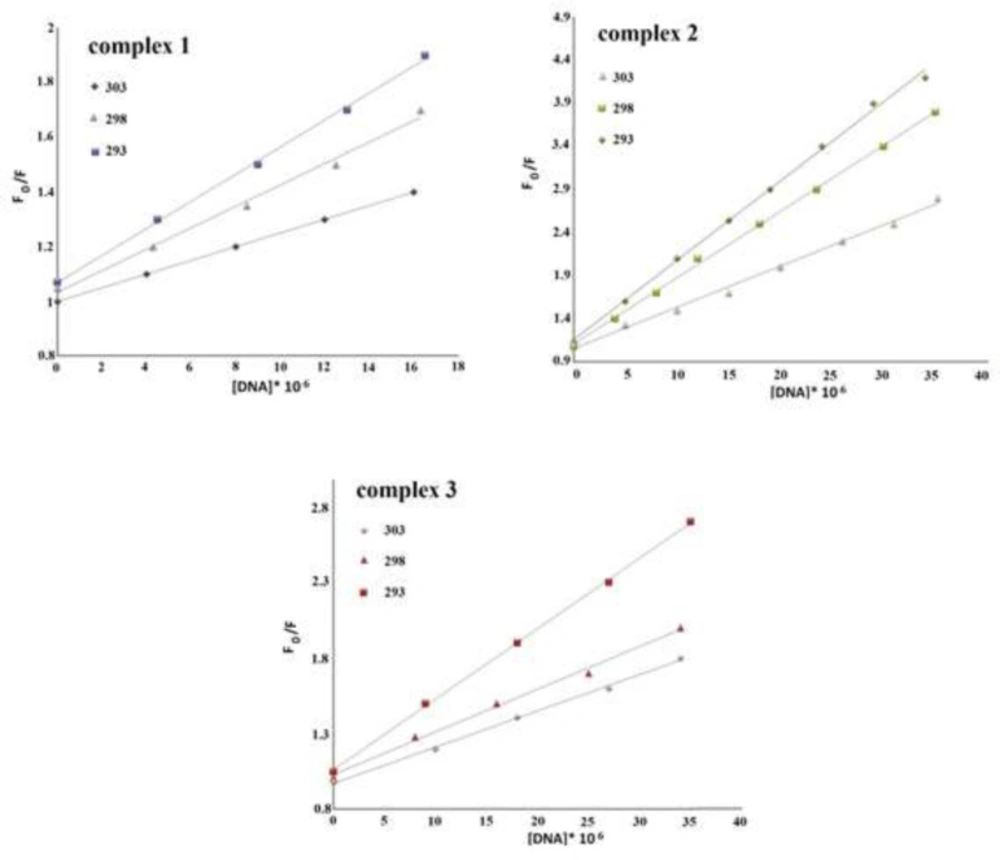
The acquired fluorescence data were used for exploring the interactions. The quenching mechanism can be either static or dynamic. The Stern-Volmer equation (F0/F = 1 + Ksv [Q] = 1+ kq τ0 [Q]) was applied for the analysis of fluorescence quenching data.
In the above-mentioned equation, F0 stands for fluorescence intensities of the synthesized compound when there are not any quencher species (DNA),
Compound fluorescence intensities exposed to various quencher concentrations are shown by F,
Stern–Volmer quenching coefficient is shown by
Ksv, [Q] shows the quencher concentration,
kq stands for to the bimolecular quenching level constant and lastly, τ
0 refers to the fluorophore lifetime (τ
0 = 10
−8 s) (
34). The Stern–Volmer quenching constant (
Ksv) was calculated based on the slope of F
0/F vs [DNA] plot (
Figure 9) and
kq from
Ksv / τ
0 at different temperatures of 303, 298 and 293 K. The data are summarized in
Table 1.
The results in
Table 1 indicate that the decrease in
kq and
Ksv with growing temperature and
kq value is more than 2.0 × 10
10 M
-1s
-1, showing that the quenching mechanism is static (
35,
36).
The equation of {log ((F
0 – F)/F) = log
Kb+
nlog[Q]} (
37) is used to calculate the binding constant (
Kb) and binding sites (n) values from the obtained data from fluorescence measurements.
Based on this equation, n and K
b were calculated from the intercept and slope of log ((F
0 – F)/F))
vs. log ([DNA]/μM) graph (
Figure 10), respectively.
Table 1 shows that as the temperature rises, the amount of K
b decreases, suggesting that the interaction between DNA and Cr(III) compounds may occur through an exothermic mechanism (
38). The binding sites number is approximately one that means Cr(III) complexes have one independent active site on the DNA double-strand (
39,
40).
Fluorescence data and thermodynamic factors
It is important to make a distinction between standard entropy (
ΔSº), enthalpy (
ΔHº) and Gibbs free energy (
ΔGº) changes to comprehend the thermodynamic reaction between the specified molecules and FS-DNA. The thermodynamic parameters are applied for determining the nature of interactions.
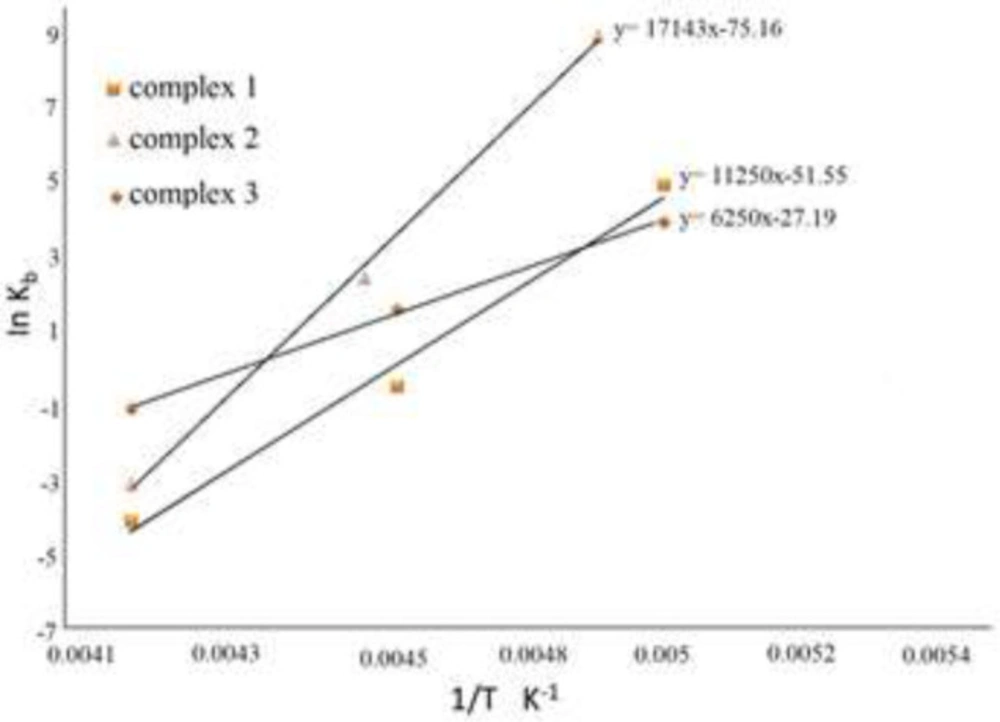
∆Sº and
∆Hº were acquired utilizing
Kb values at various temperatures and the van’t Hoff equation (ln
Kb = -
ΔHº/R
T +
ΔSº/R) (
32,
41). The titled parameters were determined using ln
Kb vs 1/T curve (
Figure 11) that slope (–
ΔHº/R), and the intercept (
ΔSº/R), are related to
∆Hº and
∆Sº respectively. The
ΔGº factor can be obtained from the equation of
ΔGº =
ΔHº –
TΔSº = –R
Tln
Kb. The data are provided in
Table 1.
A minimal or zero value of ∆Hº and positive value of
∆Sº represent electrostatic interactions, while negative
∆Sº and ∆Hº values indicate hydrogen bonding and van der Waals interactions, and positive
∆Sº and ∆Hº represent hydrophobic interactions. As a result, the negative
ΔH º and
ΔSº values (shown in
Table 1) prove that Cr(III) complexes in DNA grooves are stabilized by hydrogen bonding and van der Waals interactions. The negative numbers of
ΔGº, on the other hand, indicate spontaneous phenomena (
41).
Lastly, the exothermic interaction of Cr (III) complexes and DNA is shown by the negative quantities of
ΔHº. As the temperature rises, the value of
Kb decreases (
Table 1).
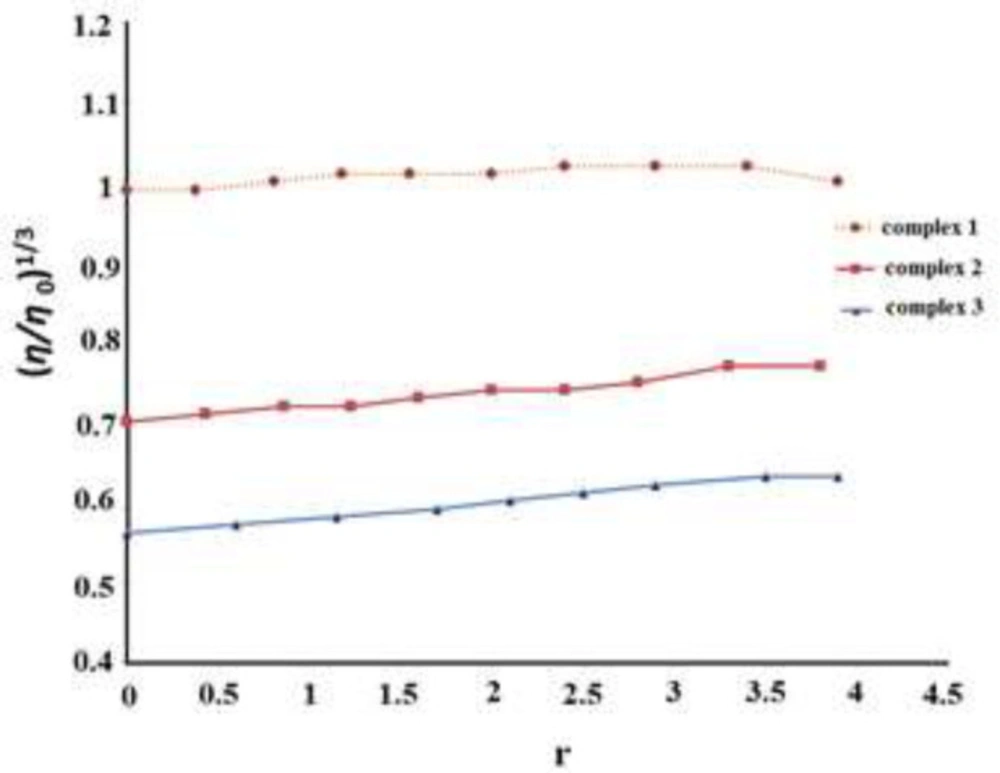
Viscosity measurement
In the absence of crystallographic data, viscosity measurement is an effective method for detecting changes in DNA conformation. In intercalative interaction, the dissociation of FS-DNA nucleotides for the insertion of ligand results in DNA length increase, which increases the DNA viscosity (
42,
43) while in the case of non-intercalative interactions namely electrostatic and groove binding the viscosity of DNA will not alter. The comparative values of FS-DNA viscosity were obtained for different concentrations of synthesized complexes based on the equation η = (t – t
0)/t
0, where
t refers to the flow time for sample solution and
t0 is blank solution flow time, respectively.
Figure 12 shows the comparative values of FS-DNA viscosity did not change with the growing concentration of complexes
1,
2 and
3 in an FS-DNA solution containing all the synthesized compounds. The outcomes prove a non-intercalative interaction mode.
Circular Dichroism analysis
CD spectroscopy provides complementary information to absorption spectra. This practical technique is sensitive and non-destructivethat used to analyze the conformations of optically active species such as nucleic acids in solution. In this study, CD spectroscopy data were applied for the detection of slight structural modification of DNA in the binding procedure (
44,
45).
Observed changes in signals are often linked to corresponding changes in DNA structure. Any change in DNA conformation causes a change in produced signals. The solution of the right-handed DNA helix makes a negative band near 220 nm and the positive band around 270-290 nm arises from base pairing and base stacking. The binding mode DNA-complex affects these bands (
44,
46).
It has been reported that intercalation increases base stacking and eventuates to the stabilization of B conformation of right-handed DNA and increases the intensity of both bands. On the other hand, DNA conformation is not significantly affected in the case of groove and electrostatic binding or non-intercalation (
44). The effect of growing concentrations of Cr(III) complexes on DNA conformation has been reported as CD spectral data and the results are illustrated in
Figure 13.
The CD changes at both wavelengths include a decrease in the magnitude of the bands and reduction of, proving non-intercalative interactions and also reduction of base stacking (
42). Thus, the data suggests non-intercalation and confirms groove and electrostatic mode of binding.
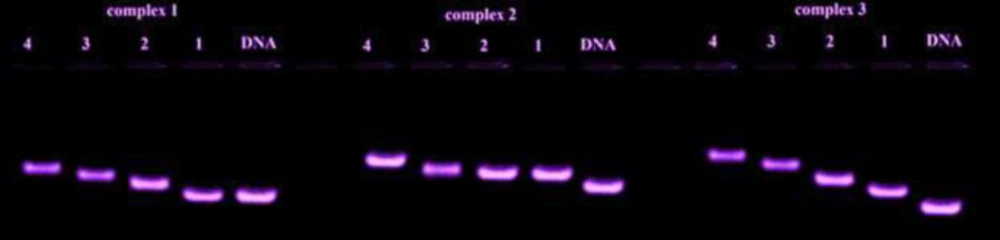
Agarose gel electrophoresis
Agarose gel electrophoresis is a simple and highly efficient technique for identifying the interaction mode of complex-DNA. For this purpose, different concentrations of synthesized complexes were mixed with 4 μL of loading buffer, methylene blue and 5 μL DNA solution (1.4 × 10
-4M). The solution was loaded on a prepared agarose gel and was run at a voltage of 100 v for a while to obtain the highest level of separation. Finally, the DNA fragments were visualized after irradiation with UV light.
Figure 14 confirms the interaction of DNA and synthesized complexes.
Determination of anti-proliferative activity
The synthesized compounds
(1, 2 and
3) were monitored by MTT assay toward two human cancer cell lines A549, KB and HUVEC as normal cells compared to that of cisplatin as a standard drug, and the results were reported in terms of IC
50 values. As shown in
Table 2 the compounds exhibited high potencies in the low micromolar range against cancer cell lines. The synthetic metal complexes [Cr(dafone)
2(H
2O)
2](NO
3)
3 (1) (5.7 ± 0.2 and 4.0 ± 0.7 µM against A549 and KB) and [Cr(opd)(dafone)
2](NO
3)
3(2) (4.8 ± 0.1 and 3.4 ± 0.5 µM against A549 and KB) revealed a substantial decrease in the percentage of viable cells while [Cr(phen-dione)(dafone)(H
2O)
2](NO
3)
3 (3) exhibited a moderate activity as 39.0 ± 2.0 µM and 53.6 ± 2.8 µM against A549 and KB respectively. Cisplatin IC
50 values as the positive control, against A549 and KB cancer cell lines, are 14.6 ± 0.6 and 6.2 ± 0.3 µM, respectively. Comparing the chemical structure of the target compounds indicates that the presence of dafone ligand could be the reason for better efficiency of
1 and
2 rather than
3. The cytotoxicity evaluation against HUVEC cells exhibited about two to three times lower IC
50 values for both synthesized compounds and cisplatin. The target values for
1 and
2 are 11.22 ± 0.9, 15.49 ± 1.0 while compound
3 did not show cytotoxicity against normal cells. The obtained value for cisplatin was 58.88 ± 3.5.
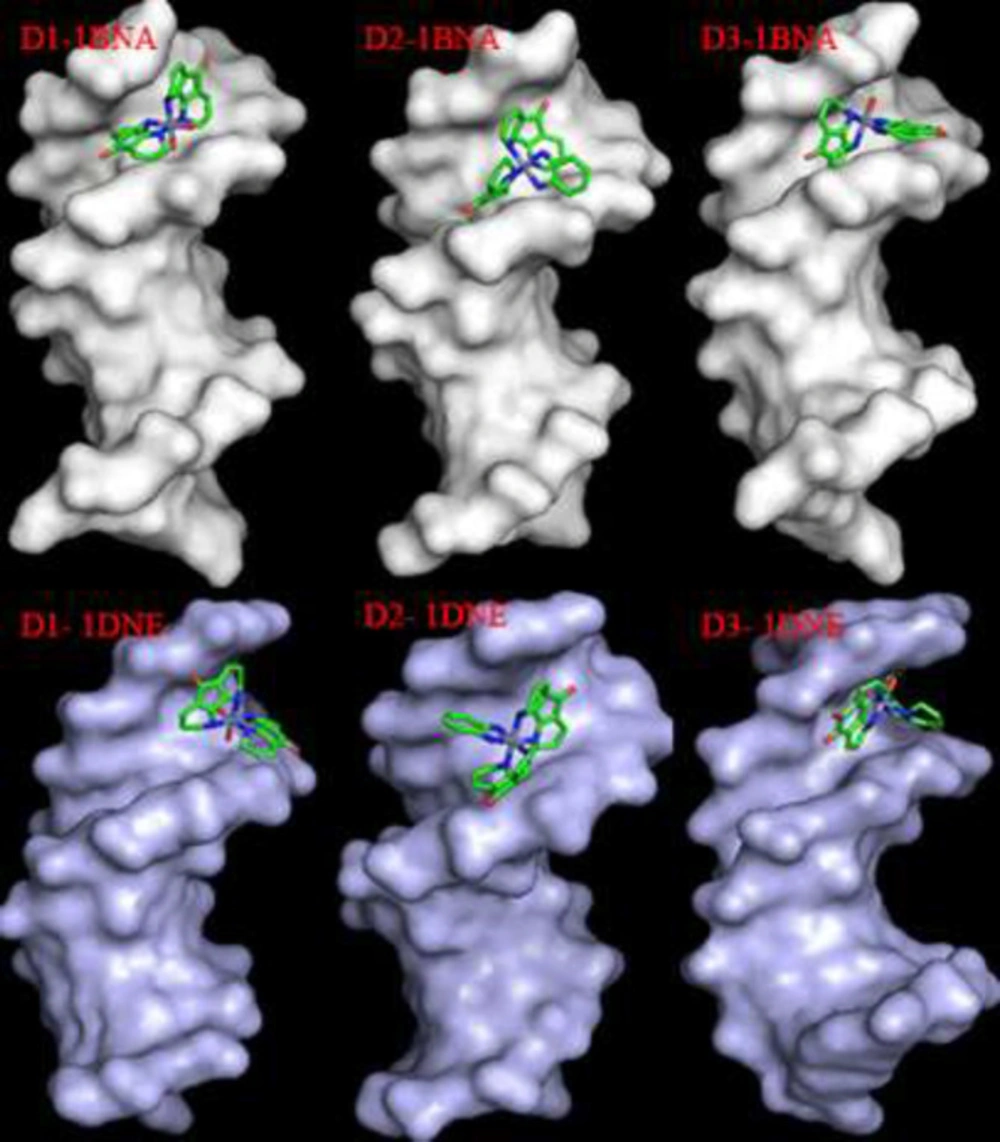
Molecular docking results
The molecular docking simulation was performed to explore the mode of DNA-complex interaction. The most favorable poses with the minimum energy are illustrated in
Table 3. The stabilization of synthesized complexes in binding to DNA occurs via different hydrogen bonds. The more negative binding energies indicate the higher binding affinity of the synthesized compound in the DNA binding site. As shown in
Figure 15 all the synthesized complexes interact with DNA in a groove binding mode.
Structure of [Cr(dafone)2(H2O)2](NO3)3(1).
Structure of [Cr(opd)(dafone)2](NO3)3(2).
Structure of [Cr(phen-dione)(dafone)(H2O)2](NO3)3(3).
FT-IR spectra of complexes (1), (2) and (3).
UV–Visible spectra of complexes (1), (2), and (3) in water (1 × 10⁻³ M in Vis (b) and 1 × 10⁻⁵M in UV (a) region).
1HNMR spectra of complexes (1),(2) and (3) in DMSO-d6 at 25 °C
Cyclic voltammetry of complexes (1), (2) and (3), in DMF solvent, 0.1 M TBAH as a supportive electrolyte
UV-Vis spectra of a) complex 1 whitout (line 0) and with different [DNA] (line 1-7) [Complex] = 3.7 × 10⁻⁵ M, [DNA] = (7-42 μM). b) Complex 2 whitout (line 0) and with different [DNA] (line 1-10 [Complex] = 6.8 × 10⁻⁵ M, [DNA] = (5-50 μM). c) Complex 3 whitout (line 0) and with different [DNA] (line 1-4 [Complex] = 9.8 × 10⁻⁵ M, [DNA] = (10-40 μM).
The curve of [DNA]/(εa-εf) × 1012 versus [DNA] × 106
Complexes 1, 2 and 3 (1.7 × 10⁻⁶, 2.1 × 10⁻⁵, 1.0 × 10⁻⁷ M) emission spectra with adding amount of DNA, at 298 K. complex 1) the concentration of FS-DNA increases from zero (line 1) to 24 µM (line 5); complex 2) DNA concentration increases from zero (line 1) to 70 µM (line 8); complex 3) concentration of DNA increases from zero (line 1) to 32 µM (line 5).
The Stern-Volmer graphs of Cr(III) complexes of 1, 2 and 3 at 303, 298 and 293 K
log ((F0 – F)/F) vs. log ([DNA]/μM) for the fluorescence titration of Cr(III) complexes 1, 2 and 3 with DNA at different temperatures (303, 298 and 293 K).
The van’t Hoff curve in the interactions of complexes 1, 2 and 3; with DNA at various temperatures (303, 298 and 293 K).
The effects of growing amounts of compounds 1, 2 and 3 on an FS-DNA viscosity at 298 K. The FS-DNA was concentration 1.4 × 10 −4 mol L−1
The CD spectra of DNA with increasing concentration of complexes 1,2 and 3. The concentration of DNA was 1.4 × 10 −4 mol.L −1. [Complex] / [DNA] ratio were (a) 0.00, 0.23 and 0.042 respectively
DNA fragments at different concentrations of complexes (1, 2 and 3) at 25 °C: one lane having: DNA control; lane 1-4: complex (1, 2 and 3) + FS-DNA
Docking pose of synthesized Cr(III) complexes 1, 2 and 3 in DNA minor groove
| Complex | K (T) | KSV × 105 (M-1) | kq × 1013 (M-1s-1) | n | Kb ×10-5 (M-1) | ∆G˚ (kJ/mol) | ΔH˚ (kJ/mol) | ΔS˚ (J/mol.K) |
|---|
| Fluorescence | UV-Vis |
|---|
| 1 | 303 | 2.75 ± 0.02 | 2.75 ± 0.02 | 1.00 | 1.4 ± 0.01 | | -33.73 ± 0.02 | | |
| 298 | 3.81 ± 0.01 | 3.81 ± 0.01 | 1.03 | 3.1 ± 0.02 | 5.1 ± 0.03 | -31.63 ± 0.04 | -93.53 ± 0.03 | -0.42 ± 0.02 |
| 293 | 4.36 ± 0.01 | 4.36 ± 0.01 | 1.04 | 4.4 ± 0.01 | | -29.53 ± 0.02 | | |
| 2 | 303 | 3.95 ± 0.03 | 3.95 ± 0.03 | 1.04 | 2.4 ± 0.01 | | -45.34 ± 0.01 | | |
| 298 | 4.86 ± 0.01 | 4.86 ± 0.01 | 1.05 | 3.1 ± 0.03 | 1.2 ± 0.01 | -42.24 ± 0.01 | -142.52 ± 0.02 | -0.62 ± 0.03 |
| 293 | 8.35 ± 0.04 | 8.35 ± 0.04 | 1.07 | 5.1 ± 0.02 | | -39.14 ± 0.02 | | |
| 3 | 303 | 2.32 ± 0.01 | 2.32 ± 0.01 | 1.09 | 3.9 ± 0.01 | | -14.70 ± 0.01 | | |
| 298 | 2.97 ± 0.03 | 2.97 ± 0.03 | 1.14 | 4.1 ± 0.01 | 3.5 ± 0.01 | -13.60 ± 0.03 | -51.96 ± 0.01 | -0.22 ± 0.01 |
| 293 | 4.57 ± 0.02 | 4.57 ± 0.02 | 1.16 | 4.4 ± 0.03 | | -12.50 ± 0.01 | | |
| Compound | an IC50 (µM) | |
|---|
| A549 | KB | HUVEC |
|---|
| 1 | 5.7 ± 0.2 | 4.0 ± 0.7 | 11.22 ± 0.9 |
| 2 | 4.8 ± 0.1 | 3.4 ±0.5 | 15.49 ± 1.0 |
| 3 | 39.0 ± 2.0 | 53.6 ± 2.8 | >100 |
| Cisplatin | 14.6 ± 0.6 | 6.2 ± 0.3 | 58.88 ± 3.5 |
| Ligand | PDB ID | Binding energy (kJ.mol-1) | H-bonds | Adjacent nucleotides |
|---|
| 1 | 1BNA | -277.14 | H2O …Phosphate O (G16, 3.2Å) | A17, G16, C15, C11 |
| Dafone C=O… Phosphate O (A17, 3.4Å) |
| 1DNE | -295.71 | 1H2O …backbone ribose O (C23, 2.6Å) | C23, C24C23, C24 |
| 1H2O …NH (G22, 2.5Å) |
| 1H2O …O=C (C3, 3.4Å) |
| 2H2O …NH (G4, 3.0Å) |
| 2H2O …Phosphate O (G4, 2.7Å) |
| 2H2O …O=C (C3, 3.1Å) |
| 2 | 1BNA | -299.87 | Dafone C=O… Phosphate O (A5, 2.6Å) | C3, C4, C23 |
| Dafone C=O… Phosphate O (A5, 2.7Å) |
| 1DNE | -303.58 | Dafone C=O… NH (G2, 3.4Å) | C3, C23, A5 |
| opd N… NH (G22, 3.4Å) |
| opd N… NH (G4, 3.4Å) |
| 3 | 1BNA | -284.63 | Dafone C=O… Phosphate O (A18, 3.4Å) | A17, C15, G10 |
| 1H2O …Phosphate O (C11, 3.1Å) |
| 2H2O …Phosphate O (C11, 3.3Å) |
| 2H2O … backbone ribose O (C23, 2.6Å) |
| Phen dione C=O… backbone ribose O (G16, 3.1Å) |
| 1DNE | -293.18 | Phen dione C=O… Phosphate O (G10, 2.8Å) | C15, A17 |
| 1H2O …backbone ribose O (G10, 2.4Å) |
| 1H2O … NH (G10, 3.2Å) |
| 1H2O …Phosphate O (C11, 2.8Å) |
| 2H2O …Phosphate O (C11, 2.9Å) |
| 2H2O …Phosphate O (C11, 3.4Å) |

<sub>3</sub><b>(1)</b>.](https://brieflands.com/journals/ijpr/articles/124504/figures/ijpr-20-618-g001-preview.webp)
<sub>3</sub><b>(2)</b>.](https://brieflands.com/journals/ijpr/articles/124504/figures/ijpr-20-618-g002-preview.webp)
<sub>3</sub><b>(3)</b>.](https://brieflands.com/journals/ijpr/articles/124504/figures/ijpr-20-618-g003-preview.webp)
![UV-Vis spectra of a) complex <b>1</b> whitout (line 0) and with different [DNA] (line 1-7) [Complex] = 3.7 × 10<sup>-5</sup> M, [DNA] = (7-42 μM). b) Complex <b>2</b> whitout (line 0) and with different [DNA] (line 1-10 [Complex] = 6.8 × 10<sup>-5</sup> M, [DNA] = (5-50 μM). c) Complex <b>3</b> whitout (line 0) and with different [DNA] (line 1-4 [Complex] = 9.8 × 10<sup>-5</sup> M, [DNA] = (10-40 μM).](https://brieflands.com/journals/ijpr/articles/124504/figures/ijpr-20-618-g009-preview.webp)
![The curve of [DNA]/(εa-ε<sub>f</sub>) × 10<sup>12</sup> versus [DNA] × 10<sup>6</sup>](https://brieflands.com/journals/ijpr/articles/124504/figures/ijpr-20-618-g010-preview.webp)
![log ((F<sub>0</sub> – F)/F) <i>vs</i>. log ([DNA]/μM) for the fluorescence titration of Cr(III) complexes <b>1</b>, <b>2</b> and <b>3</b> with DNA at different temperatures (303, 298 and 293 K).](https://brieflands.com/journals/ijpr/articles/124504/figures/ijpr-20-618-g013-preview.webp)
![The CD spectra of DNA with increasing concentration of complexes <b>1,2 </b>and<b> 3</b>. The concentration of DNA was 1.4 × 10 <sup>−4</sup> mol.L <sup>−1</sup>. [Complex] <b>/</b> [DNA] ratio were (a) 0.00, 0.23 and 0.042 respectively](https://brieflands.com/journals/ijpr/articles/124504/figures/ijpr-20-618-g016-preview.webp)