
Introduction
Experimental
Results
Discussion
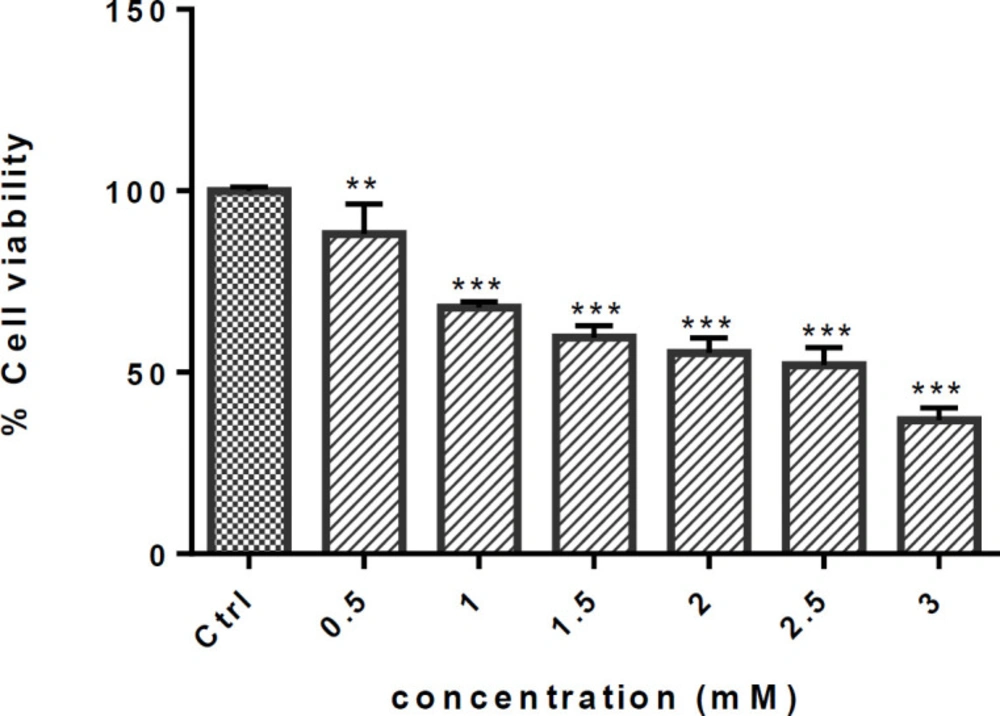
Effect of METH on cell viability of PC12 cells. Cells were treated with different concentrations of METH for 24h. Viability was quantitated by MTT assay. Data are expressed as mean ± SEM of six separate experiments. **P <0.01 and ***P < 0.001 vs. control group
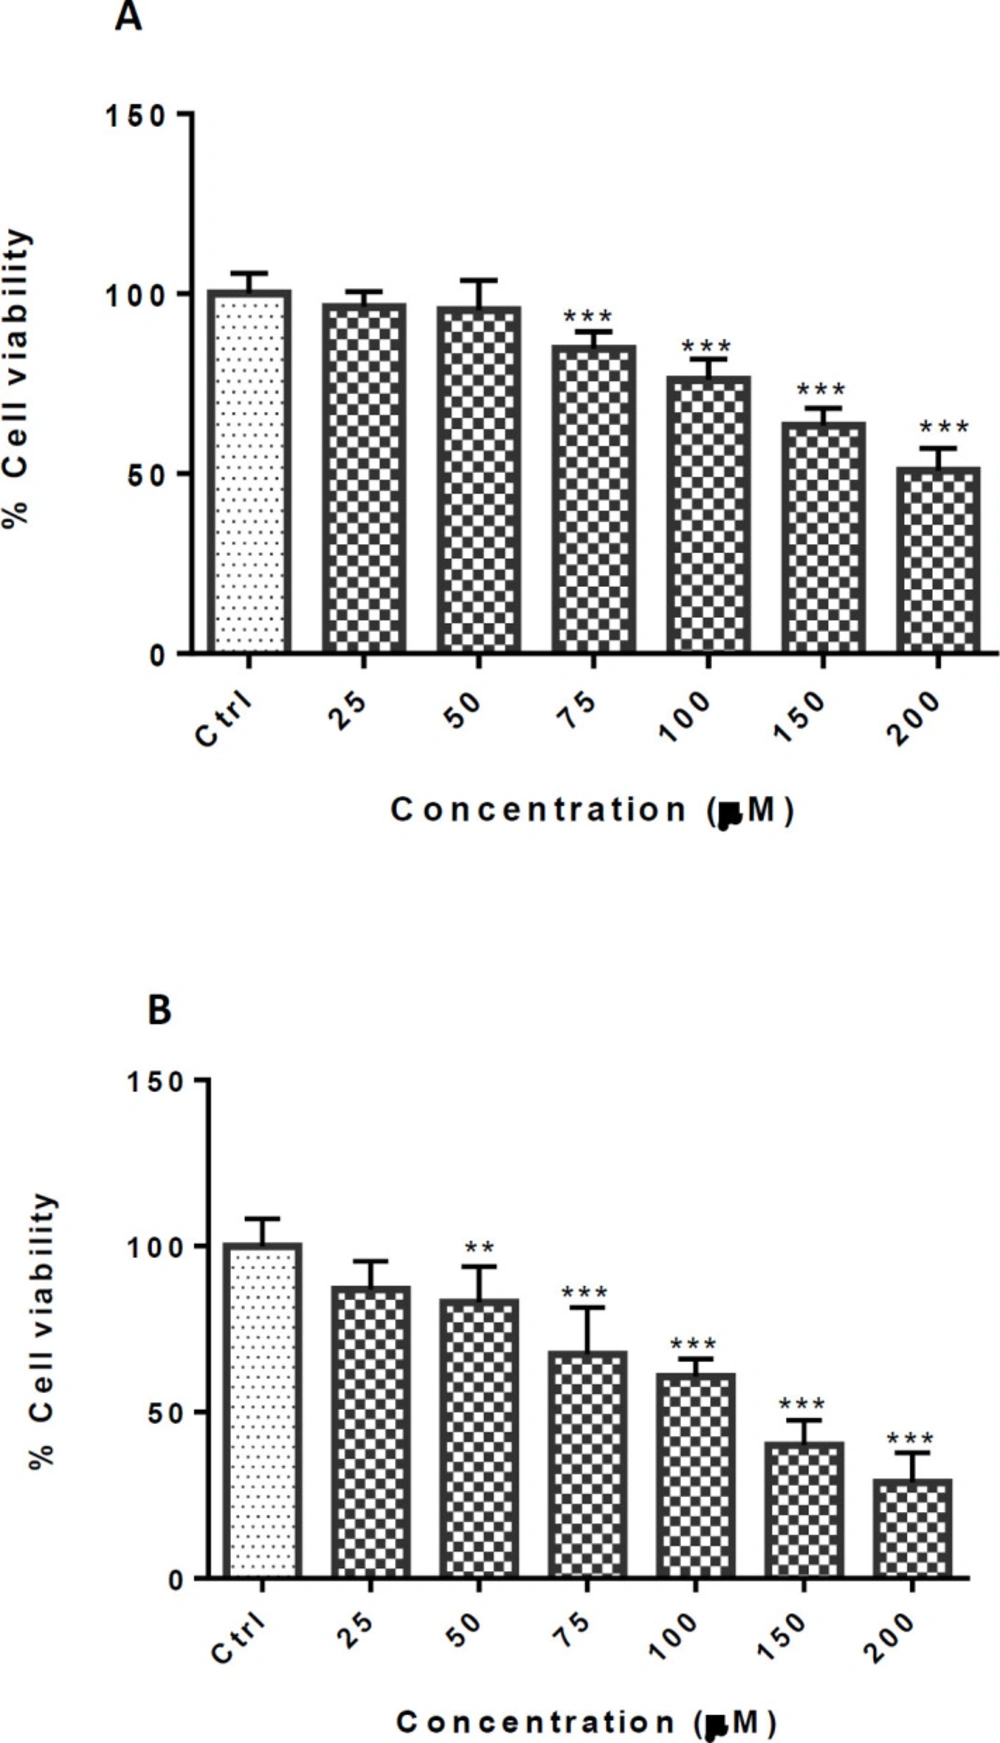
Effect of TCA on cell viability of PC12 cells. Cells were treated with different TCA concentrations for (A) 24 and (B) 48 h. Viability was quantitated by MTT assay. Data are expressed as mean ± SEM of six separate experiments. **P <0.01 and ***P < 0.001 vs. control group
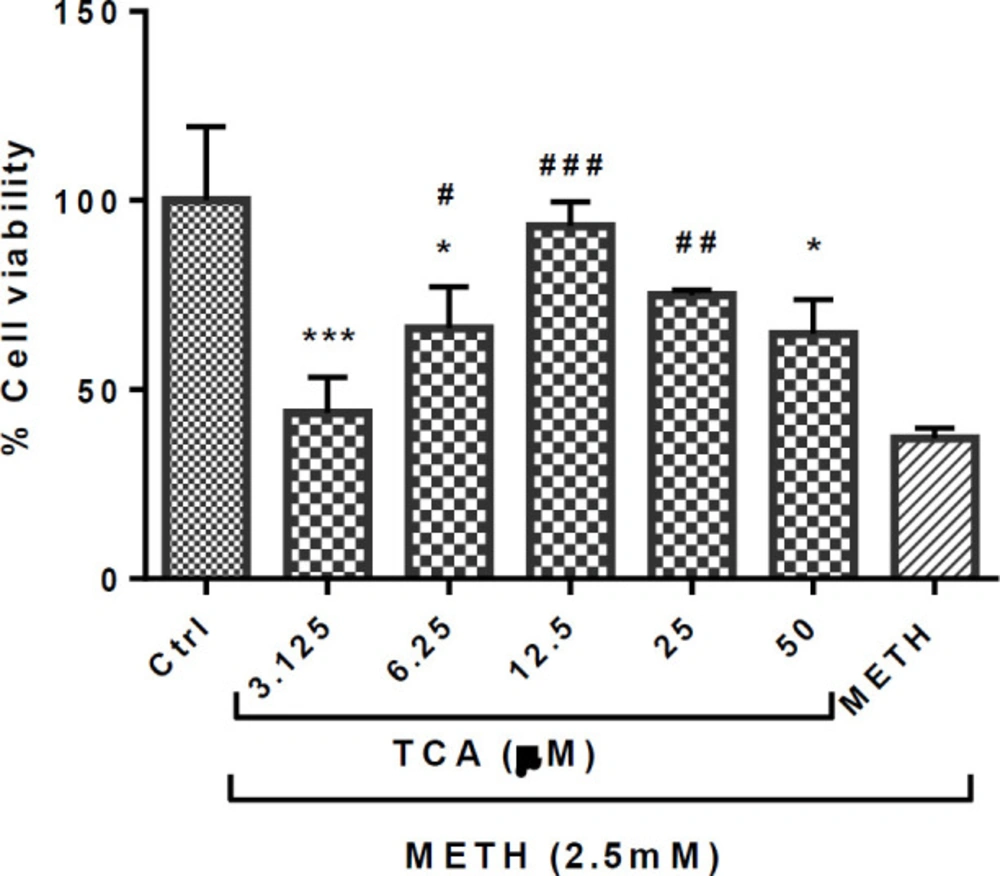
Effect of TCA on the METH-induced reductions in PC12 cell viability. Cell viability was assessed by MTT assay. PC12 cells were treated with TCA (3.125, 6.25, 12.5, 25 and 50 µM) for 24 h in the presence or absence of METH (2.5 mM). Data are expressed as mean ± SEM of six separate experiments. *P < 0.05 and ***P < 0.001 vs. control group, #P < 0.05, ##P < 0.01 and ###P < 0.001 vs. METH treated group
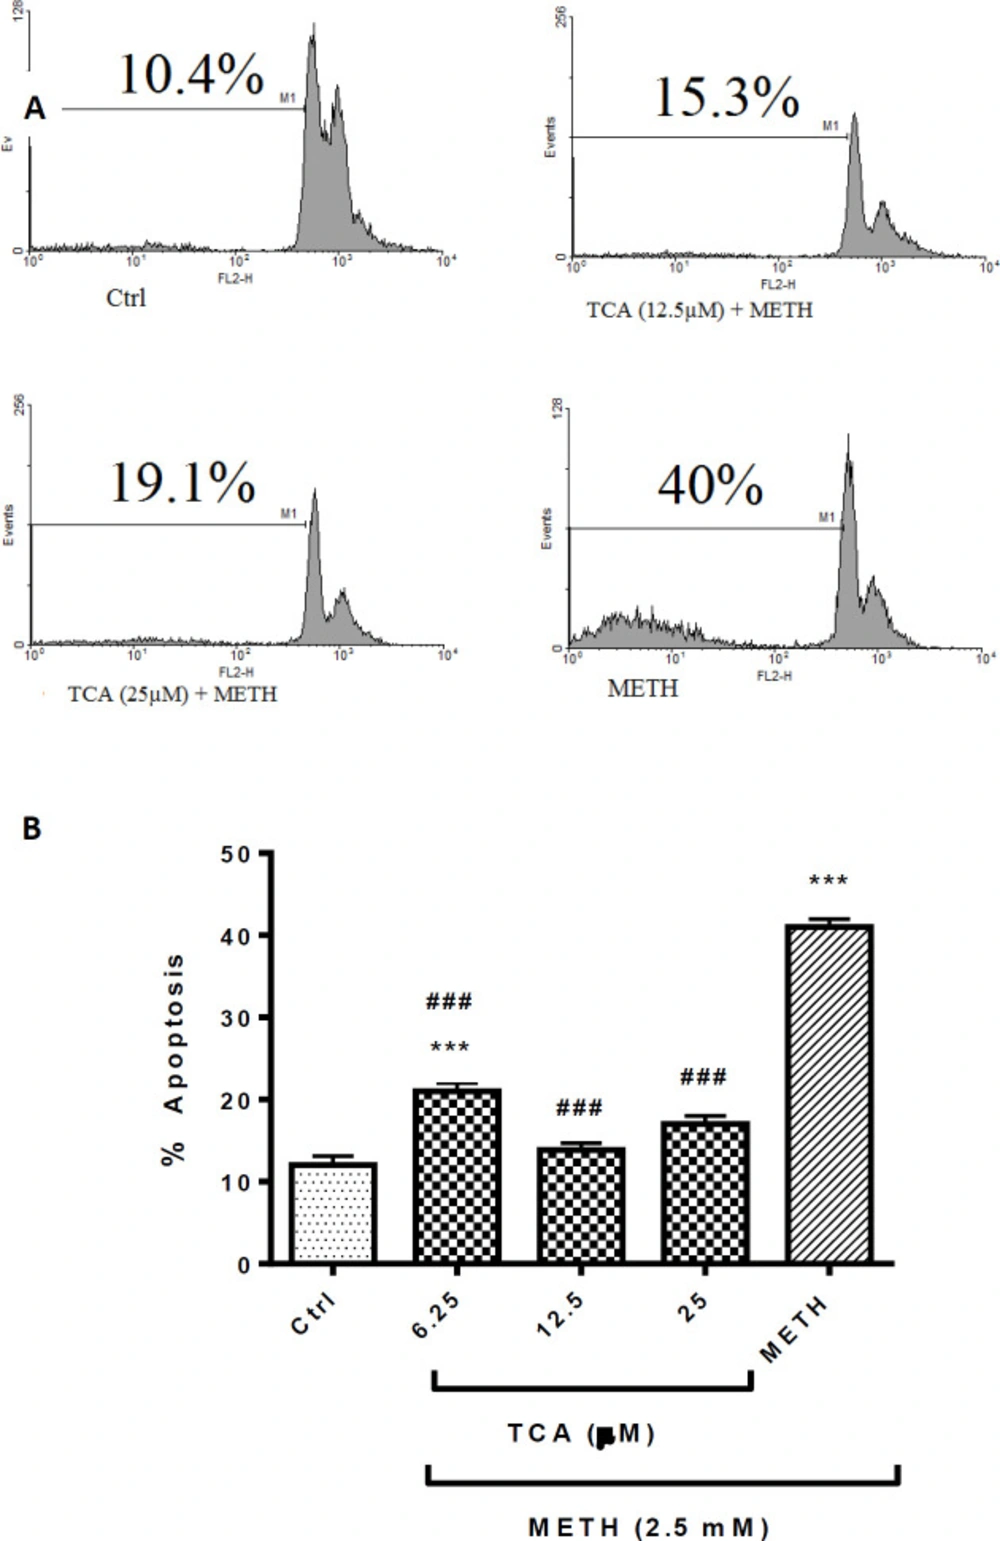
(A) Flow cytometry histograms of apoptosis assays by the PI method in PC12 cells Cells were treated with TCA (12.5 and 25 µM) for 24 h in the presence or absence of METH (2.5 mM). (B) The bar chart illustrates data as mean ± SEM of six separate experiments. ***P < 0.001 vs. control group, ###P< 0.001 vs. METH treated group
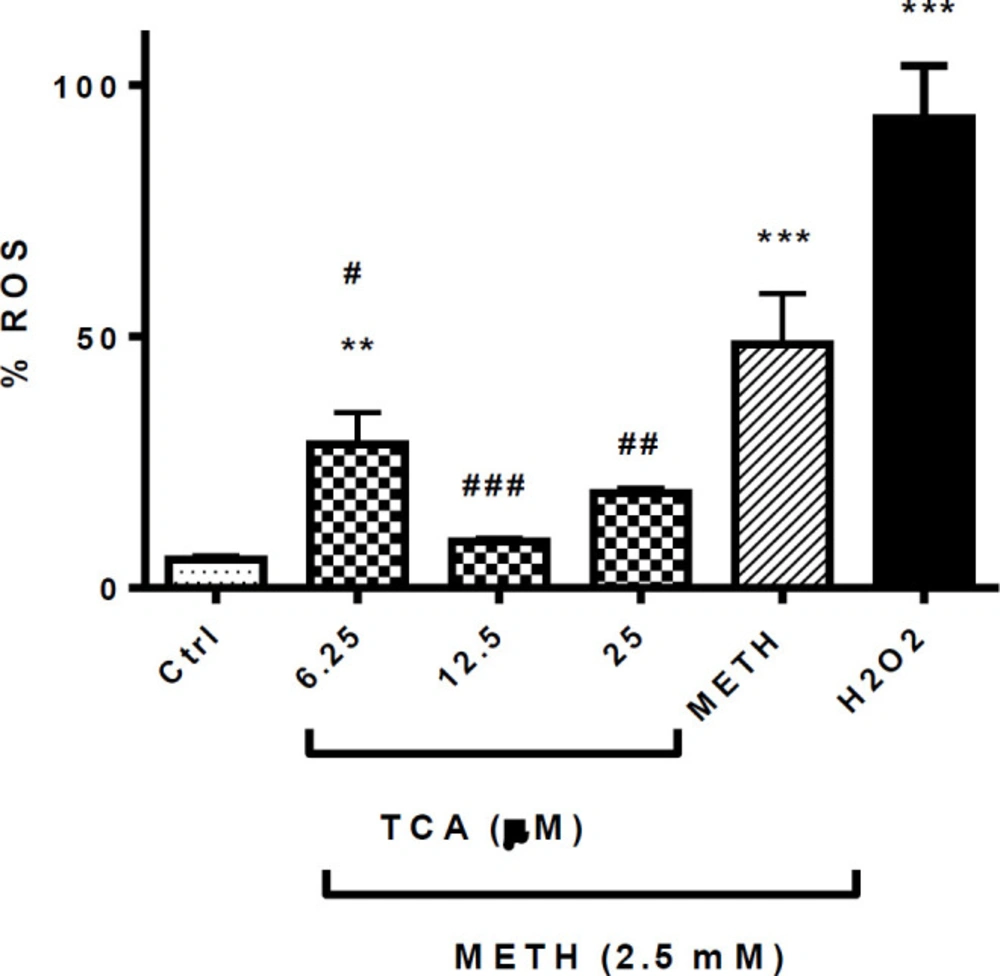
Effect of TCA on METH-induced ROS generation. Cell viability was assessed by MTT assay. PC12 cells were treated with TCA (12.5 and 25 µM) for 24 h in the presence or absence of METH (2.5 mM). Reactive oxygen species were measured using DCF-DA by flow cytometric analysis. Data are expressed as the mean ± SEM of six separate experiments. **P < 0.01 and ***P < 0.001 vs. Control, #P < 0.05, ##P < 0.01 and ###P < 0.001 vs. METH treated groups
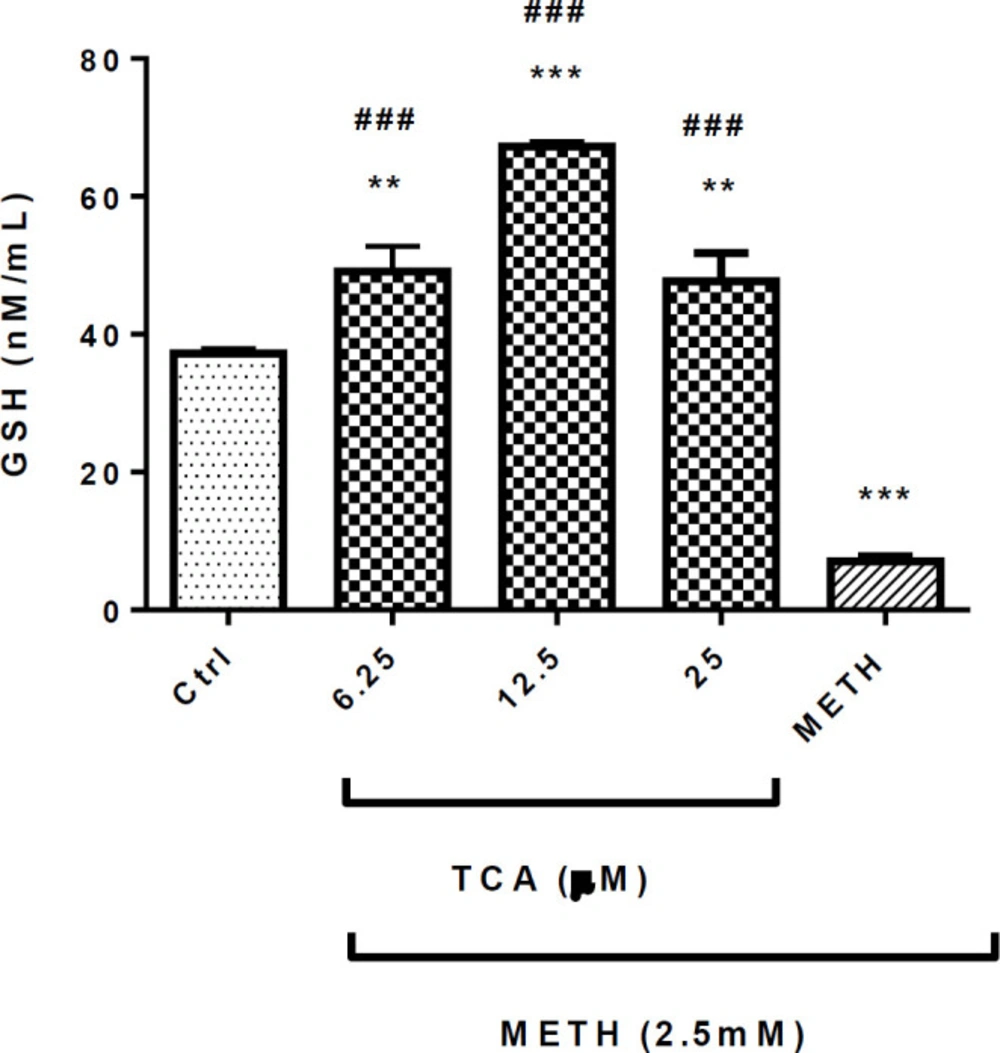
Effect of TCA on METH-decreased GSH generation. Cell viability was assessed by MTT assay. PC12 cells were treated with TCA (12.5 and 25 µM) for 24 h in the presence or absence of METH (2.5 mM). Data are expressed as the mean ± SEM of six separate experiments. ***P < 0.001 and **P < 0.01vs. control, ###P < 0.001 vs. METH treated cells
