
Introduction
Experimental
Results
Discussion
| Primer | Primer sequences (5' to 3') | Reference |
|---|---|---|
| p14ARF | GTGGGTTTTAGTTTGTAGTT | |
| p15INK4b | AAGCTGAGCCCAGGT CTCCTA | |
| p16INK4a | CCCGCTTTCGTAGTTTTCAT | |
| DNMT1 | GAG GAA GCT GCT AAG GAC TAG TTC |
| Cell line | Drug | Dose (μM ) | Duration (h) | Apoptosis (%) | P-value |
|---|---|---|---|---|---|
| PLC/PRF5 | zebularine | 74.65 | 24 | 48.27 | 0.001 |
| PLC/PRF5 | zebularine | 74.65 | 48 | 97 | 0.001 |
| PA-TU-8902 | zebularine | 98.82 | 24 | 12.54 | 0.001 |
| PA-TU-8902 | zebularine | 98.82 | 48 | 45.24 | 0.001 |
| Cell line | Gene | Drug | Dose (μM) | Duration (h) | Expression | P-value |
|---|---|---|---|---|---|---|
| PLC/PRF5 | p14ARF | zebularine | 74.65 μM | 24 | 2.9 | 0.001 |
| PLC/PRF5 | p14ARF | zebularine | 74.65 μM | 48 | 3.6 | 0.001 |
| PLC/PRF5 | p15INK4b | zebularine | 74.65 μM | 24 | 2.8 | 0.001 |
| PLC/PRF5 | p15INK4b | zebularine | 74.65 μM | 48 | 3.5 | 0.001 |
| PLC/PRF5 | p16INK4a | zebularine | 74.65 μM | 24 | 2.7 | 0.001 |
| PLC/PRF5 | p16INK4a | zebularine | 74.65 μM | 48 | 3.7 | 0.001 |
| PLC/PRF5 | DNMT1 | zebularine | 74.65 μM | 24 | 0.40 | 0.001 |
| PLC/PRF5 | DNMT1 | zebularine | 74.65 μM | 48 | 0.18 | 0.001 |
| PA-TU-8902 | p14ARF | zebularine | 98.82 μM | 24 | 2.4 | 0.001 |
| PA-TU-8902 | p14ARF | zebularine | 98.82 μM | 48 | 2.7 | 0.001 |
| PA-TU-8902 | p15INK4b | zebularine | 98.82 μM | 24 | 2.3 | 0.001 |
| PA-TU-8902 | p15INK4b | zebularine | 98.82 μM | 48 | 2.5 | 0.001 |
| PA-TU-8902 | p16INK4a | zebularine | 98.82 μM | 24 | 2.1 | 0.001 |
| PA-TU-8902 | p16INK4a | zebularine | 98.82 μM | 48 | 2.4 | 0.001 |
| PA-TU-8902 | DNMT1 | zebularine | 98.82 μM | 24 | 0.70 | 0.028 |
| PA-TU-8902 | DNMT1 | zebularine | 98.82 μM | 48 | 0.45 | 0.001 |
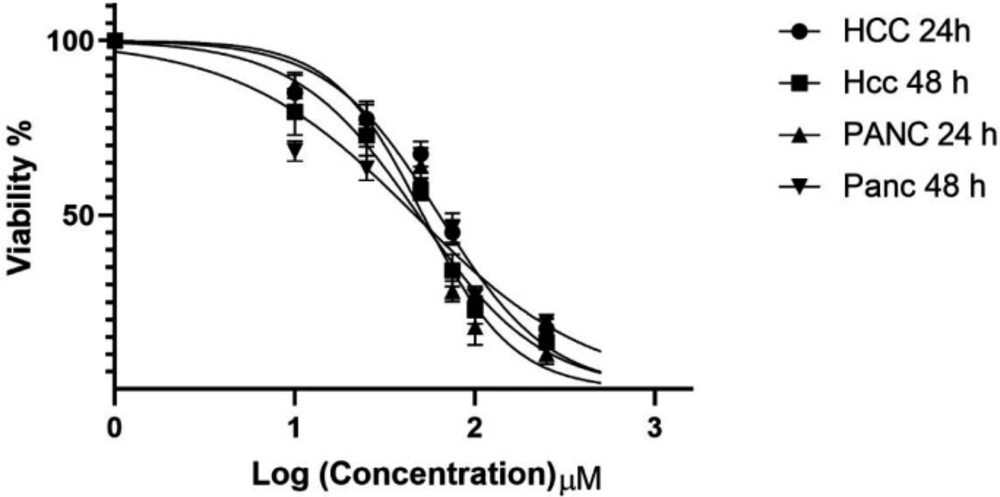
In-vitro effects of zebularine (0, 10, 25, 50, 75, 100, 250, and 500 μM) on PLC/PRF5 and PA-TU-8902 cell viability evaluated by MTT Assay at different times (24 and 48 h). Values are means of three experiments in triplicate. The zebularine had a dose- and time-dependent effect, statistical comparisons between groups were performed with ANOVA (One‑way ANOVA) and Turkey test
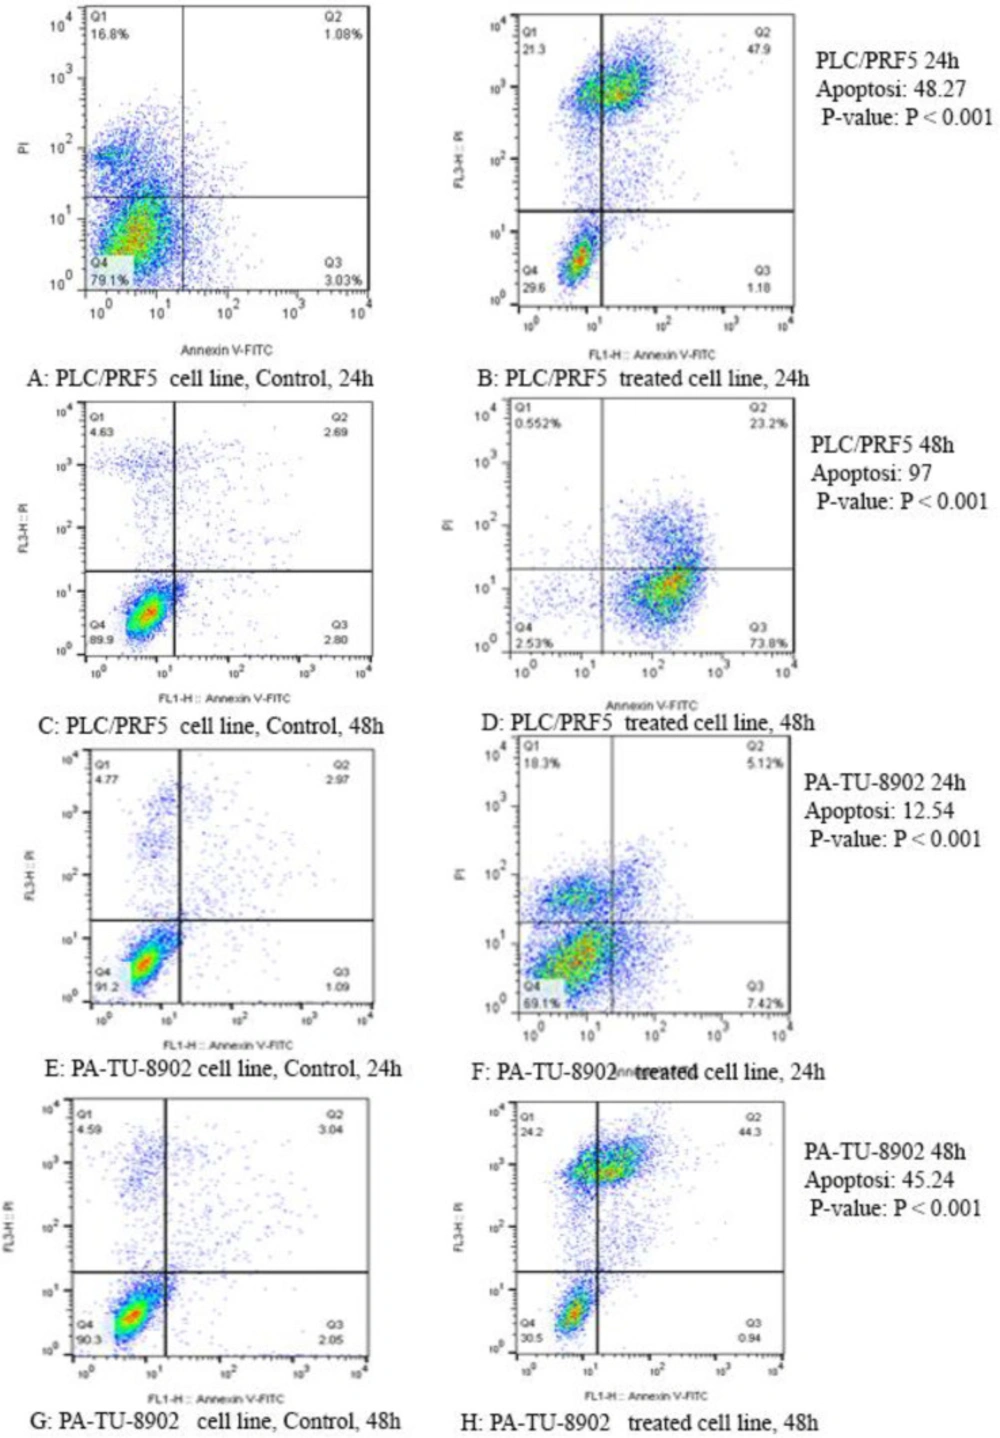
The apoptotic effect of zebularine on PLC/PRF5 and PA-TU-8902 cells (74.65 and 98.82 μM respectively) versus control groups at 24 and 48 h. The cells were treated with zebularine for 24 and 48 h, and the apoptotic effect was investigated by flow cytometric analysis. Results were obtained from three independent experiments and were expressed as mean ± standard error of the mean. The upper right quadrant of each figure shows the percentage of cells in late apoptosis, the lower right quadrant shows the percentage of cells in early apoptosis, the upper left quadrant shows the percentage of necrotic cells, and the lower left quadrant shows the percentage of viable cells. The zebularine induced apoptosis of both cell lines significantly in a time-dependent manner (P < 0.001)
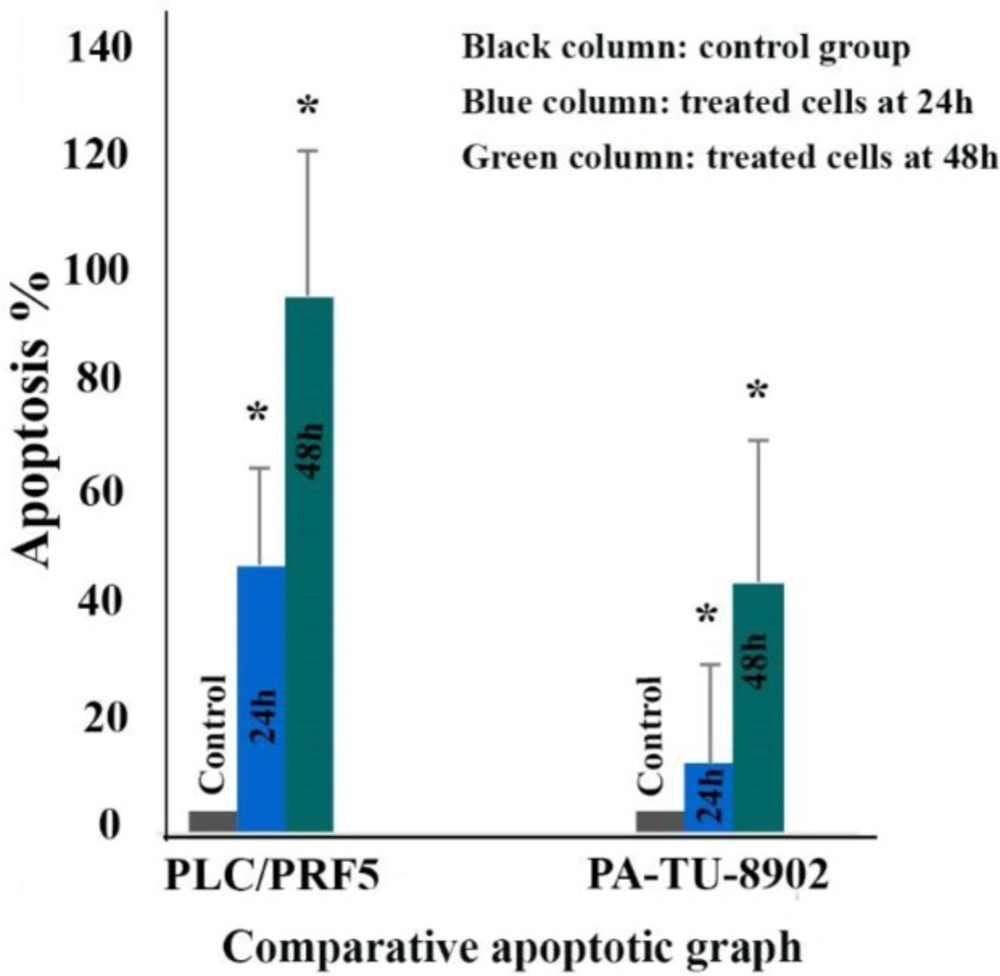
The comparative effects of zebularine at a concentration of 74.65 μM on PLC/PRF5 cells compared to PA-TU-8902 cells treated with zebularine at a concentration of 98.82 μM. The first column of each group belongs to the control group and the others belong to treated cells with the zebularine with the mentioned concentrations at 24 and 48 h. Asterisks (*) indicate significant differences between the treated and untreated control groups. As shown above, zebularine indicated a more significant apoptotic effect on PLC/PRF5 cells in comparison to PA-TU-8902 cells
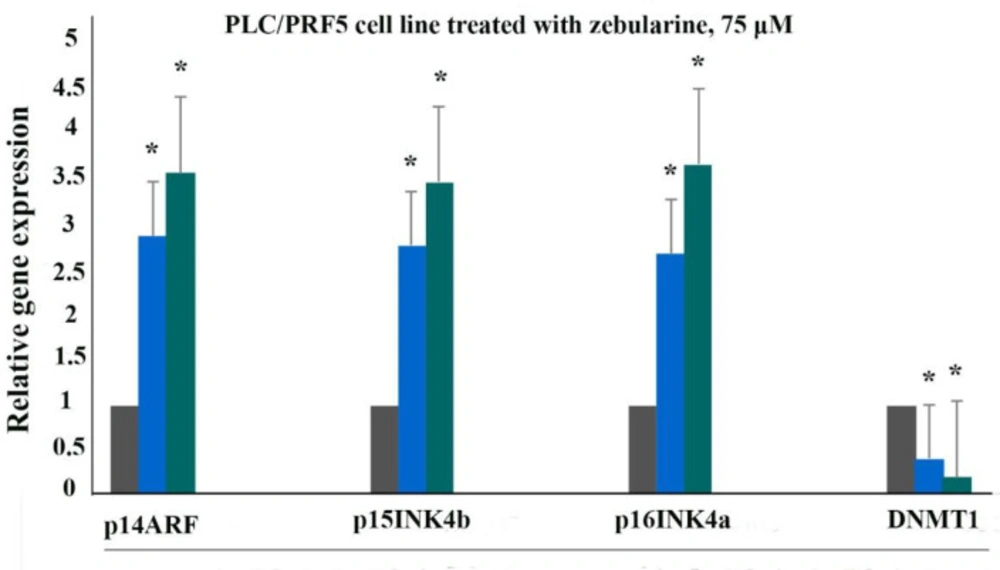
The relative expression level of p16INK4a, p14ARF, p15INK4b, and DNMT1 genes in the PLC/PRF5 cells treated with zebularine (74.65 μM) versus control groups at 24 and 48 h. The first column of each group belongs to the control group and the others belong to the treated cells with zebularine at 24 and 48 h. Asterisks (*) indicate significant differences between the treated and untreated groups
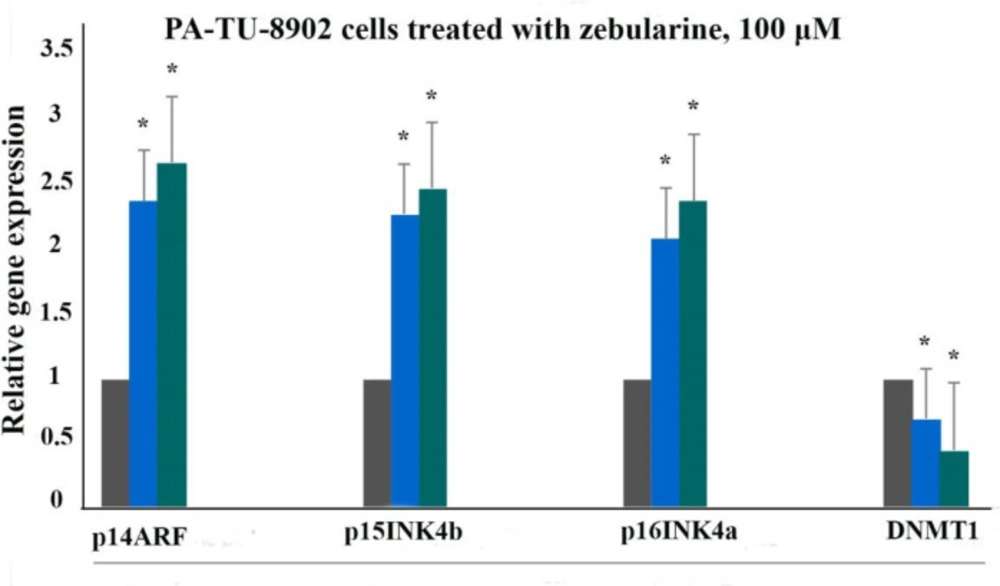
The relative expression level of p16INK4a, p14ARF, p15INK4b, and DNMT1 genes in the PA-TU-8902 cells treated with zebularine (98.82 μM) versus control groups at 24 and 48 h. The first column of each group belongs to the control group and the others belong to treated cells with the zebularine at 24 and 48 h. Asterisks (*) indicate significant differences between the treated and untreated groups
